International Journal of Emerging Technology and Advanced Engineering
Website: www.ijetae.com (ISSN 2250-2459,ISO 9001:2008 Certified Journal, Volume 4, Issue 8, August 2014)
463
Compressive Strength of Uniformly Corroded Steel Angle
Members Retrofitted with CFRP
Aparna Ben
1, Vikraman.R
2, Cinitha.A
3, P.K.Umesha
4, Eapen Sakaria
51
P.G. Student, 5HOD, Department of Civil Engineering, Saintgits College of Engineering, Kottayam, Kerala, India
2Project Assistant, 3Scientist,4Chief Scientist, CSIR-Structural Engineering Research Centre, Chennai
Abstract—As steel structures play an important role in civil constructions, more attention is needed for repairing and rehabilitation of such structures. One of the main problems facing steel structures is corrosion which effectively reduces total section area of steel members thus leading to stress concentration in the corroded area. One potential solution to these problems is retrofitting the corroded specimens with FRP. In the present study ISA 100 x 100 x 6mm angle sections of length 1m were corroded by galvanostatic method for the unpainted portion. Accelerated corrosion tests were proposed to carry out on angle specimens after conducting natural corrosion on the specimen by immersing the specimens in 3.5% NaCl solution for four months. Meanwhile, the specimens were subjected to alternate wetting and drying process so that the specimens will be induced to chloride induced corrosion. These corroded angles were then retrofitted using FRP composites with epoxy adhesives. The specimens were then subjected to compression testing in order to understand the strength aspects. Numerical validation of corroded and retrofitted specimens were carried out with general purpose finite element software ABAQUS. Also the theoretical values of design strength were calculated as per Rankine Gordan formula. The theoretical design strength values were then compared with the experimental values.
Keywords — ABAQUS, Accelerated Corrosion, Carbon fibre reinforced polymer (CFRP), Compressive strength, Rankine Gordan formula , Retrofitting
I. INTRODUCTION
Steel structures may have to be retrofitted due to various reasons. One of the major problems facing steel structures is corrosion which effectively reduces the gross cross sectional area of steel members thus leading to higher stresses in the corroded area. Reduction of member thickness also results in the reduction of member cross section properties such as area and section modulus thus affecting the buckling capacity of the members. In recent years, a continuous increase has been experienced in using CFRP for structural strengthening as well as repair works due to its high specific stiffness, corrosion resistance, less maintenance cost, weight and durability.
Residual capacity of the corroded members is evaluated by classifying the section according to the level of corrosion. But, at times it becomes very much difficult to assess the residual capacity of an existing structure. A damage model was proposed by Kayser and Nowak which evaluated the reliability of a corroded steel girder bridge over time. Another theory called ‘interval probability theory’ was proposed by Sarveswaran for assessing the reliability of corrosion-damaged steel structures. Using this theory, the remaining thickness of a severely corroded element was represented by an interval number which expressed the range over which there was uncertainty about the thickness. Later, a methodology was developed by Hathout for assessing the reliability of existing transmission structures and lines in the presence of structural deterioration. He derived the model for probability of failure as a function of the cumulative distribution of the standardized safety margin and the damage state of the structure and then expressed the failure probability in terms of the first four moments of the safety margin probability distribution function. In the present study steel angle sections were corroded by galvanostatic method and retrofitted using FRP composites with epoxy adhesives. The specimens were then subjected to compression testing in order to understand the strength aspects. Numerical validation of corroded and retrofitted specimens were discussed.
II. METHODOLOGY
International Journal of Emerging Technology and Advanced Engineering
Website: www.ijetae.com (ISSN 2250-2459,ISO 9001:2008 Certified Journal, Volume 4, Issue 8, August 2014)
[image:2.612.53.285.149.282.2]464
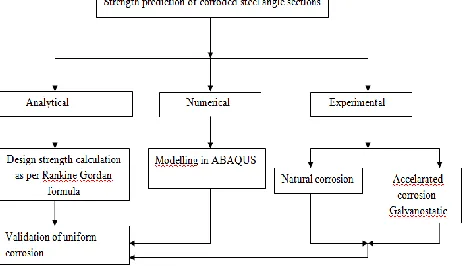
Fig 1: Flowchart representing the remaining strength predictionIII. ANALYTICAL STUDY
The sections under consideration come under the category intermediate column since l/r ratio is between 40 and 150. For the case of intermediate columns, Rankine Gordan Formula (RGF) has combined the two loads, that is, the crushing load for short column and the Euler’s buckling load for long columns.
According to Rankine Gordan’s formula,
Crippling load P =
Where Fy = yield stress
A = Area of the section
α = a constant depending upon the grade of steel and boundary conditions
For steel with Fy = 315 N/mm2 and with boundary
conditions both ends fixed, α = 1/30000 l = length of the specimen
k = slenderness ratio =
Ivv = minimum moment of inertia of the section
IV. EXPERIMENTAL PROGRAM
In total, three specimens were considered for the test, out of which one was kept as the control specimen and the other two were corroded. Initially, natural corrosion was conducted in the specimens by immersing them in 3.5% NaCl solution for about three months. Meanwhile, the specimens were subjected to alternate wetting and drying so that the specimens will be undergoing chloride induced corrosion.
[image:2.612.331.559.366.653.2]Later, the specimens were subjected to accelearated corrosion methodology. Corrosion was allowed to occur only for a height of about one-third from the bottom base plate. Galvanostatic corrosion method was used to induce corrosion where corrosion was induced artificially by keeping the current constant during the entire corrosion process by means of a galvanostat. In the present study, structural member which was subjected to corrosion acted as the anode and same steel was used as the cathode for obtaining continuity. The electrolyte used was 3.5% of sodium chloride, i.e. 35 gms of NaCl was required for 1 litre of water to get the desired salinity. By means of a galvanostat, the anode and cathode in the cell were connected to an external supply of constant current. The anode was connected to the positive terminal of the supply whereas the cathode was connected to the negative terminal. When the external power supply was switched on, the structural member acting as the anode got oxidized and the same metal used as the cathode got reduced resulting in a corroded section at the anode.
Fig 2: Initial condition of specimens during natural
corrosion
Fig 3: Final condition of specimens after natural
Corrosion
Fig 4:Schematic test setup for doing accelerated corrosion
International Journal of Emerging Technology and Advanced Engineering
Website: www.ijetae.com (ISSN 2250-2459,ISO 9001:2008 Certified Journal, Volume 4, Issue 8, August 2014)
[image:3.612.122.233.136.280.2]465
Fig 6: 100 x 100 x 6mm (1m)specimen after being subjected to accelerated corrosion
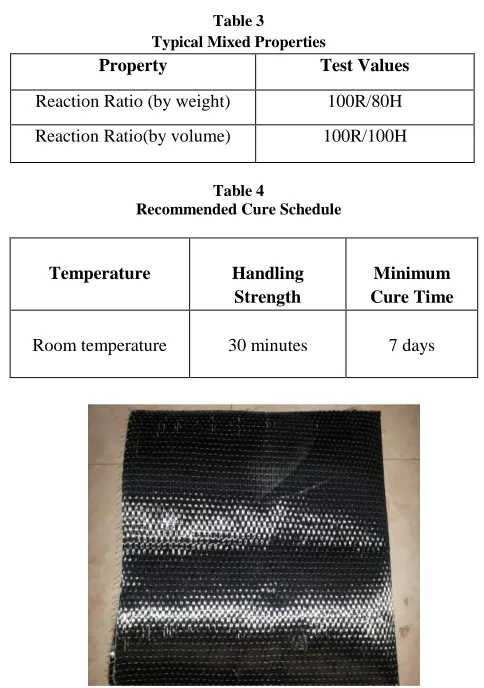
After conducting accelerated corrosion, one of the corroded specimen was retrofitted with carbon fibre reinforced polymer (CFRP) using an adhesive. The basic materials required for retrofitting with their typical properties are as tabulated below:
i) Carbon fibre reinforced polymer (CFRP)
Carbon fibre is defined as a fibre containing at least 92% carbon by weight. Carbon fibres generally have excellent tensile properties, low densities, high thermal and chemical stabilities in the absence of oxidizing agents, good thermal and electrical conductivities, and excellent creep resistance.
ii) Adhesive
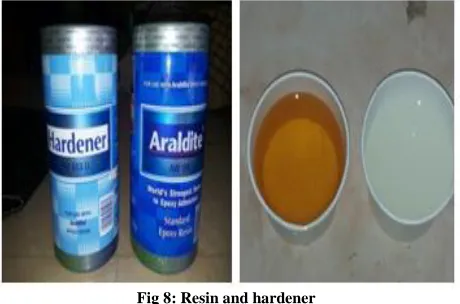
In the present study, the adhesive used for binding CFRP to steel angle section was Araldite AW 106 resin/Hardener HV 953U epoxy adhesive. It is a multi-purpose, viscous material that is suitable for bonding a variety of materials including metal, ceramic, and wood.
Table 1
Typical Properties Of Cfrp Used Property Test Values
Modulus of Elasticity 240GPa
Tensile strength 3800N/mm2
Density 1.7g/cm3
Poisson’s ratio 0.22
Table 2
Typical Properties Of Adhesive Property Test
Method
Resin Hardener
Colour/ Appearance
Visual Creamy, viscous/ liquid
Amber Liquid
Specific Gravity ASTM D-792
1.17 0.92
Viscosity (cP) @ 25°C
ASTM D-2393
[image:3.612.319.561.322.666.2]50,000 35,000
Table 3 Typical Mixed Properties
Table 4
Recommended Cure Schedule
Property Test Values
Reaction Ratio (by weight) 100R/80H
Reaction Ratio(by volume) 100R/100H
Temperature Handling Strength
Minimum Cure Time
Room temperature 30 minutes 7 days
[image:3.612.49.283.515.646.2]
International Journal of Emerging Technology and Advanced Engineering
Website: www.ijetae.com (ISSN 2250-2459,ISO 9001:2008 Certified Journal, Volume 4, Issue 8, August 2014)
[image:4.612.324.563.123.299.2]466
Fig 8: Resin and hardener [image:4.612.55.285.139.291.2]Initially, the corroded portion of the angle specimens to be retrofitted was properly ground and cleaned with acetone in order to have proper binding with CFRP. The resin and the hardener was then mixed in 1:1 proportion by volume and applied with a spatula to the pretreated surfaces. Immediately after applying the resin-hardener mix to the surface with a painting brush, CFRP was properly pasted to the corroded portion of the specimen. After pasting CFRP to the corroded surface, one more coat of the resin-hardener mix was applied over the CFRP in order to have proper binding and to protect the fibres from getting damaged. The various steps involved in the retrofitting technique are pictorially presented below:
Fig 9: Application of the resin-hardener mix
Fig 10: Pasting of CFRP
Fig 11: Pasting of CFRP(different view)
Fig 12: Application of additional coat of resin hardener mix
[image:4.612.49.295.452.592.2]After retrofitting the specimens, the specimens were subjected to compression test. For performing compression test, the specimens were initially placed between the two heads in such a way that the centre of the flange plates of the specimen coincides with the centre of bottom platform and the top head of the compression testing machine. A total of five LVDTs including two laser LVDTs were used to measure deflection. Two numbers of strain gauges were placed on the uncorroded specimens whereas in the corroded specimen a total of four strain gauges were pasted. At each load stage, deflection measurements were recorded automatically using a data logger, which is connected to a computer.
[image:4.612.328.562.462.623.2]International Journal of Emerging Technology and Advanced Engineering
Website: www.ijetae.com (ISSN 2250-2459,ISO 9001:2008 Certified Journal, Volume 4, Issue 8, August 2014)
467
Fig 14: Buckling modes of retrofitted, corroded and uncorrodedspecimens 100 x 100 x 6mm(1m)
V. NUMERICAL MODELLING USING ABAQUS SOFTWARE
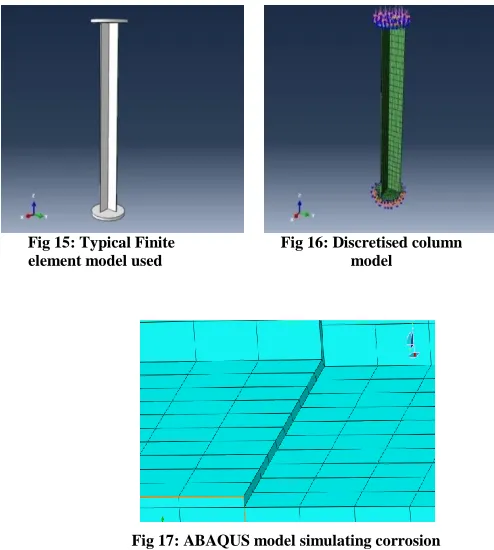
In the present study, angle sections MS 100 x 100 x 6mm with 1m length was considered. Flange plates of diameter 200mm and thickness 16mm were fixed at both the ends of the angular member. They were then subjected to axial compressive forces. As outer surface area is more susceptible to uniform corrosion, material from the outer surface of the member was removed to simulate corrosion. Hence, for modelling uniform corrosion using ABAQUS software, the average thickness reduction was considered. The analysis was done by taking into account the non linear properties. The solid element used is element C3D8R (Continuum, 3D, 8 node, Reduced Integration).It is an eight noded linear hexahedral brick element and is used for modelling because of the relatively small leg thickness of the angular section compared to the other dimensions which results in local buckling when subjected to axial compressive load. A kinematic coupling restraint is defined to constrain the motion of the top flange plate to the regions below where all the translational and rotational degrees of freedom are specified. Reference point is then established in the top flange plate which passes through the centroid of the section under consideration. Boundary conditions are then given with all translation degrees of freedom at top surface nodes except the vertical displacement as fixed and all degrees of freedom restrained at bottom. Then axial loading condition is simulated by applying load to the reference point. The STATIC, RIKS approach is used to solve nonlinear problems. In this method, load magnitude is considered as an additional unknown and thus loads and displacements are solved simultaneously. The results of interest are the current displacements and the loads which may be referred to a load proportionality factor.
The ultimate load is obtained by multiplying the load given with the load proportionality factor.
[image:5.612.62.291.104.284.2]Fig 15: Typical Finite element model used
[image:5.612.325.572.162.437.2]Fig 16: Discretised column model
Fig 17: ABAQUS model simulating corrosion
VI. RESULTS AND DISCUSSIONS
International Journal of Emerging Technology and Advanced Engineering
Website: www.ijetae.com (ISSN 2250-2459,ISO 9001:2008 Certified Journal, Volume 4, Issue 8, August 2014)
468
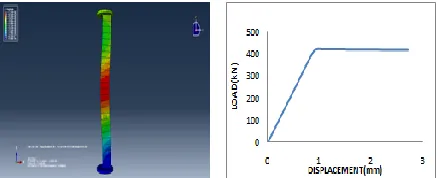
[image:6.612.339.555.140.230.2]This is because of thefact that as the specimens corrodes, the dimension reduces which in turn reduces the moment of inertia and thus the deflection increases. This is evident from the theoretical values and the ABAQUS results.
[image:6.612.62.282.191.280.2]Fig 18:Deflection contour and load-deflection graph for uncorroded 100 x 100 x 6mm(1m) specimen
[image:6.612.61.282.194.547.2]Fig 19:Deflection contour and load-deflection graph for 10% corroded 100 x 100 x 6mm(1m) specimen
Fig 20: Deflection contour and load-deflection graph for 15.11%corroded 100 x 100 x 6mm(1m) specimen
Fig 21:Deflection contour and load-deflection graph for 20% corroded 100 x 100 x 6mm(1m) specimen
Fig 22:Deflection contour and load-deflection graph for 30% corroded 100 x 100 x 6mm(1m) specimen
[image:6.612.333.554.279.366.2] [image:6.612.338.558.408.498.2]International Journal of Emerging Technology and Advanced Engineering
Website: www.ijetae.com (ISSN 2250-2459,ISO 9001:2008 Certified Journal, Volume 4, Issue 8, August 2014)
[image:7.612.42.289.168.352.2]469
Table 5Comparison of numerical and analytical values of 100 x 100 x 6mm (1m) corroded and uncorroded specimen
Sl.No Percentageof corrosion (%)
Numerical value(kN)
Analytical value(kN)
1 0% 338.04 338.05
2 10% 305.18 320.29
3 15.11% 288.05 302.34
4 20% 271.92 285.80
5 30% 237.18 251.08
6 40% 204.15 216.13
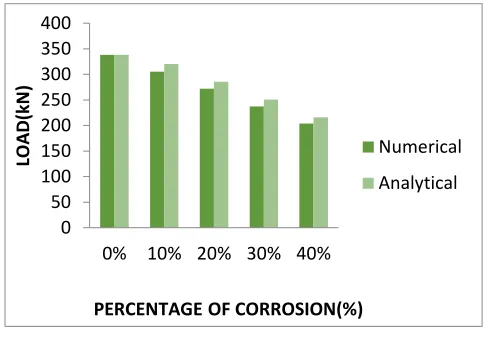
A comparison between the numerical and analytical values of the load carrying capacities of the uncorroded and corroded specimens are tabulated as shown in Table 5. From the analysis, it can be observed that the mode of failure in corroded members is also buckling as in the case of uncorroded members with the only difference that the position of buckling is near the location of thickness reduction and not at the center. This is because of higher compressive stresses caused due to the reduction in the cross sectional area in the bottom portion due to corrosion.
A comparison between analytical, numerical and
[image:7.612.323.565.204.399.2]experimental values of the specimens is tabulated as shown below.
Table 6
Experimental values of the 100 x 100 x 6mm(1m) uncorroded, corroded and retrofitted specimens
Sl.No Remarks Percentage of corrosion
(%)
Ultimate load (kN)
1 Uncorroded 0 327.47
2 Corroded 15.11 203.50
3 Retrofitted 12.14 242.14
A bar chart showing the comparison of the buckling loads of 100 x 100 x mm (1m) corroded specimen using numerical and analytical methods is shown in Fig 24. From the bar chart, it can be seen clearly that with the increase in the percentage of corrosion, the strength decreases.
[image:7.612.323.565.454.629.2]Also, the analytical value computed using Rankine Gordan formula is found to be very closer to the numerical value obtained from ABAQUS. Another bar chart showing the ultimate loads of uncorroded, corroded and retrofitted specimens are shown in Fig. 25.
Fig 25: Ultimate loads of uncorroded, corroded and retrofitted specimens
Fig 24: Comparison of the buckling loads of 100 x 100 x mm(1m) corroded specimen using numerical and analytical methods
VII. CONCLUSIONS
This work presents the compression test of 3 members, out of which two are corroded at a level corresponding to weight loss ranging from 12% to 16%.
Experimental Uncorroded 327.47 Corroded 203.5 Retrofitted 242.14 0 50 100 150 200 250 300 350 L O ADk N) 0 50 100 150 200 250 300 350 400
0% 10% 20% 30% 40%
LOA
D
(k
N
)
PERCENTAGE OF CORROSION(%)
Numerical
[image:7.612.43.289.542.653.2]International Journal of Emerging Technology and Advanced Engineering
Website: www.ijetae.com (ISSN 2250-2459,ISO 9001:2008 Certified Journal, Volume 4, Issue 8, August 2014)
470
The capacity of corroded members lost between 20% and 40% of their uncorroded capacity. The reduction in capacity of many members was predicted using Rankine Gordan formula, which gave a closer value compared to the experimental value. The numerical, analytical and experimental study confirms that there is a drastic reduction in the load carrying capacity of the member for 40% thickness reduction compared to the uncorroded specimens. From the compression test carried out on the specimens, it was concluded that corrosion has a major impact on the failure mode of the member. For the uncorroded members, buckling was observed at mid height whereas in the case of corroded members, the critical region of failure shifted towards the location of minimum thickness with the increase in the percentage of corrosion. Out of the two corroded specimens in the set, one was retrofitted with CFRP and subjected to compression testing. From the experimental results, the ultimate load carrying capacities of the uncorroded, corroded and retrofitted specimens were obtained as 327.47kN, 203.5kN and 242.14kN respectively. It can thus be verified that the retrofitted specimen showed an improvement in strength by 11.8% compared to the corroded specimen without being retrofitted. Thus external bonding of CFRP has been clearly established as a promising alternative strengthening technique for steel structures.
Acknowledgement
This paper is published with the kind permission of the Director, CSIR- Structural Engineering Research centre, Chennai, India.
REFERENCES
[1] Jack.R.Kayser. Andrzej. S. Nowak, ―Capacity Loss due to corrosion in steel- Girder Bridges‖, Journal of Structural Engineering, Vol. 115, No. 6, 1989, pp.1525-1537.
[2] Sarveswaran V, Smith J.W, ―Structural assessment of corrosion damaged steel beams using minimum capacity curves‖, Journal of the structural Engineer, Vol. 77, No.14 1999, pp. 17-23.
[3] Beaulieu. L.V, Legeron F and Langlois S, ―Compression strength of corroded steel angle members‖, Journal of Constructional Steel Research, Vol.66, 2010, pp.1366-1373.
[4] Hathout, ― Damage assessment and soft reliability evaluation of existing transmission lines‖, 8th International Conference on
Probabilistic Methods applied to power systems, Iowa State University, Ames, Iowa, September, Vol.12, No 16, 2004, pp.980-986.
[5] Shaat.A, Fam. Z. Amir, ―Slender Steel Columns Strengthened using High Modulus CFRP Plates for Buckling‖, ASCE, Journal of Composites for construction, Vol.13, No 1, 2009, pp.2-12.
[6] Tavakkolizadeh, M., Sadatmanesh, H., ―Galvanic Corrosion of Carbon and Steel in Aggressive Environment‖ Journal of Composites for construction. ASCE, Vol. 5, No. 3, August 2001, pp. 200-210.
[7] Ganesh Prabhu.G , Sundarraja. M.C., ―Behaviour of concrete filled steel tubular (CFST) short columns externally reinforced using CFRP strips composite‖, Construction and Building Materials, Vol. 47, 2013, pp.1362–1371.
[8] Oszwald.K, ―Effect of corrosion on the buckling of steel angle elements‖, Proc. 8th International Symposium in Civil Engineering,
Lyngby, Denmark, 2010, pp. 549-554.
[9] Appuhamy. J.M.R.S, ―Prediction of Residual strength of corroded tensile steel plates‖, International Journal of steel structures, Vol. 11, No 1, 2011, pp. 65-79.