International Journal of Emerging Technology and Advanced Engineering
Website: www.ijetae.com (ISSN 2250-2459, ISO 9001:2008 Certified Journal, Volume 8, Issue 1, January 2018)
96
Effect of LPG/ Hydrogen Substitution in Performance of CI
Engine
Er. Manoj Kumar Saud, MBA, ME
1, Dr. Dimbendra Kumar Mahanta
21Research Scholar, 2Professor, Department of Mechanical Engineering, Assam Engineering College, Gauhati University,
Guwahati, Assam, India, Pin: 781013
Abstract-- In all the important sectors of our day to day life such as transportation, agricultural and construction and also for generation of electricity as a source of power in areas without connection of power grids or when power grid fails, the IC engines play a very important role. In order to reduce the use of fossil fuel which is depleting at a very fast rate because of the increase in the number of automobiles or electricity generator set, research works are being performed to use various alternative fuels in IC engine. Though alternative liquid fuels such as biodiesel are widely being researched, now LPG, CNG, hydrogen etc. are also getting more importance as an alternative gaseous fuel (AGF) because of its various advantages. The use of these alternative gaseous fuels is a promising approach to reduce the dependence on the petroleum based fossil fuels and also in reduction of pollution.
The use of LPG or hydrogen alone in CI engines without an ignition source is not possible due to its low cetane number. So, to improve the performance of CI engine one of the important strategies is to use alternative fuels such as LPG or hydrogen in dual fuel modes. In dual fuel modes, LPG or hydrogen in gaseous form is supplied to the engine cylinder to form mixture with air which is ignited by the diesel injected by injection system as in conventional CI engine. In order to exploit the different advantages of CI engine such as high power, low fuel combustion etc., use of these alternative gaseous fuels will be a suitable option.
To investigate the performance of two alternative gaseous fuels (AGF), LPG and hydrogen, these fuels were used with diesel in a four stroke single cylinder CI engine (rated power 3.7 kW at 1500rpm) computerized test rig with eddy current dynamometer after modifying it to supply the gaseous LPG and hydrogen in LPG-diesel dual fuel (LDDF) modes and hydrogen-diesel dual fuel (HDDF) modes respectively.
The addition of LPG or hydrogen with diesel in dual fuel modes showed mixed response in terms of performance parameters like engine power, thermal efficiency, mechanical efficiency, volumetric efficiency, and specific fuel consumption.
Keywords: CI engine, Alternative fuels, Hydrogen, LPG, Efficiency, Dual fuel mode, LDDF mode, HDDF mode.
I. INTRODUCTION
The performance of an engine can be analysed with the help of the performance parameters like indicated power, brake power, indicated thermal efficiency, brake thermal efficiency, mechanical efficiency, volumetric efficiency, indicated specific fuel consumption and brake specific fuel consumption were considered.
The performance of the engine in diesel mode, in LDDF mode I, II, III, IV & V at LPG supplied rate of 0.2 l/min, 0.5 l/min, 1.0 l/min, 1.5 l/min & 2.0 l/min respectively in combination with diesel and in HDDF mode I, II, III, IV & V at hydrogen supplied rate of 2 l/min, 4 l/min, 6 l/min, 8 l/min & 10 l/min respectively in combination with diesel were compared.
II. ANALYSIS OF PERFORMANCE PARAMETERS
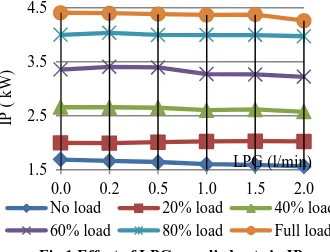
A.Indicated power(IP)
The IP of the engine in all fuelling modes, i.e., diesel mode, LDDF modes and HDDF modes increased as the load was increased due to increase rate of combustion of fuel supplied.
1) IP in LDDF Modes:
The IP of the engine decreased marginally as the proportion of LPG in LDDF modes was increased compared to the diesel mode for all load conditions because of lower burning rate of LPG.
1.5 2.5 3.5 4.5
0.0 0.2 0.5 1.0 1.5 2.0
IP
(
k
W
)
[image:1.612.362.527.561.687.2]LPG (l/min)
Fig 1 Effect of LPG supplied rate in IP at different loads
International Journal of Emerging Technology and Advanced Engineering
Website: www.ijetae.com (ISSN 2250-2459, ISO 9001:2008 Certified Journal, Volume 8, Issue 1, January 2018)
97
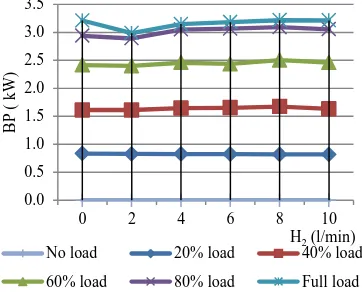
2)IP in HDDF Modes:
At higher loads, the IP was observed to be increased as the proportion of hydrogen was increased because of higher CV of hydrogen. The IP of the engine was the highest in HDDF mode-V with 10 l/min supplied rate of hydrogen amongst all fuelling mode under consideration. In HDDF modes the IP of the engine at lower loads was observed to be decreased as the proportion of hydrogen was increased compared to the diesel mode because of lower burning rate of hydrogen at lower loads.
3)Comparison of IP in different fuelling modes:
In baseline diesel mode, the highest value of IP was 4.40 kW; while these values in LDDF IV & HDDF mode-V were 4.37 kW and 4.41 kW respectively. The IP of the engine was lowest with HDDF mode-I, i.e., at lowest supplied rate because the small amount of hydrogen supplied could not mix and burn with air and hence the power output of the engine was reduced. In HDDF mode-V, hydrogen could properly mix with air and burn in sufficient quantities producing more power. Similarly, the IP of the engine in LDDF modes was lesser than diesel mode.
B.Brake Power(BP):
The BP of the engine in all fuelling modes, i.e., diesel mode, LDDF modes and HDDF modes increased as the load was increased due to higher rate of combustion of fuel.
1)BP in LDDF Modes:
The BP of the engine was found to be decreased with the increase in the supplied rate of LPG and the lowest value of BP was recorded in LDDF mode-V, amongst all the LPG supplied rates and the diesel mode because of reduction of BTE.
2)BP in HDDF Modes:
The power output of the engine increased as the proportion of hydrogen in HDDF modes was increased compared to the diesel mode for all load conditions except HDDF mode-I due to higher CV of hydrogen [Fig 4]. 1.5
2.5 3.5 4.5
0.0 2.0 4.0 6.0 8.0 10.0
IP
(
k
W
)
[image:2.612.333.533.139.306.2]H2 (l/min)
Fig 2 Effect of hydrgen supplied rate on IP at different loads
No load 20% load 40% load
60% load 80% load Full load
0.0 1.0 2.0 3.0 4.0
0.0 0.2 0.5 1.0 1.5 2.0
B
P
(
k
W
)
[image:2.612.82.261.262.413.2]LPG (l/min)
Fig 3 Effect of LPG supplied rate on BP at different loads
No load 20% Load 40% Load
60% Load 80% Load Full load
0.0 0.5 1.0 1.5 2.0 2.5 3.0 3.5
0 2 4 6 8 10
B
P
(
k
W
)
H2 (l/min)
Fig 4 Effect of H2 supplied rates on BP at
different loads
No load 20% load 40% load
[image:2.612.354.535.452.598.2]International Journal of Emerging Technology and Advanced Engineering
Website: www.ijetae.com (ISSN 2250-2459, ISO 9001:2008 Certified Journal, Volume 8, Issue 1, January 2018)
98
The maximum BP of the engine in HDDF modes was observed at HDDF mode-IV for all load conditions, further increase of supplied rate of hydrogen, i.e., at 10 l/min supplied rate of hydrogen the BP was found to be reduced marginally for all load conditions because of reduction of air supply.
The BPs of the engine in HDDF modes at different loads initially decreased at 2 l/min supplied rate of hydrogen and then BP started increasing as the proportion of hydrogen was increased for all load conditions except 20% load [Fig 4]. A maximum of 5.23% increase of BP was observed at 80% load in HDDF mode-IV compared to the diesel mode. Due to lower density of hydrogen, it replaced air from the CC resulting in lesser energy content of the mixture in the CC. So, at HDDF mode-V, BP was dropped compared to HDDF mode-IV in part load, but at no load and full load the value remained almost same.
3)Comparison of BP in different fuelling modes:
The BPs in LDDF modes in all supplied rate of LPG and in HDDF mode-I were lower than that of diesel mode, while in HDDF mode-V except at lower loads, the BPs were higher than that of diesel mode.
In baseline diesel mode, the highest value BP was 3.21 kW, while these values were 3.14 kW in LDDF mode-IV, and 3.22 kW in HDDF mode-IV respectively. However, no further improvement of BP was observed on increasing the supplied rate of AGF, LPG or hydrogen.
It indicates that the power output of the engine dropped by LPG substitution due to lower combustion rate and higher frictional losses, while the in HDDF modes, it was increased for higher CV of hydrogen.
C. Indicated Thermal Efficiency(ITE):
The ITE of the engine in all fuelling modes increased as load was increased up to about 60%-80% of load and at 100% load the value reduced.
1)ITE in LDDF Modes:
The ITE in LDDF modes at lower loads, i.e., up to 40% loads, decreased as LPG supplied rate was increased, but at higher supplied rates of LPG, the ITE increased with the increase of load except at full load [Fig 5].
The ITE of the engine in LDDF modes was higher compared to the ITE of the engine using diesel only except in lower loads and LDDF mode-V. At lower loads in all LDDF modes the combustion of fuel was incomplete due to lower temperature in the CC. So, the value of ITE was less in these operating conditions. Again in LDDF mode-V at all loads, the supplied LPG reduced the space for air leading to lesser air supply to the CC causing incomplete combustion and resulted in lower ITE.
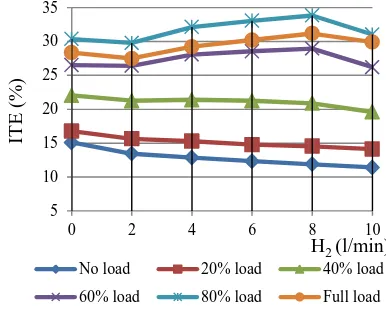
2)ITE in HDDF Modes:
The ITE of the engine in HDDF modes was higher compared to the diesel mode at all loads except at lower loads, i.e., up to 20% loads.
10 15 20 25 30 35
0.0 0.2 0.5 1.0 1.5 2.0
IT
E
(%)
[image:3.612.350.544.112.283.2]LPG (l/min)
Fig 5 Effect of LPG supplied rate on ITE
No load 20% Load 40% Load 60% Load 80% Load Full load
5 10 15 20 25 30 35
0 2 4 6 8 10
IT
E
(
%)
H2 (l/min)
Fig 6 Effect of hydrogen supplied rate on ITE at different loads
No load 20% load 40% load
[image:3.612.339.532.475.631.2]International Journal of Emerging Technology and Advanced Engineering
Website: www.ijetae.com (ISSN 2250-2459, ISO 9001:2008 Certified Journal, Volume 8, Issue 1, January 2018)
99
The ITE of the engine was highest in HDDF mode-IV for all load conditions except at lower loads. In HDDF modes, the values of ITE improved more in higher supply rates and higher loads except in full load condition.
The ITE of the engine in HDDF modes decreased as load was increased up to 40% of load for all supplied rates of hydrogen, then the value started increasing of up to 80% of load and at 100% load the value was reduced again.
3)Comparison of ITE indifferent fuelling modes:
The increase of the IP and reduction of the heat losses at higher loads led to increase in the efficiency of the engine. However, at full load, because of poor combustion of fuel due to non-availability of sufficient oxygen in the CC, the efficiency was dropped slightly.
The ITE was highest in HDDF mode-IV at higher loads, but at lower loads the ITE was higher in diesel mode. This was due to incomplete combustion of AGF and diesel because of lower temperature in the CC. However, as the supplied rate of AGF was increased up to a certain limit, the combustion rate of supplied fuel increased due to rise in temperature. But increase of supplied rate of AGF beyond the optimum limit could not improve the ITE of the engine due to insufficient air in the CC for lower density of AGF.
The highest values of ITE of the engine in diesel mode were found as 30.36% at 80% of load, but it decreased to 28.34% at full load conditions. However, in LDDF modes, the ITE improved to the highest values of 33.23% in LDDF mode-IV, and in HDDF modes, the highest value was 33.83% at 8 l/min supplied rate of hydrogen, both at 80% load, but the values reduced on further increase of load.
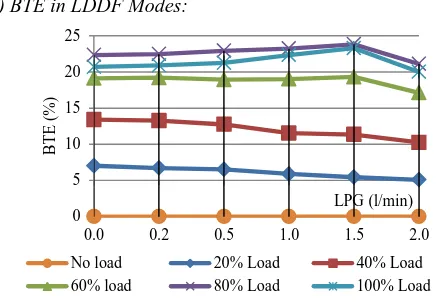
D.Brake Thermal Efficiency(BTE):
The BTE of the engine in all fuelling modes increased as load was increased up to about 60%-80% of load and at 100% load the value was reduced again. The highest values of BTE of the engine in diesel mode were found as 22.33% at 80% of load, but it decreased to 20.68% at full load conditions.
1)BTE in LDDF Modes:
The BTE of the engine in LDDF modes was higher compared to that in diesel mode at higher loads, but at lower loads the value of BTE was lower in LDDF modes.
The BTE of the engine at higher loads increased as the rate of LPG supplied was increased and reached the maximum value at LPG supply rate of 1.5 l/min at 80% load and then the value reduced at supplied rate of 2 l/min for all loads at 100% load condition [Fig 7].
2)BTE in HDDF Modes:
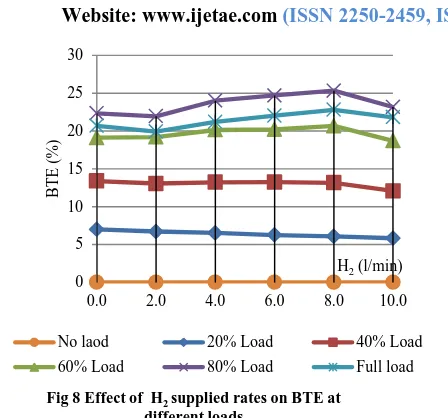
[image:4.612.330.551.139.290.2]The BTE of the engine in HDDF modes was higher compared to that of diesel mode at all loads except at lower loads, i.e., 20% loads. The maximum value of BTE was observed to be 25.3% at HDDF mode-IV and 80% load and it reduced at full load. The BTE of the engine decreased as compared to diesel mode as load was increased in 2 l/min & 4 l/min supplied rate of hydrogen, while there was increase of BTE at 6 l/min & 10 l/min supplied rate of hydrogen. The BTE in HDDF mode-IV were observed to be highest in all load conditions except 20% load condition [Fig 8].
0 5 10 15 20 25
0.0 0.2 0.5 1.0 1.5 2.0
B
T
E
(%)
LPG (l/min)
Fig 7 Effect of LPG supplied rates on BTE at different loads
No load 20% Load 40% Load
International Journal of Emerging Technology and Advanced Engineering
Website: www.ijetae.com (ISSN 2250-2459, ISO 9001:2008 Certified Journal, Volume 8, Issue 1, January 2018)
100
3)Comparison of BTE in different fuelling modes:
The BTE of the engine was the highest at HDDF mode-IV and 80% load and the value was 13% higher than the corresponding value in diesel mode. The lowest value was observed with HDDF mode-I because at this supplied rate hydrogen could not burn due to poor mixing with air. The BTE of the engine in LDDF mode-IV and at 80% load was 23.8%, i.e., an increase of about 6.7% compared to corresponding value in diesel mode. However, at lower loads the BTE of the engine in all LDDF modes and in all HDDF modes were lower than diesel mode due to poor combustion of the AGF at lower loads.
In HDDF modes, the values of ITE and BTE improved more in higher supply rates and higher loads except in full load condition.
So, it can be concluded that LPG substitution particularly at 1.5 l/min & 80% load in LDDF modes and hydrogen substitution at the rate of 8 l/min & 80% load in HDDF modes improved the ITE and BTE of the engine.
E. Mechanical Efficiency(ME):
The ME in all fuelling modes was observed to be increased at a sharp rate with the increase of loads up to about 60%-80% loads, but at higher loads the increase was lesser due to marginal increase of BP.
1)ME in LDDF modes:
The ME of the engine in LDDF modes at constant load was found to be decreased as the proportion of LPG was increased, because of reduction of the BP with the increase in the proportion of LPG. The ME of engine was least at the highest flow rate of LPG, i.e., 2 l/min & 100% load condition and it was found to be 71.36%.
2) ME in HDDF modes:
The highest value of ME of the engine in HDDF modes was observed in 8 l/min supplied rate of hydrogen at 80% of load and the value was found to be 74.89%. The ME of engine increased marginally as the hydrogen flow rate was increased (except during hydrogen flow rate of 2 l/min and 10 l/min).
3) Comparison of ME in different fuelling modes:
From the comparison of the ME in different fuelling modes, it was observed that the hydrogen substitution benefited the engine operation in terms of ME, but LPG substitution could not benefit the engine operation due to higher frictional losses.
0 5 10 15 20 25 30
0.0 2.0 4.0 6.0 8.0 10.0
B
T
E
(%)
[image:5.612.53.277.118.327.2]H2 (l/min)
Fig 8 Effect of H2 supplied rates on BTE at
different loads
No laod 20% Load 40% Load
60% Load 80% Load Full load
0 20 40 60 80
0.0 0.2 0.5 1.0 1.5 2.0
M
E
(%)
[image:5.612.348.555.125.308.2]LPG (l/min)
Fig 9 Effect of LPG supplied rate on ME at different loads
No load 20% Load 40% Load
60% Load 80% Load Full Load
0 10 20 30 40 50 60 70 80
0 2 4 6 8 10
ME
(%
)
H2 (l/min)
Fig 10 Effect of H2 supplied rate on ME at
differnt loads
No load 20% Load 40% Load
[image:5.612.346.552.435.609.2]International Journal of Emerging Technology and Advanced Engineering
Website: www.ijetae.com (ISSN 2250-2459, ISO 9001:2008 Certified Journal, Volume 8, Issue 1, January 2018)
101
Amongst all the fuelling modes, the highest ME was observed in HDDF mode-IV at 80% load, which was 1.8% higher than corresponding value in diesel mode, while the highest value of ME in diesel mode was found to be 73.5% at 80% load and in LDDF mode, it was 72.7% in 0.2 l/min supplied rate of LPG and 80% load.
F.Volumetric Efficiency(VE):
The VE of the engine in all fuelling modes decreased as load was increased due to reduction of speed of the engine.
1)VE in LDDF modes:
The VE of the engine reduced as the proportion of LPG in the LDDF modes was increased. The least value of VE was observed at the highest flow rate of LPG, i.e., 2 l/min & at 100% load condition and it was found to be 58.41%.
2)VE in HDDF modes:
The VE of the engine reduced as the proportion of hydrogen in HDDF modes was increased due to the reduction of air flow because of the supply of lower density AGF, hydrogen. The VE was the only parameter which reduced with the increase of hydrogen substitution in HDDF modes. The value of VE was the least at the highest flow rate of hydrogen, i.e., 10 l/min, at 100% load condition and the value was 46.7%.
3)Comparison of VE in different fuelling modes:
Amongst all the fuelling modes, it was observed that at constant load the highest VE was in diesel mode, i.e., 64.21% while in HDDF modes the value was the lowest. Again, the VE of the engine in constant load in both LDDF modes and HDDF modes was also found to be decreased with the increase in proportion of AGF, LPG or hydrogen. In LDDF modes and HDDF modes, the AGF, LPG or hydrogen occupied more space due to their lower density, leaving lesser space for air, so, the VE reduced as the substitution of AGF was increased.
G.Indicated Specific Fuel Consumption(IFSC):
The ISFC in all fuelling modes gradually reduced from maximum value at no load, attained the lowest value at around 60% to 80% load due to proper combustion of the properly mixed charge and then again increased at 100% load.
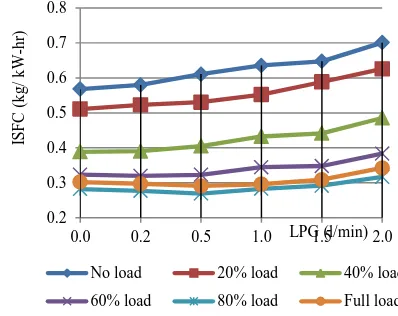
1)ISFC in LDDF modes:
The ISFC in LDDF modes at all load conditions increased as the proportion of LPG was increased. The range was 0.70 kg/ kW-h in LDDF mode-V at no load to 0.25 kg/ kW-h in LDDF mode-IV at 80% load.
55 57 59 61 63 65 67 69 71
0.0 0.2 0.5 1.0 1.5 2.0
V
E
(%)
[image:6.612.76.252.278.441.2]LPG (l/min)
Fig 11 Effect of LPG supplied rate on VE at different loads
No load 20% load 40 % load 60% load 80% load Full load
45 50 55 60 65 70 75
0 2 4 6 8 10
V
E
(%)
H2 (l/min)
Fig 12 Effect of H2 supplied rate on VE at different
loads
No load Load: 20% Load: 40%
Load: 60% Load: 80% Full load
0.2 0.3 0.4 0.5 0.6 0.7 0.8
0.0 0.2 0.5 1.0 1.5 2.0
IS
F
C
(
k
g
/
k
W
-h
r)
[image:6.612.341.540.472.630.2]LPG (l/min)
Fig 15 Effect of LPG supplied rate on ISFC at different loads
No load 20% load 40% load
[image:6.612.53.275.507.685.2]International Journal of Emerging Technology and Advanced Engineering
Website: www.ijetae.com (ISSN 2250-2459, ISO 9001:2008 Certified Journal, Volume 8, Issue 1, January 2018)
102
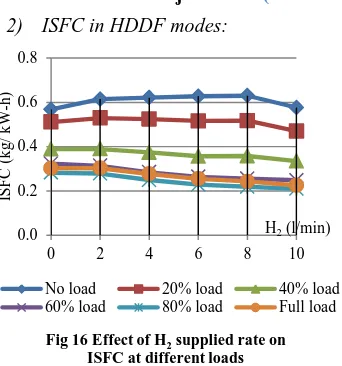
2) ISFC in HDDF modes:
The ISFC in all supplied rates of hydrogen in HDDF modes decreased from maximum value of 0.61 kg/ kW-h in HDDF mode-I at no load condition, attained the lowest value of 0.21 kg/kW-h at 80% load in HDDF mode-V and then again increased to 0.23 kg/ kW-h at 100% load in the same supplied rate of AGF.
3)Comparison of ISFC in different fuelling modes:
In both LDDF modes and HDDF modes in all supplied rates of AGF at lower loads, the ISFC were higher than the diesel mode because of incomplete combustion of both AGF & CLF, but as the load was increased, the ISFC both started decreasing except in full load. However, with the increase of supplied rate of AGF, in both LDDF modes and HDDF modes, at constant load the ISFC both started declining up to a minimum level beyond that the value was increased again.
H.Brake Specific Fuel Consumption(BSFC):
The BSFC in all fuelling modes followed the similar trend, i.e., it gradually reduced from maximum value at no load, attained the lowest value at around 60% to 80% load and then again increased at 100% load.
1)BSFC in LDDF modes:
It was observed that the BSFC in LDDF modes were more than in diesel mode in all supplied rates of LPG, though at lower loads and lower supplied rates of LPG, the BSFC was not affected too much, but at higher supplied rates of LPG, the BSFC were noticeably higher due to lower burning rate of LPG.
In all load conditions the BSFC increased with the increase in supplied rate of LPG. The BSFC was the lowest for 80% load conditions for all the supplied rates.
2)BSFC in HDDF modes:
The BSFC decreased with increase of hydrogen supplied rate in different load conditions that except in 20% load condition [Fig 14]. The BSFC were the lowest in all load conditions at the highest supplied rate of hydrogen, i.e., HDDF mode-V compared to the lower supplied rates of hydrogen.
3)Comparison of BSFC in different fuelling modes:
The lowest BSFC in diesel mode was observed to be 0.38 kg/kW-hr, while in LDDF modes it was in LPG supplied rate of 1.5 l/min, i.e., 0.35 kg/kW-hr and in HDDF mode it was 10 l/min supplied rate of hydrogen, i.e., 0.28 kg/kW-hr all in 80% load.
0.0 0.2 0.4 0.6 0.8
0 2 4 6 8 10
IS
F
C
(
k
g
/
k
W
-h)
[image:7.612.63.234.129.312.2]H2 (l/min)
Fig 16 Effect of H2 supplied rate on
ISFC at different loads
No load 20% load 40% load 60% load 80% load Full load
0.0 0.3 0.6 0.9 1.2 1.5 1.8
0.0 0.2 0.5 1.0 1.5 2.0
B
S
F
C
(
k
g
/
k
W
-h
r)
LPG (l/min)
Fig 13 Effect of LPG supplied rate on BSFC at different loads
No load 20% Load 40% Load
60% Load 80% Load Full load
0.2 0.4 0.6 0.8 1.0 1.2 1.4
0 2 4 6 8 10
B
S
F
C
(
k
g
/
k
W
-h
r)
[image:7.612.338.551.144.307.2]H2 (l/min)
Fig 14 Effect of supplied rate of H2 on BSFC at
different loads
Load: 20% Load: 40% Load: 60%
[image:7.612.335.556.436.621.2]International Journal of Emerging Technology and Advanced Engineering
Website: www.ijetae.com (ISSN 2250-2459, ISO 9001:2008 Certified Journal, Volume 8, Issue 1, January 2018)
103
However, a maximum of 12.7% drop of BSFC was observed in HDDF mode in 10 l/min supplied rate of hydrogen at full load condition compared to diesel mode and similarly, a maximum of 26.8% drop of BSFC was observed in HDDF mode in 10 l/min supplied rate of hydrogen at full load condition compared to diesel mode.
III. SUMMARY
Finally, it can be concluded from this study that the LDDF mode and HDDF mode yielded better results compared to diesel mode in terms energy efficiency, particularly at higher loads and optimal supplied rate of the AGF, LPG or hydrogen; while diesel mode was more suitable for low load conditions. In summary, the main conclusions drawn from the present study may be stated as follows:
The use of AGF such as LPG or hydrogen, supported by the modified AGF supply systems, in the CI engine in DF modes in combination with CLF, diesel, led to improvements in the working of the engine in terms of performance, energy efficiency, specific fuel consumption, etc. particularly at higher loads.
The best operating condition in LDDF modes was 1.5 l/min supplied rate of LPG & at around 60% to 80% load.
The best operating condition in HDDF modes was 8 l/min supplied rate of hydrogen & at around 80% load.
However, substitution of hydrogen yielded better results than substitution of LPG in combination with diesel in dual fuel modes of operation of CI engine except some factors like VE, EGT, etc.
Abbreviations
A availability
AGF alternative gaseous fuel
BP brake power, (kW)
BTE brake thermal efficiency, (%)
CC combustion chamber
CI compression ignition
CLF conventional liquid fuel
CNG compressed natural gas
df, DF dual fuel
HDDF hydrogen-diesel dual fuel
H2 hydrogen
IC internal combustion
IP indicated power,( kW)
ISFC indicated specific fuel consumption,
(kg/ kW-hr)
ITE indicated thermal efficiency
LDDF LPG-diesel dual fuel
LPG Liquefied petroleum gas
l/min liters per minute
ME mechanical efficiency
sfc specific fuel consumption,(kg/ kW-hr)
VE volumetric efficiency
REFERENCES
[1] Kumaraswamy & Dr. B. Durga Prasad, Use of LPG in A Dual Fuel Engine, International Journal of Modern Engineering Research (IJMER) www.ijmer.com Vol.2, Issue.6, Nov-Dec. 2012 pp-4629-4633 ISSN: 2249-6645
[2] B. Rajendra Prasath, E. Leelakrishnan, N. Lokesh, H. Suriyan, E. Guru Prakash, Hydrogen Operated Internal Combustion Engines – A New Generation Fuel, International Journal of Emerging Technology and Advanced Engineering Website: www.ijetae.com (ISSN 2250-2459, Volume 2, Issue 4, April 2012) 52
[3] Biplab K Debnath, Ujjal K Saha, Niranjan Sahoo: Effect of hydrogen-diesel quantity variation on brake thermal efficiency of a dual fuelled diesel engine; Journal of Power Technologies 92(1) (2012) 55-67
[4] Dr K Ashok Reddy: A Critical Review On Hydrogen-Diesel Fuel Mode Compression Ignition Engine, International Journal of Application or Innovation in Engineering & Management (IJAIEM) Web Site: www.ijaiem.org Volume 5, Issue 3, March 2016 ISSN 2319 - 4847
[5] G.A Rao, A.V.S. Raju, Rajulu K Govinda. and C.V. Mohan Rao: Performance evaluation of dual fuel engine (Diesel + LPG); Indian Journal of Science and Technology Vol. 3 No. 3 (Mar 2010) ISSN: 0974- 6846