International Journal of Emerging Technology and Advanced Engineering
Website: www.ijetae.com (ISSN 2250-2459, ISO 9001:2008 Certified Journal, Volume 8, Issue 6, June 2018)1
Seismic Performance Analysis of Offshore Wind Jacket
Substructure by Soil Modeling Method
Ho-sun Kim
1, Se-woong Yoon
2, Hwa-sup Jang
3, Yeon-min Kwak
4, Beom-il Kim
5, Yong-woo Cho
61,5Senior surveyor, Ship & Offshore Technology Center, Korean Register, Korea
2Senior surveyor, Future Technology Research Team, Korean Register, Korea
3
Senior surveyor, Digitalization Team, Korean Register, Korea
4Senior surveyor, Technology Planning Team, Korean Register, Korea
6Deputy manager, Structural Department, Yooshin, Korea
Abstract—Offshore wind turbines are accelerating the
development of excellent sizes with various advantages, such as greater economic efficiency and scalability than terrestrial wind turbines. The most representative example is the application of monopile and jacket foundation for offshore wind turbine support. However, the monopile substructure is limited due to the limitation of equipment.
Fixed, Lumped, and Winkler models are applied to the integrated load analysis of offshore wind turbines.
In this study, the behavior of the offshore wind turbine jacket supporting structure according to the soil modeling method is examined. The target sea area is the site of Southwest Sea model complex site which is promoted by the government of Korea. Interpretation is performed by analysis response spectrum and time history. The above three models were applied to the soil, and the top generator was applied to 5MW offshore wind turbine.
Keywords—Jacket substructure, Offshore wind turbine,
Response spectrum, Time history, Seismic analysis, Soil modeling
I. INTRODUCTION
Offshore wind turbines are accelerating the development of excellent sizes with various advantages, such as greater economic efficiency and scalability than terrestrial wind turbines. The most representative example is the application of monopile and jacket foundation for offshore wind turbine support. However, the monopile substructure is limited due to the limitation of equipment.
In the case of general structure, the pile design is conservatively approaching the design by applying the fixed boundary to the soil without considering the ductility of the foundation. However, in the case of offshore wind turbine jacket substructure where horizontal load is dominant, design through integrated analysis of soil-structure-external load condition is essential.
Fixed, Lumped, and Winkler models are applied to the integrated load analysis of offshore wind turbines.
Fixed model : apply soil as a rigid body
Lumped model : apply soil as a k-matrix
Winkler model : model a pile foundation and apply a
rigidity spring to each depth
In this study, the behavior of the offshore wind turbine jacket supporting structure according to the soil modeling method is examined. The target sea area is the site of Southwest Sea model complex site which is promoted by the government of Korea. Interpretation is performed by analysis response spectrum and time history. The above three models were applied to the soil(Fig 1, Table 1), and the top generator was applied to 5MW offshore wind turbine.
(A)FIXED MODEL (B)LUMPED MODEL (C)WINKLER MODEL
FIG 1.MODEL WITH SOIL RIGIDITY
TABLE1
PARAMETER OF SEISMIC ANALYSIS
Case Analysis method Soil application model
Case 1
Response spectrum
analysis
Winkler model
Case 2 Lumped model
Case 3 Fixed model
Case 4
Time history analysis
Winkler model
Case 5 Lumped model
International Journal of Emerging Technology and Advanced Engineering
Website: www.ijetae.com (ISSN 2250-2459, ISO 9001:2008 Certified Journal, Volume 8, Issue 6, June 2018)2
II. ANALYSIS AND LOAD CONDITION
A. Design Condition of Substructure
A.1 Marine Condition
The marine conditions (Table 2) for interpretation were based on actual site survey data(KEPRI, 2014), and the extreme conditions of 50 - year repetition frequency were applied.
TABLE2
MARINE CONDITION
Type Condition
Seabed [D.L] -11.700 m
HSWL [D.L] +4.399 m
MSL [D.L] +0.000 m
LSWL [D.L] -4.372 m
Hmax 11.10 m
T 11.16 sec
Surge 0.86 m
Current 1.066 m/s
Marine Growth 100 ㎜
A.2 Soil Condition
As shown in Table 3, the southwestern coast of Korea is characterized by the soft soil of about 60m. Because of the deep soft layer, the gravity type foundation is not applied. Therefore, the jacket support structure is generally applied.
TABLE3
SOIL CONDITION
Soil layer Depth(m) Soil type
Accumulation layer
0.0~6.2 Silty sand
6.2~11.5 Silty clay
11.5~13.0 Sand
13.0~26.4 Silty clay
26.4~46.0 Sand
Sedentary deposit 46.0~57.0 Sedentary deposit
Weathered rock 57.0~59.0 Weathered rock
Soft rock 59.0~64.0 Granite
B. Design Response Spectrum
The design response spectrum was selected by reference to Korea's "Common Application of Seismic Design Standards, 2017". The seismic performance targets are based on the I - grade earthquake with a 1,000 - year recurrence interval of the collapse prevention level. The seismic zone in Korea is divided into two zones. The site is divided into 1 zone and the seismic zone factor (Z) is 0.11g. The risk factor (I) is applied from 50 years to 4,800 years, and the goal of this structure is 1,000 years (I = 1.4).
In the case of the soil, it is classified into S1 ~ S6, and the soil is applied to the S5 soil with deep and soft soil as shown in Table 3. The site amplification factor is shown in Table 4 below.
TABLE4
SITE AMPLIFICATION FACTOR
Soil classification
Period amplification
factor, Fa
Interval amplification
factor, Fv
S ≤ 0.1
S = 0.2
S = 0.3
S ≤ 0.1
S = 0.2
S = 0.3
S5 1.8 1.3 1.3 3.0 2.7 2.4
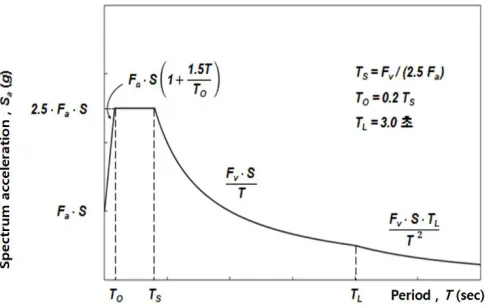
Based on the above results, the standard design response spectrum (Fig. 2) can be calculated as shown in Fig. 3 by applying the standard design response spectrum generation method of the seismic design criteria.
FIG 2.DRAWING METHOD OF STANDARD DESIGN RESPONSE
[image:2.612.317.568.324.413.2] [image:2.612.328.572.473.627.2]International Journal of Emerging Technology and Advanced Engineering
Website: www.ijetae.com (ISSN 2250-2459, ISO 9001:2008 Certified Journal, Volume 8, Issue 6, June 2018) [image:3.612.93.519.152.666.2]3
Fig 3. Design Response Spectrum of Analysis Structure
International Journal of Emerging Technology and Advanced Engineering
Website: www.ijetae.com (ISSN 2250-2459, ISO 9001:2008 Certified Journal, Volume 8, Issue 6, June 2018)4
C. Time History Analysis
There are various methods for obtaining input earthquake motion for time history analysis. Typically, there are methods to obtain through deaggregation of earthquake disaster, the method to uniform hazard spectrum(UHRS), the method to obtain through ground numerical analysis, and the method using custom artificial earthquake.
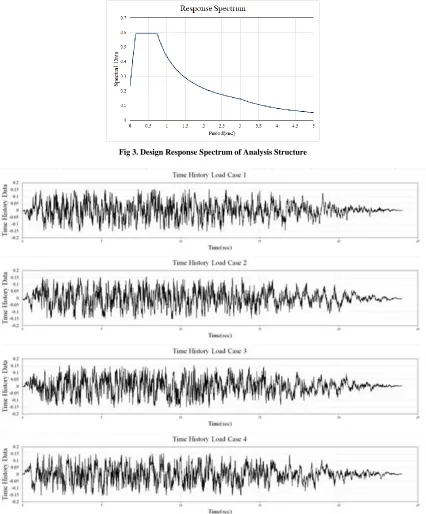
At least four artificial seismic waves are to be applied in Korean highway bridge design standards. In this study, four artificial seismic waves proposed by Korea Expressway Corporation were applied (Fig. 4).
III. SOIL RIGIDITY CALCULATION AND STRUCTURE
ANALYSIS
A. Winkler Model
The Winkler model is a method of applying the soil spring stiffness to each depth of the pile. In order to apply the linear spring stiffness to the pile model, the coefficient of subgrade reaction according to the depth of each pile was calculated and applied.
A.1 Coefficient of Vertical Subgrade Reaction
The coefficient of vertical subgrade reaction can be obtained as shown in Equation (1) below.
( ) (1)
A.2 Coefficient of Horizontal Subgrade Reaction
The coefficient of horizontal subgrade reaction can be obtained as shown in Equation (2) below.
( ) (2)
B. Lumped Model
The Lumped model has a total of six degrees of freedom to define three directions of motion and rotation in three dimensions. The displacement and load relations for these elements can be defined through the matrix, which is called the stiffness matrix(K-matrix) of the foundation. Where, K11 and K22 are the horizontal stiffness, K44 and K55 are the rotational stiffness, and K33 and K66 are the vertical and torsional stiffness, respectively. Also, K15, K24, K51, and K42 show the stiffness for the phenomenon that horizontal load and moment are coupled(Choi et al. 2014).
FIG 5.K-MATRIX OF LUMPED MODEL
C. Model of Structure Analysis
C.1 Specification of Substructure
The support structure to be analyzed is a jacketed support structure capable of loading a 5 MW generator, and was applied as an upright jacket for the convenience of installation and construction(Fig 6).
FIG 6.SPECIFICATION OF SUBSTRUCTURE
C.2 Modeling of Substructure
The upper generator was applied as nodal mass, and the beam model was modeled from the top of the tower to the bottom of the jacket or pile foundation(Fig 7).
EL.(+) 21.696 M
HSWL EL.(+) 4.399 M
M.S.L EL. 0.000 M
LSWL EL.(-) 4.372 M EL.(+) 17.296 M
1 83 0 10000 2 0 7 0 2 40 0 2 4 0 0 9 3 5 0 9 3 5 0 24 0 0 5 0 9 6 3 4 8 9 6
ELEVATION ROW 1 & 2
SCALE 1 : 100 ¥ Õ660x15 ¥ Õ660x15
100 ¥ Õ1 2 1 8 x 1 8 B A 5460
EL.(+) 16.600 M
¥ Õ660x
20
EL.(-) 11.370 M
¥Õ660 x20 ¥ Õ1 2 5 4 x3 6
ELEVATION ROW A & B
SCALE 1 : 100 MUDLINE EL.(-) 11.700 M
EL.(+) 2.450 M
WORKING PLATFORM TRANSITION PIECE 100 2 1 5460 1 83 0 2 0 7 0 2 40 0 2 4 0 0 9 3 5 0 9 3 5 0 24 0 0 5 0 9 6 3 4 8 9 6
B A 1 2
¥ Õ1 2 1 8 x 1 8 ¥ Õ1 21 8 x 1 8 ¥ Õ1 21 8 x 1 8 ¥ Õ1 2 5 4 x 3 6 ¥ Õ1 2 5 4 x 36 ¥ Õ1 2 5 4 x3 6 ¥ Õ12 5 4 x 3 6 ¥ Õ1 2 5 4x 3 6 10000 ¥ Õ660x15 ¥ Õ660x15
100 ¥ Õ1 2 1 8 x 1 8
¥Õ660x 20 ¥ Õ66
0x20
International Journal of Emerging Technology and Advanced Engineering
Website: www.ijetae.com (ISSN 2250-2459, ISO 9001:2008 Certified Journal, Volume 8, Issue 6, June 2018)5
(A) WINKLER MODEL
(B) LUMPED AND FIXED MODEL
FIG 7.ANALYSIS MODEL OF SUBSTURCUTRE
D. Load Combination
In order to perform seismic analysis, a load combination is required. In Korea 's "Harbor and Fishing Port Design Standards", a load combination is proposed for each response spectrum and time history. In this study, the following load combinations were applied and the most conservative results were obtained(Table 5).
TABLE5
COMBINATION OF LOAD FACTOR
Type Dead
load
Front direction earth quake
load
Side direction earth quake
load
Axis direction earth quake
load
Com1 1.0 1.0 0.3 0.3
Com2 1.0 0.3 1.0 0.3
Com3 1.0 0.3 0.3 1.0
IV. ANALYSIS RESULT
A. Results of Natural Frequency Analysis
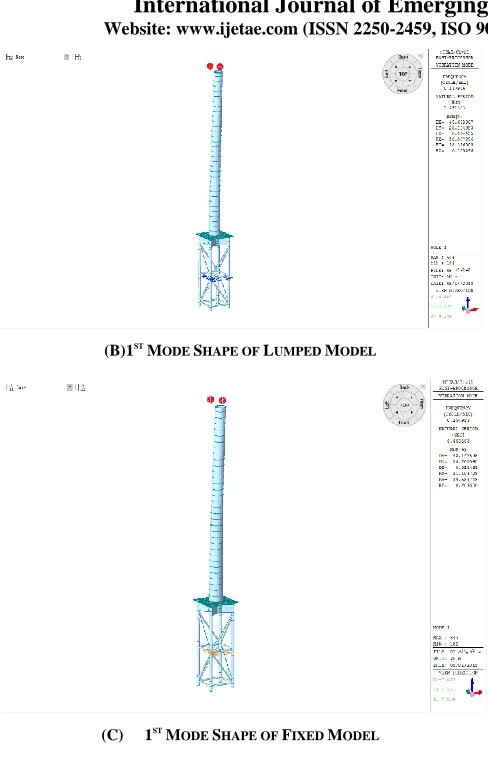
Before the seismic analysis, natural frequency analysis was performed to investigate the dynamic behavior of the structure. As a result, the mode shape of the jacket supporting structure in all models was 5th. The Winkler model which modeled the pile foundation showed the lowest frequency(Fig 8, Table 6).
(A) 1ST
International Journal of Emerging Technology and Advanced Engineering
Website: www.ijetae.com (ISSN 2250-2459, ISO 9001:2008 Certified Journal, Volume 8, Issue 6, June 2018)6
(B)1ST
MODE SHAPE OF LUMPED MODEL
(C) 1ST
MODE SHAPE OF FIXED MODEL
FIG 8.MODE SHAPE OF NATURAL FREQUENCY
TABLE6
RESULT OF NATURAL FREQUENCY
Mode number
Winkler model
Lumped
model Fixed model
1st 0.108845 0.137906 0.154953
2nd 0.109196 0.138162 0.155409
3rd 0.974686 1.160334 1.496674
4th 0.999463 1.200798 1.595262
5th 1.782610 1.609794 1.877825
B. Analysis Results of Standard Response Spectrum
Fig. 9 ~ Fig. 12 show the results of the standard response spectrum analysis. As a result of the standard response spectrum analysis, it was confirmed that the stress was the highest in the jacket braces. The shear force showed the highest value in the jacket leg, and the bending moment showed the highest value in the TP part meeting with the tower.
As a result of analysis on each soil model, it was confirmed that Winkler model showed the lowest response value in most analysis results except jacket displacement and jacket bottom maximum moment. Fixed model showed the highest response value. The lower bending moment of the jacket showed the lowest response value in the lumped model.
C. Analysis Results of Time History
Fig. 13 ~ Fig. 16 show the results of the time history analysis. The results of the time history analysis showed that the two models except for the Winkler model showed the highest stress values in the jacket braces. The Winkler model had the highest stress at the bottom of the legs. The shear force showed the highest value in the jacket leg, and the bending moment showed the highest value in the TP part meeting with the tower.
[image:6.612.48.292.110.489.2]International Journal of Emerging Technology and Advanced Engineering
Website: www.ijetae.com (ISSN 2250-2459, ISO 9001:2008 Certified Journal, Volume 8, Issue 6, June 2018)7
(A) STRESS CONTOUR (B)SHEAR FORCE CONTOUR(FX) (C) BENDING MOMENT CONTOUR(MY)
FIG 9.RESPONSE SPECTRUM ANALYSIS RESULT OF WINKLER MODEL
(A) STRESS CONTOUR (B)SHEAR FORCE CONTOUR(FX) (C) BENDING MOMENT CONTOUR(MY)
FIG 10.RESPONSE SPECTRUM ANALYSIS RESULT OF LUMPED MODEL
(A) STRESS CONTOUR (B)SHEAR FORCE CONTOUR(FX) (C) BENDING MOMENT CONTOUR(MY)
International Journal of Emerging Technology and Advanced Engineering
Website: www.ijetae.com (ISSN 2250-2459, ISO 9001:2008 Certified Journal, Volume 8, Issue 6, June 2018)8
(A) MAXIMUM DISPLACEMENT (B) MAXIMUM
DISPLACEMENT(JACKET)
(C) MAXIMUM STRESS
(D) MAXIMUM SHEAR FORCE (E)MAXIMUM BENDING MOMENT (F)BENDING MOMENT(JACKET BOTTOM)
FIG 12.COMPARISON OF RESPONSE SPECTRUM ANALYSIS RESULTS
(D) STRESS CONTOUR (E)SHEAR FORCE CONTOUR(FX) (F)BENDING MOMENT CONTOUR(MY)
FIG 13.TIME HISTORY ANALYSIS RESULT OF WINKLER MODEL
(D) STRESS CONTOUR (E)SHEAR FORCE CONTOUR(FX) (F)BENDING MOMENT CONTOUR(MY)
International Journal of Emerging Technology and Advanced Engineering
Website: www.ijetae.com (ISSN 2250-2459, ISO 9001:2008 Certified Journal, Volume 8, Issue 6, June 2018)9
(D) STRESS CONTOUR (E)SHEAR FORCE CONTOUR(FX) (F)BENDING MOMENT CONTOUR(MY)
FIG 15.TIME HISTORY ANALYSIS RESULT OF FIXED MODEL
(A) MAXIMUM DISPLACEMENT (B)MAXIMUM DISPLACEMENT(JACKET) (C) MAXIMUM STRESS
(D) MAXIMUM SHEAR FORCE (E)MAXIMUM BENDING MOMENT (F)BENDING MOMENT(JACKET BOTTOM)
International Journal of Emerging Technology and Advanced Engineering
Website: www.ijetae.com (ISSN 2250-2459, ISO 9001:2008 Certified Journal, Volume 8, Issue 6, June 2018)10
V. CONCLUSION
In this study, time history analysis and response spectrum analysis were carried out for the offshore wind turbine jacket supporting structure according to three types of ground application method model, and comparison / examination was performed. The results are summarized as follows.
When the time history analysis was performed using the Winkler model, the most conservative results were obtained from the response values. This is because it is confirmed that the influence of the pile model on the input earthquake motion is high.
In the Fixed model, which is generally regarded as a conservative interpretation, there is no conservative response in time history analysis. However, in the case of the standard response spectrum, it was confirmed that the most conservative response value is generated.
In general, the standard response spectrum is applied to the Winkler model for seismic design of offshore wind turbine support structures. However, it was confirmed that the response value was relatively low. For a conservative review, a review with a standard response spectrum applied to the Fixed model would be required. Or, it is considered necessary to examine the analysis by applying the input earthquake motion to the Winkler model.
Acknowledgments
This work was supported by the Korea Institute of Energy Technology Evaluation and Planning(KETEP) and the Ministry of Trade, Industry & Energy(MOTIE) of the Republic of Korea (No. 20163030024520).
REFERENCES
[1] Choi, C., Han, J., Cho, S., and Jang, Y. (2013), The effect of flexibility for the offshore wind turbine systems, Journal of the Korea-Environmental Society, Vol.14, No. 4, pp. 59~66.
[2] Choi, C., Kim, U., Cho, S., Kwon, H., and Kwon, O. (2014) Evaluation of lumped stiffness matrix for integrated load calculation of offshore wind turbine, 2014 Koreas Geo-Environmental Society Conference, Korea, pp. 164-167.
[3] Jack W. Baker and C. Allin Cornell (2006) Spectral shape, spsilon and record selection, Earthquake Engineering and Structural Dynamics, pp. 1077-1095
[4] Jang, H.S., Kwak, Y.M., Kim, H.S. and Yoon, S.W. (2017) Seismic Analysis of Subsea Cable in Longitudinal Direction, IJETAE, Vol.7, pp. 285-292
[5] Jeong, K.H., Lee, H.S., Hwang, K.R., (2017) Estimation of Earthquake Magnitude-Distance Combination Corresponding to Design Spectrum in Korean Building Code 2016, Journal of the Earthquake Engineering Society of Korea, Vol.21, No.1, pp. 31-39 [6] KEPRI(2014), "Test bed of 2.5GW offshore wind farm at yellow
sea" Interim design basis report
[7] Kim, H.K. and Park, D.H., (2010) Generation of Synthetic Ground Motion in Time Domain, LHI journal of land, housing, and urban affairs, Vol.1, No.1, pp. 51-57
[8] Kim, H.S., Jang, H.S., Yoon, S.W., Park, J.C. and Kwak, Y.M. (2017) Evaluation on Seismic Performance of Integrate Jacket Substructure for 5MW Offshore Wind Turbine, pp.284
[9] Ministry of Land, Infrastructure and Transport (2008) highway bridge design standard
[10] Ministry of Oceans and Fisheries(2014) Harbor and Fishing Port Design Standards
[11] Ministry of the Interior and Safety(2017) Common Application of Seismic Design Standards, 2017