Dielectric Behaviour of Polyurethane Coatings Derived from Palm Oil Oleic Acid Based Polyols A Renewable Resource
7
0
0
Full text
(2) DIELECTRIC BEHAVIOUR OF POLYURETHANE COATINGS DERIVED FROM PALM OIL OLEIC ACID-BASED POLYOLS – A RENEWABLE RESOURCE. oil-based oleic acid polyols. In a previous article, we have discussed the synthesis as well as the mechanical and physico-mechanical properties of the novel polyurethane (Velayutham et al., 2009a, b). This article will concentrate on the complementary dielectric properties of the material. Oleic acid content in the polyols and NCO/OH ratio of PUR are the two variables described here. The main aim of this article was to reveal the dielectric response of PUR by varying these variables and to study the variables contribution to the molecular motion of the polymer. Thus, the findings will enable us to have an in-depth knowledge of the molecular structure, polarisation and dipole motions of the novel PUR.. As for the synthesis of PUR, the polyol and additives were dried under reduced pressure at 80°C for 2 hr before being poured into a three-neck flat-bottomed flask equipped with a thermometer, dropping funnel and magnetic stirrer. The polyol was allowed to react with a calculated amount of TDI in the presence of the solvent toluene, surfactant and defoamer. TDI was added dropwise into the reaction mixture at 80°C over 3 hr with constant stirring. The partially reacted sample formed a viscous solution, which was then poured into a 12 cm × 12 cm mould to cure under ambient temperature overnight to form a film of 0.5-1.0 mm thickness. This film was then left in the oven at 60°C for two days to drive off all the solvent. The NCO/ OH ratios of the samples were varied to 1.2, 1.4 and 1.6. For the measurement of dielectric properties, circular discs of diameter 38 mm and thickness of about 0.5-1.0 mm were used.. MATERIALS AND METHODS Materials. Measurement of Dielectric Properties Oleic acid (99.5% purity) and glycerol (99.5% purity) were obtained from Cognis Oleochemical (M) Sdn Bhd (Malaysia). Phthalic anhydride, PA (P T Petrowidada, Indonesia) and toluene diisocyanate (TDI) from Aldrich, USA (80:20; 2,4toluene diisocyanate: 2,6-toluene diisocyanate), a mixture of the two isomers, were used as received. Toluene (JT Baker, USA) was used as a solvent; it was dried over an activated molecular sieve overnight before use. The silicone surfactant used was L6900 (Air Products, USA) and the defoamer BYK-088 was from BYK Chemie, Germany.. Dielectric measurements were carried out according to ASTM D150 on PUR in order to determine their real ( ε ʹ) and imaginary ( ε ʺ) permittivity as a function of frequency. These measurements were conducted over the frequency range 100 Hz to 40 MHz, using a Hewlett Packard 4194A impedance/gain-phase analyser equipped with a HP 16451B dielectric material test fixture. A micrometer electrode was used and this electrode system eliminated any error caused by series inductance, resistance of the connecting leads and of the measuring capacitor at high frequencies.. Synthesis of Polyester Polyol and Polyurethane The synthesis of polyols from oleic acid and PUR has been described in detail in literature (Velayutham et al., 2009a, b). The formulations of polyols were based on the method described by Patton (1962). Pre-weighed PA, glycerol and oleic acid were charged into a 2-litre four-neck roundbottomed reactor flask, stirred and heated to a temperature of 120°C-130°C, while a slow stream of nitrogen gas was bubbled through the mixture for 30 min. The temperature was then increased to 180°C200°C so that the reaction could proceed readily with the evolution of water, which was collected at the decanter arm. The reaction was considered complete after the amount of water of reaction collected was as predicted in the formulation. Three different formulations of polyols were synthesised by varying the amount of oleic acid to 28%, 40% and 65%. The samples were named Alk28, Alk40 and Alk65, respectively, in accordance to the percentage of oleic acid in each sample. The composition and characteristics of the polyols have been summarised in Tables 1 and 2 in Velayutham et al. (2009a).. RESULTS AND DISCUSSION Impedance Analysis The structure of the main chain of PUR consists of a urethane backbone, with oleic acid as a flexible side chain. As the oleic acid content increased, so did the percentage of flexible side chain. The NCO/ OH ratio of PUR varied from 1.2 to 1.6. Hence, more three-dimensional allophanate and isocyanurates crosslinks (Hepburn, 1982) would have been formed in the system for the highest ratio. The increase in chemical crosslinking leads to a change in morphology and an increase in intermolecular attraction between hard segments (Spathis et al., 1994). The variations in real (εʹ) and imaginary (εʺ) permittivity as a function of frequency for all the samples (except PU with Alk65; NCO/OH ratio 1.2) at room temperature are shown in Figure 1. The reason for exception of the sample was due to adversity in preparing it; the samples were too soft to form films. 1261.
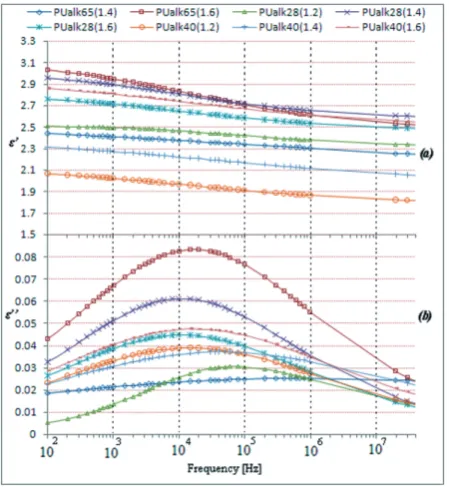
(3) Journal of Oil Palm Research 24 (April 2012). be observed dielectrically. The existence of CH2 and C-O groups in PUR can be confirmed from the FTIR spectrum as shown by Hamid and Mohammad (2004). In the spectra, the characteristic carbonyl stretching was observed at 1734-1745 cm -1, and the band observed at 2930-2940 cm-1 was due to -CH-stretching. The main factor in determining the transition is the hydrogen-bond chain structure and not the structure of the main polymer chain (Hedvig, 1977; Pissis et al., 2002). Figure 2 shows the effect of oleic acid content of the polyols on the dielectric permittivity of PUR. For a NCO/OH ratio of 1.6, PUalk65 had the highest real permittivity εʹ and imaginary permittivity εʺ spectra, followed by PUalk40 and PUalk28. It is presumed that the protons originating from the oleic acid content of the polyols dominated the dielectric relaxation mechanism of PURs. The experimental dielectric spectrum was fitted by the Havriliak-Negami (HN) expression as shown below:. Figure 1. Variation of (a) real permittivity (ε’) and (b) imaginary permittivity (ε”) for PUalk28, PUalk40 and PUalk65 with frequency measured at room temperature and NCO/OH ratios of 1.2, 1.4 and 1.6.. (εs – ε∞) cos (bj) b (1a) [1 + 2(wt)1–a sin (ap) + (wt)2(1–a)] 2 2 sin (bj) εʺ(ω) =(εs – ε∞) + b [1 + 2(wt)1–a sin ap + (wt)2(1–a)] 2 2 (1b) where (wt)1–a cos ap 2 j = arctg 1 + (wt)1–a + sin ap 2. εʹ(ω) = ε∞ +. From Figure 1a, it can be seen that the value of εʹ increased as the NCO/OH ratio increased at any given oleic acid percentage in the polyols of PUR. A corresponding change in the behaviour of εʺ could be observed where distinct loss peaks at the frequency range of 10 to 20 kHz were obtained for all the samples at room temperature. A γ-relaxation was usually observed at a frequency of 10 kHz, and was proposed as the probable mechanism for the dielectric behaviour of PUR in this research. A γ-relaxation mechanism is attributed to the local motion of the chain segments located between the hydrogen bonds (ILLERS, 1960; Hedvig, 1977). These chain segments consisted mainly of polar -CH2 and -C-O groups where the transition could. The ε ∞ and ε s are high frequency limits of the permittivity and the vacuum permittivity, respectively. The curve fitting was performed using the software OriginPro 8.1. HN relaxation is an empirical modification of the Debye relaxation model, accounting for the asymmetry and broadness of the dielectric dispersion curve. The model was first used to. Figure 2. Variation of real permittivity (ε’) and imaginary permittivity (ε”) for PUalk28, PUalk40 and PUalk65 with frequency measured at room temperature and NCO/OH ratio of 1.6.. 1262.
(4) DIELECTRIC BEHAVIOUR OF POLYURETHANE COATINGS DERIVED FROM PALM OIL OLEIC ACID-BASED POLYOLS – A RENEWABLE RESOURCE. describe the dielectric relaxation of some polymers (Havriliak and Negami, 1967). The principal use of this function has been for polymers, and it can fit results for many amorphous polymers over a considerable range of frequencies (Cole, 1980). This strategy of analysis has been used for many PUR systems (Pissis et al., 1996; 2002; Georgoussis et al., 2000; Korzhenko et al., 2000). The exponents α and β are the shape parameters that describe the asymmetry and broadness of the corresponding shape of the plots, while τ is the HN relaxation time. The HN fit for the relaxation phenomenon measured at room temperature is illustrated in Figure 3. Parameters such as ε∞, εs, Dε = (εs – ε∞) and τ were obtained from the experimental HN plots. The shape parameters such as α and b were derived from the HN relaxation model. These parameters are tabulated in Table 1. Figure 3 shows that, except for PUalk28 (at NCO/OH ratios of 1.4 and 1.6), the HN plot of PUR shifted to the right of the graph as the NCO/OH ratio increased. The dielectric. strength (∆ε ± 0.02) increased as the NCO/OH ratio increased for both PUalk40 and PUalk65. However, for PUalk28, the dielectric strength increased when the ratio increased from 1.2 to 1.4, and then decreased as the ratio was increased further to 1.6. The relaxation time could be related to the flexibility of the particular PUR sample. In the case of the orientation of molecular segments or segmental groups, the presence of crosslinks should increase the relaxation time overall because mobility is reduced (Gowri Krishna et al., 1982). This shows clearly that the dielectric loss observed was due to the orientational polarisation. The internal degrees of freedom of the molecules which led to smaller inter-molecular interactions can be related to the parameter α . Increased α values indicate a decrease in the internal degrees of freedom or less molecular interaction in the dielectric. From Table 1, the α value for PUalk28 increased as the NCO/OH ratio increased. Theoretically, as the NCO/OH ratio increases, the crosslinking of the materials increases as well, and,. Figure 3. Assymetrical Havriliak-Negami plots of the dispersion curves for (i) PUalk28, (ii) PUalk40, (iii) PUalk65 and (iv) PUR with NCO/OH ratio of 1.6 measured at room temperature. Dots are experimental points and continuous lines correspond to simulated fit.. TABLE 1. STATIC PERMITTIVITY εs, INDUCED PERMITTIVITY ε∞, DIELECTRIC STRENGTH Dε, α AND β PARAMETERS AT ROOM TEMPERATURE DERIVED FROM HN PLOTS Parameters. PUalk28 1.2. 1.4. PUalk40 1.6. 1.2. 1.4. PUalk65 1.6. 1.4. 1.6. α ± 0.01. 0.50. 0.65. 0.68. 0.70. 0.75. 0.71. 0.86. 0.67. β ± 0.001. 0.390. 0.890. 0.900. 0.860. 0.710. 0.860. 0.550. 0.901. ε∞ ± 0.01. 2.29. 2.57. 2.46. 1.78. 1.96. 2.50. 2.00. 2.47. εs ± 0.01. 2.51. 3.02. 2.82. 2.12. 2.38. 2.93. 2.55. 3.12. Dε ± 0.02. 0.22. 0.45. 0.36. 0.34. 0.42. 0.43. 0.55. 0.65. τ (s) × 10-5 (± 0.01 × 10⁻⁵ ). 1.30. 1.98. 1.98. 1.77. 1.45. 1.45. 1.77. 1.27. 1263.
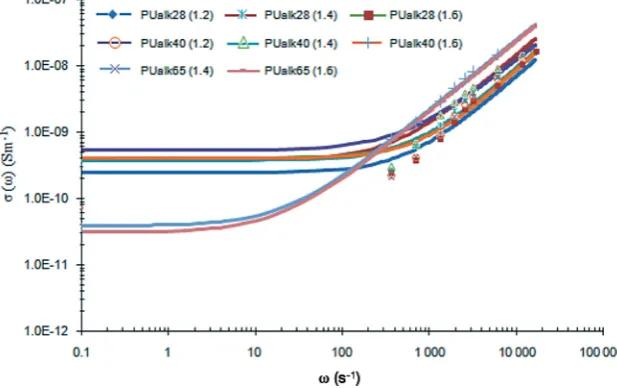
(5) Journal of Oil Palm Research 24 (April 2012). hence, it can be assumed that the internal degrees of freedom of the molecules decrease. Therefore the α parameter should increase as the ratio of the formulation increases, which was certainly true for the case of PUalk28. However, PUalk40 and PUalk65 contradicted this stated assumption due to the higher oleic acid content in the polyol which presumably produced a higher amount of flexible side chains, and thus made the polymer less compact. The frequency dependence of the total AC conductivity is depicted in Figure 4. The conductivity was found to be frequency-independent in the low frequency region, and DC conductivity, σ(0), had been extracted from the region. Each curve shows the frequency behaviour described through Jonscher’s universal power feature (Jonscher, 1977), which is. σ (w) = σ (0) + Awn. TABLE 2. EXPERIMENTAL AND FITTED RESULTS OF DC CONDUCTIVITY AT ROOM TEMPERATURE DERIVED FROM POWER LAW PLOTS NCO/OH ratio. Experimental Fitted σdc × 10-11 σdc × 10-11 (± 0.1 Sm-1) (± 0.02 Sm-1). Pualk28. 1.2 1.4 1.6. 31.6 36.6 37.8. 33.90 35.30 36.80. PUalk40. 1.2 1.4 1.6. 3.6 3.3 3.9. 3.31 2.94 3.32. PUalk65. 1.4 1.6. 4.0 7.4. 3.85 7.15. dependent region is a signal of the onset of conductivity relaxation (Anantha and Hariharan, 2005). The plot exhibits the typical behaviour of ionic materials, i.e. having a DC plateau and a frequency-dependent region (Murugaraj et al., 2003). The observed behaviour is in general agreement with the prediction of the jump relaxation model (Funke, 1997; Kulkarni et al., 1998; Kanapitsas et al., 1999; Dyre and Schrøder, 2002). According to this model, at low frequencies an ion jumps successfully from one site to its neighbouring vacant site, thus contributing to DC conductivity.. (2). where σ (0) is the DC conductivity of the material, A is the dispersion parameter, and 0 < n < 1 is the dimensionless frequency exponent. Equation 2 has been used to fit the AC conductivity data where A and n values were varied simultaneously to get the best fit. The fitted curves are shown in Figure 4. It was found that the fit was (visually) satisfactory in all cases. Extrapolation of the fitted results to zero frequency gave DC conductivity, σdc, the values of which are tabulated in Table 2. The DC conductivity values were measured experimentally by using a Keithley Source Measurement Unit (SMU 236) at room temperature. The validity of the σdc, values which were obtained experimentally was high as the values were in good agreement with the fitted σdc. The switchover from the frequency-independent region to frequency-. CONCLUSION The ac conductivity and dielectric behaviour of PUR were studied as a function of frequency at room temperature. The dielectric parameters were in the range of 2.0 to 3.0 for real permittivity εʹ and 0.02 to 0.08 for imaginary permittivity, ε ʺ. In general, most PUR had εʹ values in the range. Figure 4. Frequency-dependent conductivity, s (ac) vs. frequency for PUR at room temperature. Dots are experimental points and continuous lines correspond to simulated fit.. 1264.
(6) DIELECTRIC BEHAVIOUR OF POLYURETHANE COATINGS DERIVED FROM PALM OIL OLEIC ACID-BASED POLYOLS – A RENEWABLE RESOURCE. of 1.5 to 7.0 and εʺ in the range of 0.001 to 1.0 (Kanapitsas et al., 1999; Korzhenko et al., 1999; 2000; Chwang et al., 2004) which indicates that the dielectric values obtained for the oleic acid-based PUR were comparable to those mentioned above. Cole-Cole plots were fitted successfully using the Havriliak-Negami model. The γ -relaxation was proposed as the probable mechanism for the dielectric behaviour of PUR. The dielectric constant and loss mechanism of the material were found to be dependent on the frequency variation, NCO/ OH ratio and polyol used in synthesising PUR. The frequency-dependent conductivity of PUR materials was analysed using a Jonscher’s power law expression to compare the validity of the σdc, values which were obtained experimentally. The frequency-dependent permittivity showed dielectric dispersion, and the variation of the dielectric constant with frequency was ascribed to the contribution of the charge carriers.. COLE, R H (1980). Molecular correlation function approaches to dielectric relaxation. Invited paper presented at Physics of Dielectric Solids, Canterbury. Institute of Physics Conference Series No. 58. Dutta, N; Karak, N and Dolui, S K (2004). Synthesis and characterization of polyester resins based Nahar seed oil. Progress in Organic Coatings, 49: 146-148. Dyre, J C and Schrøder, TH B (2002). Hopping models and ac universality. Phys. Stat. Sol., B., 230: 5-13. Frubing, P; Kruger, H; Goering, H and Gerhard-Multhaupt, R (2002). Relaxation behaviour of thermoplastic polyurethanes with covalently attached nitroaniline dipoles. Polymer, 43: 2787-2794. Funke, K (1997). Ion transport in fast ion conductors-spectra and models. Solid State Ionics, 94: 27-33.. ACKNOWLEDGEMENT The authors gratefully acknowledge the postdoctorate fellowship and the research grant (Vot F F0161/2004) from the University of Malaya.. Georgoussis, G; Kyritis, A; Bershtein, V A; Fainleib, A M and Pissis P (2000). Dielectric studies of chain dynamics in homogeneous semiinterpenetrating polymer networks. J. Polymeric Science B, 38: 3070-3087.. REFERENCES. G o w ri K rishna , J ; J osyulu , O S ; Sobhanadri, J and Subramanim, R (1982). Dielectric behaviour of isocyanate-terminated polymers. J. Phys. D: Appl. Phys., 6: 2315-2324.. Anantha, P S and Hariharan, K (2005). Ac conductivity analysis and dielectric relaxation behaviour of NaNO3-Al2O3 composites. Materials Science and Engineering, B 121: 12-19. Andrew, G; Dima, D; Wei Zhang and Zoran, S P (2002). Polyols and polyurethanes from hydroformylation of soybean oil. J. Polymers and the Environment, 10 (112): 49-51.. Hamid, Y and Mohammad, R M (2004). Synthesis and properties of isocyanate curable millable polyurethane elastomers based on castor oil as a renewable resource polyol. European Polymer Journal, 40(6): 1233-1235.. ANNUAL BOOK OF ASTM STANDARDS (1994). D150, Standard Test Method for AC Loss Characteristics and Permittivity of Solid Electrical Insulation. Vol. 10. p. 31-48.. Havriliak, S and Negami, S (1967). A complex plane representation of dielectric and mechanical relaxation processes in some polymers. Polymer, 8(4): 161-210.. Bhunia, H P; Nando, G B; Chaki, K; Basak, A; Lenka, S and Nayak, P L (1999). Synthesis and characterization of polymers from cashewnut shell liquid (CNSL), a renewable resource II. Synthesis of polyurethanes. European Polymer Journal, 38: 13811385.. Hedvig, P (1977). Dielectric Spectroscopy of Polymers. Adam Hilger Ltd., Bristol. p. 293-296. Hepburn, C (1982). Polyurethane Elastomer. Applied Science Publishers, London. p. 4-6. ILLERS, V K H (1960). The influence of water on the molecular beweglichkeiten of polyamiden. Macromolecular Chemistry, 38: 168-188.. Chwang, C P; Liu, C D; Huang, S W and Chao, D Y (2004). Synthesis and characterization of high dielectric constant polyaniline/polyurethane blends. Synthetic Metal, 142: 275-281.. Jonscher, A K (1977). Free-carrier Poole-Frenkel effect in crystalline solids. Nature, 267: 673-679.. 1265.
(7) Journal of Oil Palm Research 24 (April 2012). Kanapitsas, A; Pissis, P and Garcia Estrella, A (1999). Molecular mobility in polyurethane/ styrene – acrylonitrile blends studied by dielectric techniques. European Polymer Journal 35: 923-937.. PSARRAS, G C; SOTO BEOBIDE, A; VOYIATZIS, G A; KARAHALIOU, P K; GEORGA, S N; KRONTIRAS, C A and SOTIROPOULOS, J (2006). Dielectric and conductivity processes in poly(ethylene terephthalate) and poly(ethylene naphthalate) homopolymers and copolymers. J. Polymeric Science Part B: Polymer Physics, 44: 30783092.. KONTOS, G A; SOULINTZIS, A L; KARAHALIOU, P K; PSARRRAS, G C; GEORGA, S N; KRONTIRAS, C A and PISANIAS, M N (2007). Electrical relaxation dynamics in TiO 2-polymer matrix composites. Express polymer Letter, 1: 781-789.. RIANDE, E and DIAZ-CALLEJA, R (2004). Dielectric spectroscopy of polymeric materials: fundamentals and applications. Chapter 5. Electrical Properties of Polymers. Marcel Dekker, New York. p. 139-173.. Korzhenko, A A; Tabellout, M and Emery, J R (2000). Dielectric relaxation properties of the polymer coating during its exposition to water. Material Chemistry and Physics, 65: 253-260.. Robertson, J A; Lyon, B G; Morrison, W H and Miller, J F (1988). Sensory and chemical evaluation of stored oil-roasted, high oleic nano oil sunflower kernels. J. Amer. Oil Chem. Soc., 65(6): 985-989.. Korzhenko, A; Tabellout, m and Emery, J R (1999). Influence of a metal-polymer interfacial interaction on dielectric relaxation properties of polyurethane. Polymer, 40: 7187-7195.. Sasabe, H and Saito, S (1968). Dielectric relaxations and electrical conductivities of poly(alkyl methacrylates) under high pressure. J. Polymer Science, 6: 1401-1418.. Kulkarni, A R; Lunkenheimer, P and Loidl, A (1998). Scaling behaviour in the frequency dependent conductivity of mixed alkali glasses. Solid State Ionics, 112: 69-74.. Sharif, A; Ashraf, S M; Sharmin, E; Zafar, F and Abdul, H (2002). Studies on ambient cured polyurethane modified epoxy coatings synthesized from sustainable resource. Progress in Crystal Growth and Characterization of Materials, 45: 83-85.. Murugaraj, R; Govindaraj, G and Deepa George (2003). AC conductivity and its scaling behavior in lithium and sodium bismuthate glasses. Materials Letters, 57: 1656-1661. Oertel, G (1985). Polyurethane Handbook. Hanser, Munich.. Spathis, G; Niaounakis, M; Kontou, E; Apekis, L; Pissis, P and Christodoulides, C (1994). Morphological changes in segmented polyurethane elastomers by varying the NCO/OH ratio. J. Appl. Polym. Sci, 54: 831-842.. Patton, T C (1962). Alkyd Resin Technology. Interscience Publication, New York. Pissis, P; Apekis, L; Christodoulides, C; Niaounakis, M; Kyritis, A and Nedbal, J (1996). Water effects in polyurethane block copolymers. J. Polymeric Science Part B: Polymer Physics, 34: 1529-1539.. TSANGARIS, G M and PSARRAS, G C (1999). The dielectric response of a polymeric three-component composite. J. Material Science, 34: 2151-2157. Velayutham, T S; Abd Majid, W H; Ahmad, A B; Yik Kang Gan and Seng Neon Gan (2009a). The physical and mechanical properties of polyurethanes from oleic acid polyols. J. Appl. Polym. Sci., 112: 3554-3559.. Pissis, P; Georgoussis, G; Bershtein, V A; Neagu, E and Fainleib, A M (2002). Dielectric studies in homogeneneous and heterogeneous polyurethane/polycyanaurate interpenetrating polymer networks. J. Non-Crystalline Solids, 305: 150-158.. Velayutham, T S; Abd Majid, W H; Ahmad, A B; Gan Yik Kang and Gan, S N (2009b). Synthesis and characterization of polyurethane coatings derived from polyols synthesized with glycerol, phthalic anhydride and oleic acid. Prog. Organic Coatings, 66: 367-371.. 1266.
(8)
Figure

Related documents
In this study, the use of marks tracking technique allow the determination of the rigidity of 48600 C 1300 carbon fabrics, and allow calculation of their shear angle, lock
The image sample of the test data the second group, 30 leaves of jati belanda, could be reconstructed into a matrix Yo as reconstructed spectral samples, after the matrix W from
The Coca-Cola Company acquired soft drink brands like Thumps Up, Gold spot, Limca, Maaza, which were floated by Parle, as these products had achieved a strong
The amount of a commodity purchased per unit of time is a function of or depends on the price of the commodity, money incomes, the prices of other (related) commodities, tastes
The aim of the work was to establish the influence of most important abiotic planting factors (temperature, precipitation quantity) on the respiratory rate of fruit vegetables
working. B2/1/0 means that the candidate can earn anything from 0 to 2. The marks indicated in the scheme may not be subdivided. If there is genuine doubt whether a candidate
When courts apply the rational basis test, they consistently find that statutes capping noneconomic damages are in fact rationally related to the legitimate government purposes
Or does it support proposals for research programmes or areas (such as Internet of Things, Big Data Analytics, etc) which have translational impact on Smart Nation. This grant call
