Au t o m a ti c s p e e c h-t o-b a c k g r o u n d
r a ti o s el e c ti o n t o m a i n t a i n
s p e e c h i n t elli gi bility i n
b r o a d c a s t s u si n g a n o bj e c tiv e
i n t elli gi bility m e t r i c
Ta n g , Y, F a z e n d a , B M a n d C ox, TJ
h t t p :// dx. d oi.o r g / 1 0 . 3 3 9 0 / a p p 8 0 1 0 0 5 9
T i t l e
Au t o m a ti c s p e e c h-t o-b a c k g r o u n d r a ti o s el e c ti o n t o
m a i n t ai n s p e e c h in t elli gi bility in b r o a d c a s t s u si n g a n
o bj e c tiv e i n t elli gi bility m e t r i c
A u t h o r s
Ta n g , Y, F a z e n d a , B M a n d C ox, TJ
Typ e
Ar ticl e
U RL
T hi s v e r si o n is a v ail a bl e a t :
h t t p :// u sir. s alfo r d . a c . u k /i d/ e p ri n t/ 4 4 8 8 9 /
P u b l i s h e d D a t e
2 0 1 7
U S IR is a d i gi t al c oll e c ti o n of t h e r e s e a r c h o u t p u t of t h e U n iv e r si ty of S alfo r d .
W h e r e c o p y ri g h t p e r m i t s , f ull t e x t m a t e r i al h el d i n t h e r e p o si t o r y is m a d e
f r e ely a v ail a bl e o nli n e a n d c a n b e r e a d , d o w nl o a d e d a n d c o pi e d fo r n o
n-c o m m e r n-ci al p r iv a t e s t u d y o r r e s e a r n-c h p u r p o s e s . Pl e a s e n-c h e n-c k t h e m a n u s n-c ri p t
fo r a n y f u r t h e r c o p y ri g h t r e s t r i c ti o n s .
sciences
Article
Automatic Speech-to-Background Ratio Selection to
Maintain Speech Intelligibility in Broadcasts Using
an Objective Intelligibility Metric
Yan Tang * ID, Bruno M. Fazenda ID and Trevor J. Cox ID
Acoustics Research Centre, University of Salford, Salford M5 4WT, UK; [email protected] (B.M.F.); [email protected] (T.J.C.)
* Correspondence: [email protected]; Tel.: +44-161-295-0469
Received: 13 November 2017; Accepted: 27 December 2017; Published: 3 January 2018
Abstract: While mixing, sound producers and audio professionals empirically set the speech-to-background ratio (SBR) based on rules of thumb and their own perception of sounds. There is no guarantee that the speech content will be intelligible for the general population consuming content over a wide variety of devices, however. In this study, an approach to automatically determine the appropriate SBR for a scene using an objective intelligibility metric is introduced. The model-estimated SBR needed for a preset minimum intelligibility level was compared to the listener-preferred SBR for a range of background sounds. It was found that an extra gain added to the model estimation is needed even for listeners with normal hearing. This gain is needed so an audio scene can be auditioned with comfort and without compromising the sound effects contributed by the background. When the background introduces little informational masking, the extra gain holds almost constant across the various background sounds. However, a larger gain is required for a background that induces informational masking, such as competing speech. The results from a final subjective rating study show that the model-estimated SBR with the additional gain, yields the same listening experience as the SBR preferred by listeners.
Keywords:speech intelligibility; objective intelligibility metric; broadcasting; object-based audio
1. Introduction
Audience research conducted by the British Broadcasting Corporation (BBC) has shown that approximately 60% of viewers in the UK experience some difficulties understanding speech content in programmes. This is due to a combination of factors such as background sound effects, intrinsically
unintelligible speech, unfamiliar accents and loud ambient noise in the listening environment [1].
This paper focusses on masking caused by inappropriate levels of background sound.
In films, TV and radio programmes, speech content is usually accompanied by background sounds and effects. These sounds (e.g., music) may be added by a programme producer for narrative purposes or to create a certain atmosphere. The sounds and effects may also exist in the original speech recordings, for example the recording might contain reverberation in a large conference room and clapping by an audience. While these background sounds and effects may improve an audience’s experiences by providing ‘realistic’ or ‘being there’ feelings, they can also lead to poorer speech intelligibility. In some situations, even listeners with normal hearing struggle to understand what is being said in programmes. It is even more difficult for listeners with hearing impairments or whose
native language is different from that of the programme [2].
A sound designer or producer usually decides on the mixing level of the speech and background based on his/her intentions and experiences. The speech-to-background ratio (SBR) may be chosen
according to certain rules of thumb. Here are some examples for broadcasting from sound producers
and audio professionals [3]:
• In the presence of background music, while the music is usually set to−20 dB, the dialogue is
about−20 to−12 dB. This makes sure that the background music does not interfere with the
dialogue. Alternatively, speech level is empirically expected to be at between 4 and 6 (0 dB and +8 dB) on a peak programme meter. Music and effects are balanced to satisfy the artistic intentions.
• The mixing level may greatly vary across different programmes based on the producer’s
experiences and taste. As such, the relative level between dialogue and other tracks may be determined solely based on the producer’s preference.
• The studio often represents optimal listening conditions. A responsible mixer/producer also
checks mixes on other reproduction systems other than those in the studio, because there is always a compromise after the point when the mix sounds as good as it should in the studio. For example, the producer listens to the programme on TV speakers at the post-production stage in order to know how it would sound on the audiences’ TVs.
• An approach to check the balance between the dialogue and music or sound effects is to trigger
the variation of frequency sensitivity with volume (represented well by the Fletcher-Munson equal-loudness curves) by listening to the mix at low volume. If the dialogue is sufficiently intelligible at low volume, it will work on most speaker setups.
It is clear that in most cases, the decision on the final mixing level of broadcasting programmes relies to a great extent on sound producers’ own perception to the mix, and is based on their personal preference. Furthermore, all the checking work has to be done manually by the sound producer or someone during the postproduction stage, in order to make sure that the mixing level does not compromise both speech intelligibility and artistic intentions. Despite precautions, the audience still
often needs the assistance of on-screen captions: 10% of the BBC audience uses subtitles [4]. It is
possible that the producer is so familiar with the script, and thus with the speech content, that the chosen SBR is set too low. While mumbled speech may not be a problem for the producer who has repeatedly heard the dialog during editing, audiences may struggle.
Sound designers or producers seem to lack a psychoacoustic guide that allows them to estimate the likelihood of the audience being able to understand the speech at their preferred mixing levels, or gives them minimum mixing levels for a desired intelligibility. Consequently, the mixing level decided by conventional empirical approaches may fail in maintaining intelligibility in two aspects. First, the mixing level may not work for all reproduction output configurations. While high-end spatial audio systems (e.g., 22.2 and 9.1) can preserve sufficient spatial cues (e.g., source azimuth) which listeners can use to enhance speech intelligibility, other systems with reduced spatial capabilities and often use down-mixed versions of the programme material (e.g., stereo) and so may not be able to
provide the same level of intelligibility. Many studies (e.g., [5–9]) have suggested that spatial cues
can significantly improve speech intelligibility even when the SBR remains constant. Loss of these spatial cues may lead to poor intelligibility in low-end systems. Unfortunately, stereo loudspeakers in TVs are often of poor quality and mono audition is common for radios and mobile devices. Second, background sounds vary in their masking effect. It is well documented that the type of background
sound affects listener speech perception differently [10–17]. Compared to fluctuating background
sounds (e.g., temporally-modulated sounds), stationary background sounds (e.g., pink noise) usually introduce stronger masking effects to speech even at the same SBR level. This implies that an optimal SBR, which maintains speech intelligibility while providing a reasonable atmosphere to the audio scene, should vary over time.
Some research has focused on solving this problem by enabling the audience to gain control
of the foreground-background mixing level. Shirley and Oldfield [18] introduced an approach
carrying the speech content to be separately transmitted; end users therefore can alter the SBR level
to achieve better intelligibility for the speech content. Paulus et al. [19] proposed an object-based
coding system to enhance dialogues for TV and radio broadcasts. This system enables renderer-listener interaction and permits listeners to control the mixing level for personalised intelligibility. Similar
to [18], this approach essentially adjusts the gain of speech as a single object against the gain of other
objects in the background. Further subjective rating experiments suggested that this system improved listeners’ experience when auditioning speech content in background sounds. However, in order to make adaptations the system expects input from the listener, but the desired SBR varies as the broadcast material changes. Thus, this begs the question: is it possible to automatically adjust the mixing level? In this way, a preset intelligibility goal (set by either the sound producer or listener) can be ensured over time.
Objective intelligibility models (OIMs) have been improving in accuracy for almost a century.
State-of-the-art OIMs (e.g., [20–24]) are capable of making accurate intelligibility predictions in various
masking conditions, with their binaural counterparts able to deal with more realistic situations [25–28].
Compared to conventional subjective evaluations which are usually time-consuming and expensive, OIMs are computationally fast and thus easy to incorporate into a closed-loop optimisation framework for intelligibility. OIMs have been used for interim speech intelligibility evaluations for optimising
speech modification algorithms developed to boost speech intelligibility in noise (e.g., [29–31]), prior to
final subjective evaluation. Having demonstrated its applications, it may be possible to adopt an OIM in an audio system as an intelligibility meter and further as a guide to select appropriate mixing levels for the speech content. There are several reasons that OIMs may be useful for these purposes: (1) OIMs are physically and physiologically plausible—they are built based on valid auditory models, (2) their prediction is evaluated against human listeners’ perceptual performance in various conditions, (3) they can be treated as an independent input-output component, and hence can be plugged into existing systems without substantial alteration to other components in the entire system, and (4) from word to sentence, they can make predictions over time and thus enable dynamic online operation.
Müsch attempted to adopt the Speech intelligibility Index (SII) [20] to control the background level
in a 5.1 system, in order to increases overall comprehension and to reduce listening effort for elderly
people [32]. However, the intelligibility criterion used to alter the background level was not detailed
and the proposed system was not systematically evaluated. Thus, its performance is unknown. In this article, we propose an approach to automate mixing levels based on intelligibility
predictions from an OIM for an object-based audio system. In Section 2, the framework of the
proposed system is described. The first attempt to predict an appropriate SBR mixing level uses the
OIM Binaural Distortion-Weighted Glimpse Proportion (BiDWGP) [9]. This is detailed in Section3,
where the predictive accuracy is also compared to four other OIMs including two standard intelligibility
measures—SII and Speech Transmission Index (STI) [21]—the Normalised-Covariance Measure
(NCM) [33], and the Short-Time Objective Intelligibility (STOI) [23]. Section4details a psychoacoustic
experiment where listeners give their preferred SBR. It is found that the SBR is not the same as that expected from the OIM work. A gain adjustment to the SBR is required and this depends on the type
of background sound. Section5details a subjective experiment to access the performance of the OIM
system with the suggested gain adjustment from the previous experiment. Finally, conclusions are
drawn in Section6.
2. Proposed System
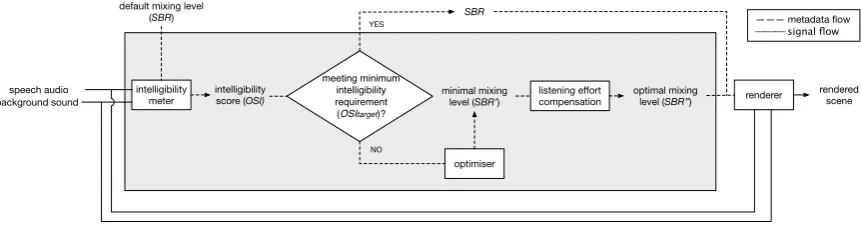
A schematic overview of the proposed system is shown in Figure1. In an object-based audio
system, the intelligibility module using an OIM may sit prior to the renderer in the pipeline, acting on the metadata. In this case, no changes to the existing rendering algorithms are required. This intelligibility module essentially consists of two main components—the speech intelligibility meter and the mixing level optimiser that sets the SBR. The speech intelligibility meter takes speech and
intelligibility scoreOSI. The objective score is then fed into a decision component, which makes
a judgement on whether the intelligibility meets the minimum required (Section3). If the current
default SBR leads to satisfactory intelligibility then nothing is altered. If the speech intelligibility
falls below the minimum, then the optimiser will look for a new mixing levelSBR0that should push
the intelligibility above the minimum required. To further take listener listening effort into account,
SBR0may need further adjustment to achieve an optimal mixing levelSBR00(See Section4).
intelligibility meter
intelligibility score (OSI)
background sound
minimal mixing
level (SBR’) renderer
rendered scene meeting minimum
intelligibility requirement (OSItarget)?
NO
optimiser
YES
speech audio
——— metadata flow
signal flow
default mixing level
(SBR) SBR
listening effort compensation
[image:5.595.82.513.183.296.2]optimal mixing level (SBR’’)
Figure 1.Schematic of a rendering system with intelligibility control. The current study focuses on the section in shadow.
2.1. Selection of OIM
In principle, any OIM may serve as the intelligibility meter in Figure1. However, previous studies
(e.g., [24,34]) have shown that some OIMs do not work well across the broad range of maskers found in
broadcast audio. The background may vary over time from music to crowd babble sound, from general soundscapes to competing talkers. Building a large database of statistics of various background sounds to rectify each model output is therefore impractical. To solve this problem, Tang proposed
a metric—distortion-weighted glimpse proportion (DWGP, [24])—based on a notion that both masked
audibility and disturbance on speech modulation resulting from the masking effect of the noise masker, should account for the reduction of speech intelligibility in noise. The former aspect is quantified in each analytical frequency band as the percentage of the time-frequency regions on the speech signal with a speech-to-noise ratio above a pre-defined threshold (e.g., 3 dB); the latter effect is calculated as the distortion factor for each frequency, using cross-correlation between the envelopes of the clean and the noise-corrupted speech signals. The distortion factor is then used to weight the masked audibility in each band. The final predictive score is the sum of the masked audibilities across all the
frequencies after further being weighted by the band importance function [20], which determines
the contribution of each frequency to the overall intelligibility. In assessment, the DWGP metric has demonstrated a good match to subjective data when treating each noise separately and across a wide
range of background noise, with squared Pearson correlation coefficientsr2>0.71 [24].
In 2015, Tang et al. further extended the DWGP metric to binaural DWGP (BiDWGP),
thus affording a more ecologically valid application of the metric [9]. See [28] for implementation details
of BiDWGP. Two prominent aspects of binaural listening are modelled in this extension: the better-ear effect due to the head-shadowing and binaural unmasking. BiDWGP can predict intelligibility either directly from the binaural recordings or from monophonic recordings of each sound source along with their locations. Predictions made using the two input forms are almost identical in anechoic
conditions [28]. As an extension to DWGP, when BiDWGP is used for monaural situations it operates
the same to DWGP. Therefore, BiDWGP is able to replace its monaural counterpart in any cases.
The evaluations in both anechoic [28] and reverberant [34] conditions have suggested that the
BiDWGP outperformed the standard metrics such as the SII (r2≥0.48) and the STI (r2≥0.62) in many
conditions, and was able to provide reliable intelligibility estimations (r2≥0.77). Figure 2furthers
compares the listeners’ word recognition rates at sentence level from three previous studies [9,34,35]
presented monaurally or binaurally. A strong linear relationship between the subjective data and
BiDWGP prediction is evident withr2 = 0.81 across all 190 data points/conditions. Providing its
robust predictive power, the BiDWGP metric was hence chosen as the OIM for intelligibility metering in the work presented here.
0 0.1 0.2 0.3 0.4 0.5 0.6 0.7 0.8 0.9 1
BiDWGP 0
10 20 30 40 50 60 70 80 90 100
Word recognition rate (%)
Anechoic monaural (Cooke et al., 2013) Anechoic binaural (Tang et al., 2015) Reverb binaural (Tang et al., 2016)
[image:6.595.141.457.154.372.2]r2 = 0.81, p < 0.001
Figure 2. Scatter plot of listeners’ sentence-level word recognition scores against binaural distortion-weighted glimpse proportion (BiDWGP) predictions for monaural listening in anechoic conditions (30 solid circles), binaural listening in anechoic (120 open circles) and reverberant conditions (40 crosses).r2is also provided.
2.2. Intelligibility Criteria
Sound reproduction setup in end users’ living rooms can vary in their specifications. It may be unfeasible to build a system which is capable of making accurate speech intelligibility predictions for all different audio systems from high end down to low end, and in particular making adaptions to accommodate each system automatically. However, as aforementioned, down-mixing, from 22.2 to a stereo system for example, effectively leads to the gradual loss of spatial cues such as relative source separation and distance between objects. As such, given a dialogue scene with a default mixing level, intelligibility may decrease monotonically from a 22.2 to a mono system, with the worst intelligibility in the latter case. In turn, if the intelligibility of the mono system is guaranteed, with the same mixing level there should not be any further intelligibility issue for high-end systems in which spatial cues may be preserved.
The BiDWGP metric is in the form of a numeric index like other OIMs (e.g., SII and STI), which falls into the range of 0–1 with larger numbers indicating better intelligibility. The output does not directly provide any information about the SBR, however, and so a transformation from index to SBR is needed. What SBR is optimal for speech? To answer this key question, an assumption is made that the optimal SBR should guarantee that all the information conveyed by the speech will be well understood by listeners. The next section details an experiment to measure the minimum SBR leading to 100% intelligibility for normal hearing listeners in a range of background sounds when listening monaurally.
3. Experiment I: Minimal SBR for Full Sentence-Level Intelligibility
This experiment was designed to measure the possible lowest SBR for full intelligibility SBRminat
sentence level for different background sounds. A further aim of this experiment was to quantify the
3.1. Stimuli
Speech materials were drawn from the SCRIBE corpus [36]. This corpus consists of speech
sentences (e.g., ‘the EARTH USED to BE FLAT but NOW IT’S a SPHERE’, with the keywords capitalised) uttered by eight (four male and four female) native British English talkers. As many
studies (e.g., [37,38]) have shown great variation in speech intelligibility between different talkers,
having speech from many talkers makes the experiment more ecologically valid. In order to control the size of the experiment, speech produced by two male (M5 and M8) and two female (F6 and F7) talkers were used based on a pilot test, in which keyword recognition rate of listeners was measured as the
intelligibility in speech-shaped noise (SSN) at−6 and 0 dB SBR. The results suggested that the chosen
talkers are representative of the most and the least intelligible cases of each gender in the corpus under the tested background conditions.
The background sounds covered a wide range of types—both stationary and fluctuating— including: SSN, which has the long-term average spectrum of the speech corpus; cafeteria babble noise (BAB); competing speech (CS) drawn from news broadcasting; a rock song (SNG, ‘Song for Someone’ by U2), and the same song with vocal track being removed (MSC, i.e., instrumental sounds only).
Note that in order to reduce the effect of informational masking caused by the same gender [16],
CS from a person of the opposite gender to the target talker was used. For each speech-background stimulus pair, the background signal was randomly cropped from a 5-min long signal, and preceded and followed the speech by 300 ms. In total, this setup led to 20 conditions (5 background sounds
×4 talkers).
3.2. Procedure and Listeners
The determination of SBRminwas a 1-up/1-down adaptive process in progression by following
the procedure described in [39]. The experiment was conducted using a MATLAB (v9.1 by MathWorks,
Natick, MA, USA, 2016) graphical user interface (GUI). Each background condition consisted of 10 non-repetitive stimuli which were presented in a random order. Starting from a very low SBR
(−21 dB), the listener was instructed to manually increase the background level until they could only
just understand everything in the first sentence. Within the first trial, the listener could hear the sentence as many times as s/he needed to find the appropriate SBR. Once the initial SBR was set, the listener was required to type what was heard using a physical computer keyboard. Upon finishing the transcription of the sentence, the original correct answer was displayed with all the keywords capitalised. The listener self-checked the correctness of all the keywords; s/he was instructed to ignore any errors due to typos, homophones, contractions, punctuation or differences in tense and plurality. The programme then decreased or increased the SBR by 2 dB for the next sentence according to whether or not the listener obtained a score of 100% correct in the current sentence.
In the subsequent nine trials, the SBR could no longer be adjusted by the listener; instead it was adaptively controlled by the programme using the same 1-up/1-down criteria. Each sentence was
played only once prior to the listener’s response. The final SBRminfor this condition was the average
SBR across the final eight trials. The same procedure was repeated for all the 20 conditions, the order of which was also randomised. Through all the conditions, the listener did not hear any utterance twice.
The experiment took place in an semi-anechoic room with a background noise level of 3.8 dB(A). The stimuli were presented to listeners monaurally over a pair of Sennheiser (Wedemark, Germany) HD650 headphones after being pre-amplified by a Focusrite (High Wycombe, UK) Scarlett 2i4 USB audio interface. The SBR for each speech-masker pair was calculated across the entire signals. The presentation level of speech only over the headphones was calibrated using Brüel & Kjær (B&K, Nærum, Denmark) 4153 artificial ear with a B&K 2610 measuring amplifier, and fixed at 69 dB(A). Thus, in the experiment the SBR was altered only by varying the level of the background sound.
The Research Ethics Panel at the College of Science and Technology, University of Salford, granted ethical approval for all the experiments conducted in this work.
3.3. Results
Of the 14 participants, two did not complete all the conditions due to slow progress; hence their data is excluded from the results presented below. Data of another participant was also discarded
after an outlier analysis. Therefore, the mean SBRmin levels shown in Figure3as open circles are
based on the remaining 11 participants. The measured SBRmin levels fall into the range of −9.4
to 3.5 dB across all backgrounds and talkers. A two-way repeated measures ANOVA with within
subject factors (5 background sounds×4 talkers) revealed a significant effect of both background
type [F(4, 40) =52.670,p< 0.001,η2= 0.538] and talker [F(3, 30) = 67.694,p <0.001,η2 =0.594],
as well as a significant two-way interaction between background type and talker [F(12, 120) =2.665,
p<0.01,η2=0.130]. This suggests that the minimum SBR which listeners require varies significantly
across various background sounds and speech content produced by different talkers.
SSN BAB CS SNG MSC
-12 -9 -6 -3 0 3 6
SBR
min
(dB)
F6
Measured Predicted
SSN BAB CS SNG MSC
-12 -9 -6 -3 0 3 6
SBR
min
(dB)
F7
SSN BAB CS SNG MSC
-12 -9 -6 -3 0 3 6
SBR
min
(dB)
M5
SSN BAB CS SNG MSC
-12 -9 -6 -3 0 3 6
SBR
min
(dB)
[image:8.595.84.514.291.579.2]M8
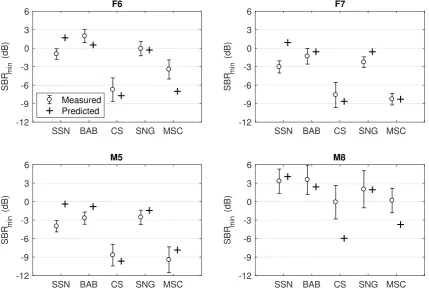
Figure 3. Measured (circle) and predicted (cross) lowest speech-to-background ratio (SBRmin) in
speech-shaped noise (SSN), babble (BAB), competing speech (CS), song (SNG) and the same song with vocal track being removed (MSC), grouped by talker. Error bar indicates 95% confidence interval of the mean. Predicted SBRmincorresponds to BiDWGP of 0.5 in each condition.
Post-hoc pairwise comparisons with Bonferroni correction further confirmed the visual impression
that stationary backgrounds (SSN and BAB) lead to higher SBRminthan fluctuating background (CS)
for speech produced by all talkers [allp<0.05], except for M8. This is consistent with the findings
reported in the literature (e.g., [11,13]). Furthermore, by removing the vocal track from SNG, which to
some extent functions as competing speech and potentially introduces both energetic and informational
masking to intelligibility, SBRminfor all talkers in MSC substantially decreased compared to that in SNG
[allp<0.01] with M8 being an exception. SBRminfor the speech of M8 did not vary as dramatically as
that had been observed in the pilot test, leading to the relatively high SBRminat which the intelligibility
to listeners usually converges. Comparing across the four talkers, it is evident that speech produced by
M8 had a higher SBRminthan other talkers in SSN, CS and MSC backgrounds [allp<0.05].
3.4. Model Predictions of SBRmin
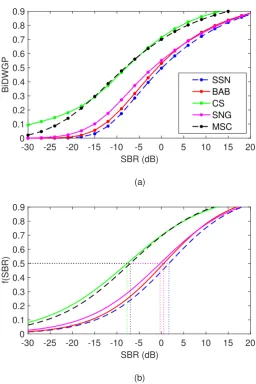
A function that allows conversion from a desired BiDWGP to the mixing level SBR is required.
The upper panel of Figure4illustrates the BiDWGP scores as a function of SBR in various background
sounds for talker F6. Each data point on the plotted lines (in steps of 3-dB SBR) was calculated as the
mean of the BiDWGP scores for all samples used in the SBRminpsychoacoustic experiment. In order
to formulate a function relating BiDWGP and SBR, a two-parameter sigmoid function in the form of
BiDWGP= f(SBR) =1/(1+exp(−a−b·SBR))with variablesaandbwas constructed using the
MATLABglmfitfunction with a normal distribution andlogiclink function. The fitted functions are
shown in the lower panel of Figure4. Subsequently, given a desired BiDWGP score, the required SBR
in the presence of each background sound can be calculated using the inverse of the function f. Due to
the masking effect varying between background sounds, different SBR values for a given BiDWGP
score are found. In the lower panel of Figure4the SBRs required in order to achieve a BiDWGP score
of 0.5 in different background sounds is shown (The reason for choosing a BiDWGP score of 0.5 is explained below). This procedure was also applied to the other talkers.
-30 -25 -20 -15 -10 -5 0 5 10 15 20
SBR (dB)
(a) 0
0.1 0.2 0.3 0.4 0.5 0.6 0.7 0.8 0.9
BiDWGP
SSN BAB CS SNG MSC
-30 -25 -20 -15 -10 -5 0 5 10 15 20
SBR (dB)
(b) 0
0.1 0.2 0.3 0.4 0.5 0.6 0.7 0.8 0.9
[image:9.595.169.426.337.722.2]f(SBR)
Drawing on the perceptual experiment that determined listeners’ SBRmin, it is possible to derive
the BiDWGP score which corresponds to the predicted SBRmin in all tested conditions. This was
performed by minimising the root-mean-square error (RMSE) between the measured and the predicted
SBRminover 12 conditions (3 background sounds×4 talkers) from SSN, BAB and CS. In order to
investigate the robustness of this process for unseen conditions, 8 conditions from SNG and MSC were excluded from the RMSE minimisation and were reserved for testing only.
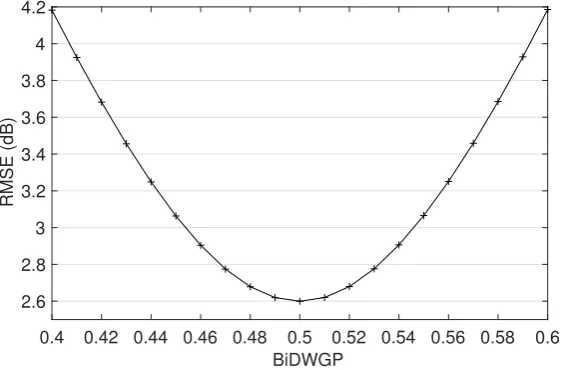
Figure5shows RMSE as a function of BiDWGP scores. It suggests that SBRs leading to a BiDWGP
of 0.5 provides the closest match to the measured SBRmin, with a RMSE of 2.6 dB across SSN, BAB and
CS. When predicting the SBRminfor the previously unseen SNG and MSC cases using 0.5 BiDWGP,
the RMSEs are 1.0 and 2.8 dB across all the talkers, respectively. The BiDWGP scores corresponding
to SBRminwere also individually learnt for SNG and MSC. They are 0.48 (RMSE: 0.8 dB) and 0.52
(RMSE: 2.4 dB) for SNG and MSC, respectively—the RMSEs of the predictions using 0.5 BiDWGP are merely 0.2 and 0.4 dB higher for the two maskers. Consequently, the value of 0.5 was used
for all background sounds to derive the SBRmin. The predicted SBRmin levels in all conditions are
displayed against the measured values for all speakers and markers in Figure 3. With a strong
linear relationship [r2=0.70,p<0.001] and the least RMSE (2.4 dB) between the measured and the
predicted values, the BiDWGP metric was considered capable of making reasonable SBRminpredictions
in tested background sounds, especially as this was performed across both factors of background sound and talker.
0.4 0.42 0.44 0.46 0.48 0.5 0.52 0.54 0.56 0.58 0.6
BiDWGP 2.6
2.8 3 3.2 3.4 3.6 3.8 4 4.2
[image:10.595.158.439.354.539.2]RMSE (dB)
Figure 5. Root-mean-square error (RMSE) between measured and predicted SBRmin in decibel as
a function of corresponding BiDWGP score.
Any OIM could be used in the place of BiDWGP here as the intelligibility predictor. However, the predictive power of the chosen OIM may affect the robustness of the system. As an illustration, the performance of another four OIMs was also investigated, including the SII and the STI—two standard intelligibility measures—and two more recent measures: NCM and STOI. The SII makes intelligibility predictions from the normalised frequency-dependent speech-to-noise ratios, which reflect the masked-audibility of each frequency in noise. The STI quantifies intelligibility by accounting for the reduction in the modulation depth of speech envelope using the modulation transfer function. Similar to the STI, NCM computes the distortions caused by the noise masker or reverberation by comparing the similarity between the envelopes of the noise-corrupted signal and the clean reference speech signal. Rather than long-term speech envelope, STOI operates on short-term envelope to quantify the distortions affecting intelligibility. It was originally proposed for estimating
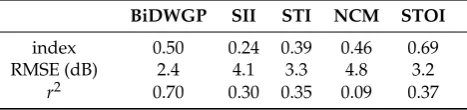
intelligibility of speech signals processed by enhancement algorithms. Table1summarises the objective
between the measured and predicted SBRminin the second and the third rows were calculated from the
predicted SBRminvalues, using the objective score of each OIM across all 20 conditions (5 background
[image:11.595.181.415.176.231.2]sounds×4 talkers).
Table 1.Objective index leading to the minimal RMSE (in dB), RMSE andr2between the measured and predicted SBRminof five OIMs.
BiDWGP SII STI NCM STOI
index 0.50 0.24 0.39 0.46 0.69 RMSE (dB) 2.4 4.1 3.3 4.8 3.2
r2 0.70 0.30 0.35 0.09 0.37
3.5. Interim Discussion
A listening experiment was conducted to measure listeners’ SBRmin for speech produced by
four talkers in a set of background sounds. The results suggest that SBRminmay vary considerably
from one background sound to other. The talker effect is also evident, resulting in different SBRmin
levels even in the presence of the same background sound. All the evidence from this experiment supports the view that a constant SBR for speech-background mixing does not guarantee that target speech information can be understood over all background sounds and talkers. One possibility would be to make the SBR for the target speech very high. However, the potential problem of adopting a high SBR would be that a sound editor’s intentions (e.g., creating an atmosphere for an audio scene by adding background sounds) could no longer be fulfilled.
SBRmin levels measured in this study were for monaural listening, simulating intelligibility
reproduced by mono audio systems or stereo systems with the target speech played diotically.
For multi-channel systems in which sound objects can be perceived spatially separated, the SBRminmay
be expected to be lower than in monaural situations because human listeners are able to use different
spatial cues such as interaural level and time differences to achieve better intelligibility [5–8,28].
The predicted SBR level which led to a BiDWGP score of 0.5 was the closest to the measured SBRmin
in each background sound. The performance of the BiDWGP metric in predicting SBRmin(r2=0.70) is
not as good as in predicting word recognition rates (r2>0.81) reported in the previous studies [9,34,35].
Although several types of background sounds were also used in those tests for measuring word recognition rate, speech sentences were usually uttered by a single talker. By introducing both the background and talker effects in the current experiment, the BiDWGP metric seems to lose some predictive accuracy after the function fitting for BiDWGP-SBR mapping. Nevertheless, compared
to predictions by other OIMs (Table1), BiDWGP led to the lowest RMSE and the highestr2. Thus,
a RMSE of 2.4 dB over all tested conditions is considered acceptable as a first approximation for SBR adjustment.
For cases in which the proposed system is only used to examine whether an intended mixing
level (SBRin Figure1) can meet the minimal intelligibility requirement, the proposed method is able
to automatically fulfil this purpose. This method could also determine the optimal mixing level for a given foreground-background pair. However, the optimal SBR is not just about speech intelligibility, it should also provide a comfortable balance between the foreground and background sounds. In the next section, an experiment to determine the preferred SBR is outlined.
4. Experiment II: Listener-Preferred SBR for Speech-Background Mixing
4.1. Stimuli
Five audio scenes were created including football commentary, news broadcasting, public speech,
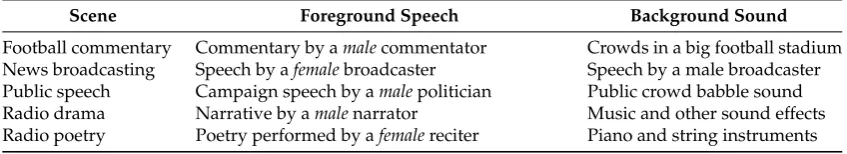
radio drama, and radio poetry, all of which are quotidian audio content. Table2details the foreground
[image:12.595.85.509.224.301.2]speech and background sound of the chosen audio scenes. As stimuli for each scene, four excerpts were created, leading to a total of 20 excerpts in the experiment. Each excerpt lasted 15–24 s. In all excerpts, the intensity of the foreground speech was normalised to the same root-mean-square value; the background sound preceded and followed the foreground speech by one second.
Table 2.Foreground speech and background sound in the five audio scenes presented in Expt. II.
Scene Foreground Speech Background Sound
Football commentary Commentary by amalecommentator Crowds in a big football stadium News broadcasting Speech by afemalebroadcaster Speech by a male broadcaster Public speech Campaign speech by amalepolitician Public crowd babble sound Radio drama Narrative by amalenarrator Music and other sound effects Radio poetry Poetry performed by afemalereciter Piano and string instruments
4.2. Procedure and Listeners
The playback and adjustment of foreground-background mixing level were controlled by a MATLAB GUI. The listener auditioned the scenes in the same room and using the same equipment as per Expt. I. While the foreground speech was presented diotically to the listener, the background sound was played stereophonically. The task for listeners was to choose an appropriate mixing level for the speech content and the background sound; the chosen mixing level for each scenario should result in the speech content being intelligible enough and the background sound providing good atmosphere to the scene. No reference scene was provided as a guide for either ‘well’ or ‘badly’ mixed content. The listener was allowed to adjust the master volume to a comfortable level at the beginning of the experiment. The mixing level was adjusted by only altering the background sound level using a vertical fader. Any changes to the mixing level took effect straight after the fader was adjusted while the audio was playing. The listener could listen to each excerpt as many times as necessary. A ‘Play’ and a ‘Stop’ button were provided for the listener in the programme to start and cease playing at anytime. The programme also informed the listener which sounds were the foreground and which were background sounds in the current scene. This ensured that the listener attended to the correct channel, especially in the ‘News broadcasting’ scene in which the background sound was also speech. Once a mixing level was chosen, pressing the ‘Next’ button started the next excerpt. The presentation order of the 20 excerpts was randomised for each listener.
Thirty native British English speakers (ages: 18–35 year, mean age: 25 year) with normal hearing participated in this experiment. Nine participants were undergraduates or graduates studying acoustics at the University of Salford, or sound professionals.
4.3. Results
For each listener, the SBR for each audio scene was averaged over the four excerpts. The mean
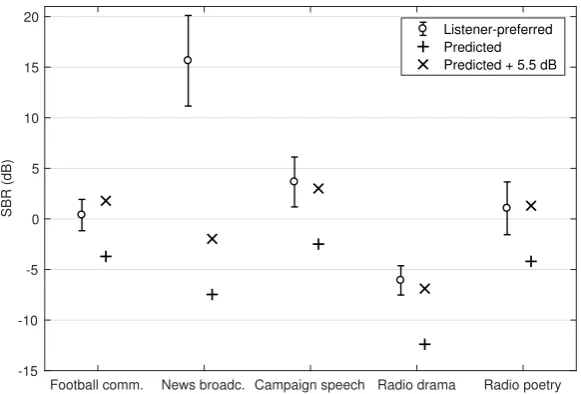
SBR level chosen by listeners for each type of audio content is displayed in Figure 6 as open
circles with error bars indicating 95% confidence intervals of the means. Across the five audio
scenes, the listener-preferred SBRs for mixing are between −6.1 to 15.6 dB, with that for the
‘News Broadcasting’ and ‘Radio drama’ scenes being the highest and lowest, respectively. One-way within-subject ANOVA confirmed that the listener-preferred SBR significantly varied between audio
scenes [F(4, 116)=47.347,p < 0.001,η2 = 0.620]. Post-hoc pairwise comparisons with Bonferroni
correction further suggested that while listeners chose the same SBRs for the ‘Football commentary’,
‘Public speech’ and ‘Radio poetry’ scenes [allp>0.05], the SBRs for ‘News broadcasting’ [p<0.001]
In Figure6, the model-predicted SBRs which led to a BiDWGP score of 0.5 are shown as ‘+’.
A discrepancy between the listener-preferred and predicted SBRminis evident: SBRs predicted as the
minimum requirement for 100% speech intelligibility by the BiDWGP metric is clearly lower than those chosen by listeners, especially for ‘News broadcasting’, which differed from the model prediction by 23.1 dB. Interestingly, except for ‘News broadcasting’, the differences between the listener-preferred and predicted SBRs appear to be the same across background sounds. By minimising RMSE across the four scenes (i.e., ‘News broadcasting’ was excluded), it was found that applying a constant gain
of 5.5 dB to the predicted SBRminachieves a SBR level close to level preferred by listeners (RMSE of
0.9 dB). This is illustrated with ‘x’ markers in Figure6.
Football comm. News broadc. Campaign speech Radio drama Radio poetry -15
-10 -5 0 5 10 15 20
SBR (dB)
[image:13.595.153.444.219.416.2]Listener-preferred Predicted Predicted + 5.5 dB
Figure 6.Listener-preferred (circle) SBR and predicted SBRmin(grey cross) for the audio scenes listed
in Table2. Values represented by ‘x’ markers are resulted from applying a constant 5.5 dB gain to the predicted SBRminfor each scene. Error bar indicates 95% confidence interval of the mean.
4.4. Interim Discussion
A group of listeners with normal hearing were instructed to choose their preferred SBR for mixing in five different audio scenes. Listeners’ preferred SBR depends on the accompanying background
sounds. Compared to model-predicted SBRmin, which is the minimum SBR for listeners to be able to
understand all speech information, the listener-preferred SBRs are consistently higher. This suggests that when making a judgement on the optimal SBR level at which to listen, listeners go beyond intelligibility to consider other factors such as listening effort and comfort. Current OIMs are not able to account for this because they focus on intelligibility. When the background sound is noise, music,
other sound effect or their combinations, an extra gain of 5.5 dB added to the model-predicted SBRmin
gets close to the preferred listening level.
For the ‘News broadcasting’ scene, in which speech by a male taker was artificially added as the background, a larger gain of 23 dB is required. Several participants tended to adjust the level of the background competing speech in the scene to as low as possible. According to the model prediction
for this scene, intelligibility is no longer an issue when the SBR is above −7.5 dB (see Figure6).
One possibility is that listeners did not expect a news broadcast to contain prominent competing speech. Or maybe they considered the competing speech to offer little enhancement to a news broadcast.
Informational masking introduced by competing speech could also be important. Unlike energetic masking to intelligibility, which is the consequence of interactions of physical signals acting to the peripheral auditory system, informational masking obstructs auditory identification and discrimination at the late stage of auditory pathway, when a sound is perceived in the presence of other similar
the same language as the foreground speech, a considerable amount of informational masking is induced. Consequently, this requires more effort from the listener to overcome informational masking
than when listening in other backgrounds, which introduce little informational masking [45]. In the
meantime, the listener’s attention is also more likely to be distracted by the background competing speech. Frequent attention switching between different channels may increase the cognitive load of
the listener [46], potentially leading to escalated annoyance arising from the background sound.
For implementation, the optimal SBR suggested by this system for a given scene can be calculated
as the summation of the model-predicted SBRmin in this background and the additional gain ∆,
which aims to compensate for other factors such as listening effort and comfort. Based on the scenes
tested in this experiment,∆=5.5 dB can be applied to background sounds which are free of competing
speech. However, when the background is competing speech, a larger gain is needed—it is found 23 dB for the competing speech by a male talker here. To automate the decision making, one solution could
be to perform automatic sound classification (e.g., [47–49]) to identify whether the background sound
is speech. For cases where this information is known or can be predefined, the knowledge could be stored in the metadata. The system is then able to retrieve this information from the data flow to make a decision. However, if the background contains both speech and non-speech sounds, the intelligibility of the speech content belonging to the background may need to be estimated, in order to quantify its impact to the foreground speech. The more intelligible the background speech is, the greater the
potential for informational masking [50]. Further study is needed to quantify the relationship between
the additional gain and the degree these factors affecting a listener’s preference at the cognitive level.
5. Experiment III: Listening Experience Rating
As a final assessment of the optimal SBR levels derived from Expt. II, a subjective rating task was undertaken to evaluate listening experiences when the audio scenes were created with a variety of
SBR levels. Instead of general audio quality, in this experiment the balance betweenintelligibilityand
sound effectis considered as the major aspect that affect a listener’s experience.
5.1. Stimuli
The same audio content as described in Table2was used. This was to use different listening
cohorts to confirm the validity of the listener-preferred SBRs measured in Expt. II, since the system-suggested SBRs were derived from those values. This also allowed direct comparisons on listening experience provided by the listener-preferred SBRs and the optimal SBRs suggested by
the system. For each of the five audio scenes three excerpts were drawn from Expt. II (Section4.1),
leading to 15 excerpts in total. Within each excerpt, the foreground speech and background sound were
premixed at three constant SBR levels (−9, 0 and 9 dB), and three scene-specific levels: SBRminpredicted
by the BiDWGP metric (SBR0min), the listener-preferred SBR (LP) measured in Section4.3, and the
suggested-optimal SBR (OPT), i.e.,(SBR0min+∆)dB, where∆was 5.5 dB in all scenes except for ‘News
broadcasting’ where∆was set to 23 dB, in order to match the higher listener-preferred level. In total,
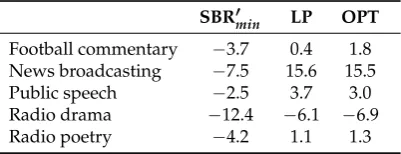
six SBR conditions were evaluated. Table3further details the SBRs yielded by the three scene-specific
[image:14.595.198.399.681.758.2]systems for each audio scene. The intensity of the foreground speech was equalised over all the audio clips; the background level was adjusted accordingly to meet the overall SBR requirements.
Table 3.SBR values (dB) of SBR0min, listener-preferred (LP) and optimal (OPT) in the audio scenes.
SBR0min LP OPT
5.2. Procedure and Listeners
After Expt. II, the audio excerpts were presented to listeners using the same setup as described
in Section4.2. The listening experience rating was conducted on a continuous quality scale ranging
from 0 to 100 [51]. The scale was divided equally into five notches indicating opinions of ‘Bad’, ‘Poor’,
‘Fair’, ‘Good’ and ‘Excellent’ from lower to higher scores. Listeners were instructed to focus on both intelligibility and sound effect. Thus, the judgement on the overall listening experience was expected to be made based on the contributions of the two aspects. The following information was presented to listeners in the beginning of the experiment, in order to make them understand the definition of ‘good listener experience’ in the context of the current experiment.
‘In broadcasts when speech content is presented with background sound, an ideal mixing (i.e., speech-to-background) level usually allows the listener to understand the speech content with little effort, while leading to the well balanced background sound providing good atmosphere to the audio scene. In this experiment, your task is to rate the mixing level that is chosen by a series of systems. The rating will be performed on a scale of 0–100, with a higher score representing better listening experience. Your judgement should take into consideration both speech intelligibility and sound effect in the audio scenes to which you will be exposed.’
The 15 excerpts were randomly presented to the listener via a MATLAB GUI. Each excerpt was presented on one screen. Within the screen, all six systems for that excerpt with different SBR levels were located side-by-side in a row. For each system, an individual vertical slider was used for rating the audio, with dedicated ‘Play’ and ‘Stop’ buttons. The positions of the systems in the row also varied stochastically from one excerpt to the next. Listeners listened to the audio over headphones; they were allowed to listen to each system as many times as necessary. Once the ratings were determined for all the six systems, the listener proceeded to the next excerpt until the end of the experiment.
The rating was performed by twenty-three native British English speakers (ages: 18–34 year, mean age: 24 year) with normal hearing. None of the participant took part in the previous two experiments.
5.3. Results
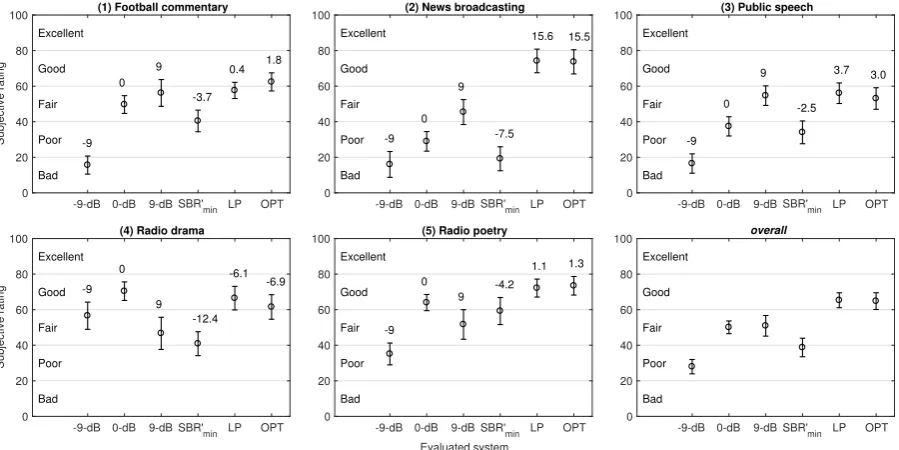
Panels 1–5 of Figure7present the average subjective ratings for listening experience with the
six SBR mixing levels in the five audio scenes. As anticipated, listeners tended to rate LP and OPT similarly in all five scenes; LP and OPT also led to the best listening experiences in almost every scene.
−9-dB and SBR0minwere mostly not rated favourably by listeners. Intriguingly, while listeners also
rated 9-dB higher than 0-dB in the background sounds which are relatively steady (i.e., the ‘Football commentary’ and ‘Public speech’ scenes) or which introduces informational masking (the ‘News broadcasting’ scene), an opposite rating pattern was observed in the background sounds prone to fluctuation (the ‘Radio drama’ and ‘Radio poetry’ scenes). Across all the five scenes, as shown in the
-9-dB 0-dB 9-dB SBR'min LP OPT 0 20 40 60 80 100 Subjective rating
(1) Football commentary
Bad Poor Fair Good Excellent -9 0 9 -3.7
0.4 1.8
-9-dB 0-dB 9-dB SBR'min LP OPT
0 20 40 60 80
100 (2) News broadcasting
Bad Poor Fair Good Excellent -9 0 9 -7.5 15.6 15.5
-9-dB 0-dB 9-dB SBR'min LP OPT
0 20 40 60 80
100 (3) Public speech
Bad Poor Fair Good Excellent -9 0 9 -2.5
3.7 3.0
-9-dB 0-dB 9-dB SBR'min LP OPT
0 20 40 60 80 100 Subjective rating
(4) Radio drama
Bad Poor Fair Good Excellent -9 0 9 -12.4 -6.1 -6.9
-9-dB 0-dB 9-dB SBR'min LP OPT
Evaluated system 0 20 40 60 80
100 (5) Radio poetry
Bad Poor Fair Good Excellent -9 0 9 -4.2
1.1 1.3
-9-dB 0-dB 9-dB SBR'min LP OPT
0 20 40 60 80
100 overall
[image:16.595.75.525.87.312.2]Bad Poor Fair Good Excellent
Figure 7.Subjective rating for listening experience with various mix levels (shown above each data point in dB) in the five audio scenes (panel 1–5). The ‘overall’ panel shows the rating over all the scenes. Error bar indicates 95% confidence interval of the mean.
Significant main effects of scene [F(4, 638) = 27.469,p < 0.001,η2 = 0.258] and system
[F(5, 638) =99.424,p<0.001,η2=0.543] were further revealed by two-way within-subject ANOVA.
The bi-factor interaction was also significant [F(20, 638) =26.199,p<0.001,η2=0.354], supporting
the notion that audio content affects the preferred SBRs. Table4displays the results of post-hoc
pairwise comparisons with Bonferroni correction. It confirms that LP and OPT were rated equally in
all scenes [allp>0.05]. In both the ‘Football commentary’ and ’Public speech’ scenes, 9-dB provided
similar listening experiences to listeners as OPT did [allp>0.05], despite a 7.2-dB and 6-dB difference
between the two systems in the two scenes respectively. On the other hand, there was no significant difference in listening experience when the ’Radio drama’ and ‘Radio poetry’ scenes were produced
using 0-dB or OPT (−6.9 and 1.3 dB in the two aforementioned scenes, respectively) [allp >0.05].
Nevertheless, scenes with OPT led to better listening experiences than with other mixing levels
[allp < 0.01], except for−9-dB in ‘Radio drama’ scene [p = 0.89]. When comparing LP to other
systems (apart from OPT) in all the scenes, the results are consistent to OPT, except for ‘Football commentary’ where LP was rated same as 0-dB. Overall, listeners rated both LP and OPT as the best
Table 4.Significance level of post-hoc pairwise comparison with Bonferroni correction between subjective ratings on SBRs shown in Figure7. Codes ‘*’, ‘**’ and ‘***’ indicatepvalue<0.05,<0.01 and<0.001, respectively.pvalues are supplied for insignificant comparisons.
(1) Football commentary
0-dB 9-dB SBR0min LP OPT
−9-dB *** *** *** *** *** 0-dB 0.85 0.10 0.30 ** 9-dB *** 1.00 1.00 SBR0min *** ***
LP 1.00
(2) News broadcasting
0-dB 9-dB SBR0min LP OPT
−9-dB ** *** 1.00 *** *** 0-dB *** 0.08 *** *** 9-dB *** *** *** SBR0min *** ***
LP 1.00
(3) Public speech
0-dB 9-dB SBR0min LP OPT
−9-dB *** *** *** *** *** 0-dB *** 1.00 *** *** 9-dB *** 1.00 1.00 SBR0min *** ***
LP 1.00
(4) Radio drama
0-dB 9-dB SBR0min LP OPT
−9-dB ** 0.12 *** 0.12 0.89 0-dB *** *** 1.00 0.26 9-dB 1.00 *** ** SBR0min *** ***
LP 1.00
(5) Radio poetry
0-dB 9-dB SBR0min LP OPT
−9-dB *** *** *** *** *** 0-dB ** 1.00 0.26 0.09 9-dB 0.41 *** *** SBR0min ** ***
LP 1.00
overall
0-dB 9-dB SBR0min LP OPT
−9-dB *** *** *** *** *** 0-dB 1.00 *** *** *** 9-dB *** *** *** SBR0min *** ***
5.4. Interim Discussion
In contrast to Expt. II, in which subjects specified the SBR that they felt was most appropriate, in this last experiment listeners were asked to rate their experience resulted from different SBR levels, including those favourable levels observed in the previous experiment. For the constant SBRs, listeners tended to rate 9-dB higher than 0-dB in relatively steady backgrounds (crowds in ‘Football commentary’
and babble noise in ‘Public speech’), in which energetic masking is strong [13]. This could be because
0-dB is too close to the SBRmin, which is the measured threshold for perceiving all the speech content.
Understanding speech at this level requires more listening effort from the listeners [52], leading to
degraded listening experience. An opposite pattern was observed for 0-dB and 9-dB in the presence of fluctuating backgrounds (music or sound effects in ‘Radio drama’ and ‘Radio poetry’). Given the
predicted SBR0minof−12.4 dB for ‘Radio drama’ and−4.2 ‘Radio poetry’, this evidently is no longer
due to the issues of intelligibility or listening effort. It is likely that listeners thought that 9-dB BSR led to considerably low background sounds, hence the lack of atmosphere for the scenes. In the two scenes,
9-dB was merely rated as the same as SBR0min. This is a clear demonstration of the importance of
the balance between speech intelligibility and background sounds to listener listening experience. However, this explanation may not apply to ‘News broadcasting’—the competing speech in the background induces more negative effects (e.g., informational masking and attention switching) than other backgrounds tested here, which mostly only introduce pure energetic masking. This has already
been discussed in Section4.4.
One would naturally expect that the listening experience with the listener-preferred level should be rated higher than other levels. However, while LP and OPT indeed led to better listening experience in most of the scenes, listeners also thought that some other levels may provide similar experiences although there was a difference of up to 8.6 dB (e.g., between LP and 9-dB in the ‘Football commentary’ and ‘Public speech’ scene, and between LP and 0-dB in the ‘Radio drama’
scene). This may be a reflection of the diversity of listener’s opinion on the optimal SBR level for mixing—while some listeners enjoy louder background sounds that may create better atmosphere in the scene, others perhaps prefer a quieter background that results in better intelligibility with less listening effort used in understanding the target speech. Furthermore, such listener variability in
preference suggests that using a reference system to compare candidates to, as in e.g., [19], may be
inappropriate, leading to biased opinions of listeners.
6. Conclusions
By using an objective intelligibility metric (BiDWGP) as a perceptual guide, an approach is proposed to automate the selection of speech-to-background ratio in broadcast audio scenes. When a desired mixing level is predefined for a scene, this method is able to automatically validate whether a minimal intelligibility requirement is satisfied. It can also estimate the lowest mixing
level (SBRmin) needed to meet the intelligibility requirement. In addition, an optimal SBR can be
estimated by applying an extra gain to the estimated SBRmin, to get a mix that not only maintains
speech intelligibility but also considers other aspects of listener preference such as auditory comfort. Three perceptual listening experiments were conducted. In Expt. I, we investigated the target objective intelligibility score, which resulted from the minimum SBR level that listeners require to fully understand the speech content in a given background masker. When using each model
prediction to estimate SBRmin, the chosen BiDWGP metric yields the smallest errors compared to four
state-of-the-art OIMs.
In Expt. II, listener-preferred SBR levels for mixing in five different audio scenes were measured.
This showed that a gain needs to be applied to the model-predicted SBRminto get the preferred SBR.
However, further study is required to quantify the relationship between the additional gain and the degree of those factors affecting a listener’s preference for competing speech.
Expt. III was conducted to finally evaluate listening experiences in the audio scenes created using different mixing levels, including three constant and three scene-specific SBRs. The subjects ratings suggest that the SBR based on BiDWGP prediction with an additional gain derived from the measured listener-preferred SBRs in Expt. II, can provide the same good balance between speech intelligibility and background sound effects as the measured do, for the audio scenes tested in this study. Despite the optimal SBRs being acquired from fitting to the measured values, the ratings from different listeners—who were not involved in the measurement of the listener-preferred SBRs—confirmed the validity of the system-suggested SBRs.
For automatic decision making, automatic sound tagging could be a solution to identify the background sound. The system can then apply appropriate additional gains to the scene. In critical situations, such as live broadcasts, voice-over-IP, and adaptive systems for the hearing-impaired listeners, such a system could maintain high levels of speech intelligibility and listening comfort, improving the listening experience. Further study may extend the proposed system by suggesting the optimal SBRs with respect to other factors, such as room acoustics and ambient noise in the listening environment, which may also degrade speech intelligibility.
Acknowledgments:This work was supported by the EPSRC Programme Grant S3A: Future Spatial Audio for an Immersive Listener Experience at Home (EP/L000539/1) and the BBC as part of the BBC Audio Research Partnership. The authors would like to thank Huw Swanborough for conducting the listening experiments and for useful discussions. The experimental data underlying the findings are fully available without restriction, details are available fromhttps://dx.doi.org/10.17866/rd.salford.5598082. Due to copyright restrictions, the radio drama material used in the listening experiments is not available from this link.
Author Contributions: Yan Tang designed all the experiments and composed the manuscript. All authors contributed to the discussions on the work and the editing of the manuscript, and approved the final manuscript.
Conflicts of Interest:The authors declare no conflict of interest.
References
1. Cohen, D. Sound Matters. BBC College of Production Web Site. Available online:http://www.bbc.co.uk/ academy/production/article/art20130702112136134(accessed on 9 September 2015).
2. van Wijngaarden, S.J.; Steeneken, H.J.M.; Houtgast, T. Quantifying the intelligibility of speech in noise for non-native talkers. J. Acoust. Soc. Am.2002,112, 3004–3013.
3. Appropriate Sound Levels for TV—Music, Dialogue, etc. Available online:https://forums.creativecow.net/ thread/8/982763(accessed on 2 April 2016).
4. Armstrong, M.; Brown, A.; Crabb, M.; Hughes, C.J.; Jones, R.; Sandford, J.Understanding the Diverse Needs of Subtitle Users in a Rapidly Evolving Media Landscape; BBC Research & Development White Paper WHP 307; BBC: London, UK, 2015.
5. Hirsh, I.J. The relation between localization and intelligibility. J. Acoust. Soc. Am.1950,22, 196.
6. Dirks, D.D.; Wilson, R.H. The effect of spatially separated sound sources on speech intelligibility. J. Speech Hear. Res.1969,12, 5–38.
7. MacKeith, N.W.; Coles, R.R.A. Binaural advantages in hearing of speech. J. Laryngol. Otol.1971,85, 213–232. 8. Hawley, M.L.; Litovsky, R.Y.; Colburn, H.S. Speech intelligibility and localization in a multi-source
environment. J. Acoust. Soc. Am.1999,105, 3436–3448.
9. Tang, Y.; Cooke, M.; Fazenda, B.M.; Cox, T.J. A glimpse-based approach for predicting binaural intelligibility with single and multiple maskers in anechoic conditions. In Proceedings of the Sixteenth Annual Conference of the International Speech Communication Association, Dresden, Germany, 6–10 September 2015; pp. 2568–2572.
11. Festen, J.M. Speech-perception threshold in a fluctuating background sound and its possible relation to temporal resolution. InThe Psychophysics of Speech Perception; Martinus Nijhoff: Dordrecht, The Netherlands, 1987; pp. 461–466.
12. Middelweerd, M.J.; Festen, J.M.; Plomp, R. Difficulties with speech intelligibility in noise in spite of a normal pure-tone audiogram.Audiology1990,29, 1–7.
13. Festen, J.; Plomp, R. Effects of fluctuating noise and interfering speech on the speech-reception threshold for impaired and normal hearing. J. Acoust. Soc. Am.1990,88, 1725–1736.
14. Bronkhorst, A.W.; Plomp, R. Effect of multiple speechlike maskers on binaural speech recognition in normal and impaired hearing.J. Acoust. Soc. Am.1992,92, 3132–3139.
15. ter Keurs, M.; Festen, J.M.; Plomp, R. Limited resolution of spectral contrast and hearing loss for speech in noise.J. Acoust. Soc. Am.1993,94, 1307–1314.
16. Brungart, D.S. Informational and energetic masking effects in the perception of two simultaneous talkers.
J. Acoust. Soc. Am.2001,109, 1101–1109.
17. Brungart, D.S.; Simpson, B.D.; Ericson, M.A.; Scott, K.R. Informational and energetic masking effects in the perception of multiple simultaneous talkers.J. Acoust. Soc. Am.2001,110, 2527–2538.
18. Shirley, B.; Oldfield, R. Clean audio for TV broadcast: An object-based approach for hearing-impaired viewers.J. Audio Eng. Soc.2015,63, 245–256.
19. Paulus, J.; Herre, J.; Murtaza, A.; Terentiv, L.; Fuchs, H.; Disch, S.; Ridderbusch, F. MPEG-D spatial audio object coding for dialogue enhancement (SAOC-DE). In Proceedings of the Audio Engineering Society Convention 138, Warsaw, Poland, 7–10 May 2015.
20. ANSI S3.5-1997 Methods for the Calculation of the Speech Intelligibility Index; ANSI: Washington, DC, USA, 1997. 21. IEC. Part 16: Objective rating of speech intelligibility by speech transmission index. InIEC 60268 Sound
System Equipment, 4th ed.; International Electrotechnical Commission: Geneva, Switzerland, 2011.
22. Rhebergen, K.S.; Versfeld, N.J. A Speech Intelligibility Index-based approach to predict the speech reception threshold for sentences in fluctuating noise for normal-hearing listeners.J. Acoust. Soc. Am.2005,117, 2181. 23. Taal, C.; Hendriks, R.; Heusdens, R.; Jensen, J. A short-time objective intelligibility measure for time-frequency weighted noisy speech. In Proceedings of the 2010 IEEE International Conference on Acoustics Speech and Signal Processing (ICASSP), Dallas, TX, USA, 14–19 March 2010; pp. 4214–4217.
24. Tang, Y. Speech Intelligibility Enhancement and Glimpse-Based Intelligibility Models for Known Noise Conditions. Ph.D. Thesis, Universidad del País Vasco, Vitoria-Gasteiz, Spain, 2014.
25. Zurek, P.M. Binaural advantages and directional effects in speech intelligibility. InAcoustical Factors Affecting Hearing Aid Performance; Allyn and Bacon: Needham Heights, MA, USA, 1993; pp. 255–276.
26. van Wijngaarden, S.J.; Drullman, R. Binaural intelligibility prediction based on the speech transmission index.J. Acoust. Soc. Am.2008,123, 4514–4523.
27. Andersen, A.H.; de Haan, J.M.; Tan, Z.H.; Jensen, J. A binaural short time objective intelligibility measure for noisy and enhanced Speech. In Proceedings of the Sixteenth Annual Conference of the International Speech Communication Association, Dresden, Germany, 6–10 September 2015; pp. 2563–2567.
28. Tang, Y.; Cooke, M.P.; Fazenda, B.M.; Cox, T.J. A metric for predicting binaural speech intelligibility in stationary noise and competing speech maskers. J. Acoust. Soc. Am.2016,140, 1858–1870.
29. Sauert, B.; Vary, P. Recursive closed-form optimization of spectral audio power allocation for near end listening enhancement. In Proceedings of the ITG-Fachtagung Sprachkommunikation, Bochum, Germany, 6–8 October 2010.
30. Tang, Y.; Cooke, M. Optimised spectral weightings for noise-dependent speech intelligibility enhancement. In Proceedings of the Thirteenth Annual Conference of the International Speech Communication Association, Portland, OR, USA, 9–13 September 2012; pp. 955–958.
31. Taal, C.; Hendriks, R.C.; Heusdens, R. Speech energy redistribution for intelligibility improvement in noise based on a perceptual distortion measure.Comput. Speech Lang.2014,28, 858–872.
32. Müsch, H. Aging and sound perception: Desirable characteristics of entertainment audio for the elderly. In Proceedings of the Audio Engineering Society Convention 125, San Francisco, CA, USA, 2–5 October 2008. 33. Ma, J.; Hu, Y.; Loizou, P.C. Objective measures for predicting speech intelligibility in noisy conditions based
on new band-importance functions. J. Acoust. Soc. Am.2009,125, 3387–3405.
35. Cooke, M.P.; Mayo, C.; Valentini-Botinhao, C.; Stylianou, Y.; Sauert, B.; Tang, Y. Evaluating the intelligibility benefit of speech modifications in known noise conditions. Speech Commun.2013,55, 572–585.
36. University College London; Cambridge University; Edinburgh University; the Speech Research Unit and the National Physical Laboratory. SCRIBE—Spoken Corpus of British English. Available online:
http://www.phon.ucl.ac.uk/resource/scribe(accessed on 19 October 2009).
37. Bradlow, A.R.; Torretta, G.M.; Pisoni, D.B. Intelligibility of normal speech I: Global and fine-grained acoustic-phonetic talker characteristics. Speech Commun.1996,20, 255–272.
38. Markham, D.; Hazan, V. The effect of talker- and listener-related factors on intelligibility for a real-word, open-set perception test. J. Speech Lang. Hear. Res.2004,47, 725–737.
39. Culling, J.F.; Colburn, H.S. Binaural sluggishness in the perception of tone sequences and speech in noise.
J. Acoust. Soc. Am.2000,107, 517–527.
40. Miller, G. The masking of speech.Psychol. Bull.1947,44, 105–129.
41. Pollack, I. Auditory informational masking. J. Acoust. Soc. Am.1975,57, S5.
42. Neff, D. Signal properties that reduce masking by simultaneous random-frequency maskers. J. Acoust. Soc. Am.1995,96, 1909–1921.
43. Kidd, G., Jr.; Mason, C.R.; Richards, V.M.; Gallun, F.J.; Durlach, N.I. Informational masking. InAuditory Perception of Sound Sources; Springer: Berlin/Heidelberg, Germany, 2008; pp. 143–189.
44. Kidd, G., Jr.; Colburn, H.S. Informational masking in speech recognition. InThe Auditory System at the Cocktail Party; Springer: Berlin/Heidelberg, Germany, 2017; pp. 75–109.
45. Koelewijn, T.; Zekveld, A.A.; Festen, J.M.; Kramer, S.E. Pupil dilation uncovers extra listening effort in the presence of an interfering speaker.Ear Hear.2012,33, 291–300.
46. Fritz, J.B.; Elhilali, M.; David, S.V.; Shamma, S.A. Auditory attention—Focusing the searchlight on sound.
Curr. Opin. Neurobiol.2007,17, 437–455.
47. Büchler, M.; Allegro, S.; Launer, S.; Dillier, N. Sound classification in hearing aids inspired by auditory scene analysis. EURASIP J. Adv. Signal Process.2005,2005, 387845.
48. Deng, H.; O’Shaughnessy, D. Voiced-unvoiced-silence speech sound classification based on unsupervised learning. In Proceedings of the 2007 IEEE International Conference on Multimedia and Expo, Beijing, China, 2–5 July 2007; pp. 546–548.
49. Fleury, A.; Noury, N.; Vacher, M.; Glasson, H.; Seri, J.F. Sound and speech detection and classification in a Health Smart Home. In Proceedings of the 30th Annual International Conference of the IEEE Engineering in Medicine and Biology Society (EMBS), Vancouver, BC, Canada, 20–25 August 2008; pp. 4644–4647. 50. Freyman, R.L.; Balakrishnan, U.; Helfer, K.S. Effect of number of masking talkers and auditory priming on
informational masking in speech recognition. J. Acoust. Soc. Am.2004,115, 2246–2256.
51. International Telecommunication Union. ITU-R BS.1534-3: Method for the Subjective Assessment of Intermediate Quality Level of Coding Systems; International Telecommunication Union: Geneva, Switzerland, 2015. 52. Picou, E.M.; Gordon, J.; Ricketts, T.A. The effects of noise and reverberation on listening effort for adults
with normal hearing.Ear Hear.2016,37, 1–13. c