2019 2nd International Conference on Informatics, Control and Automation (ICA 2019) ISBN: 978-1-60595-637-4
Performance Analysis of Underwater Wireless Sensor Networks
Based on Deep Routing
Jun HAN
1,2,*, Shu-fang ZHANG
1,2, Bo HU
1and Jia YOU
11School of Mechanical and Electronic Engineering, Suzhou University, Suzhou, China
2Research Center of Coal Mine Machinery and Electronic Engineering, Suzhou University, Suzhou, China
*Corresponding author
Keywords: Deep routing protocol, End-to-end delay, Energy consumption, Underwater wireless sensor network.
Abstract. Underwater wireless sensor networks communicate through acoustic signals. In UWSNs, deep routing protocols are used as special routing algorithms to transmit data to controlled flows. How to balance power consumption and end-to-end delay is an urgent problem to be solved for deep routing protocols. Based on the deep routing protocol, this paper establishes the expected energy consumption and end-to-end delay mathematical model to evaluate the performance of the underwater wireless sensor network. Through the analysis of expected energy consumption and end-to-end delay, the expected energy consumption and end-to-end delayed weighting cost function expressions are given. The expressions can effectively evaluate the performance of underwater wireless sensor network parameters and can be used as the basis of optimization configuration for parameter designing.
Introduction
Underwater Wireless Sensor Networks (UWSNs) is an underwater self-organizing network composed of sensor nodes. The underwater data is collected by sensor nodes, transmitted to the sink nodes, and then transmitted through wireless RF signals to complete information collection and fusion processing, which are widely used in many fields such as hydrological monitoring, marine exploration, navigation and marine military[1,2].UWSNs communicate by acoustics, and the transmission speed of underwater acoustic signals is 1500m/s. Acoustic communication has the advantages of long distance coverage, low energy and less interference, while terrestrial wireless RF sensor networks mostly communicate by radio frequency, which makes the difference between them[3]. During to the high mobility caused by water flow in UWSNs network nodes, some severe limitations are imposed on available bandwidth and transmission delay. The transmission delay is much higher than that of terrestrial radio frequency sensing networks, so those evaluation methods it is mostly used for terrestrial RF network performance cannot be directly applied to UWSNs.
exhaust energy quickly. How to balance power consumption and end-to-end delay is an urgent problem to be solved by the DBR protocol[5-6].
In this paper, the mathematical model of the influence of transmission power on the total energy consumption and end-to-end delay of UWSNs is proposed. The mathematical model of the depth position of the forwarding node is obtained by finding the limit of the forwarding node density function and the expected density, and the limit of the probability and expected density of the non-forwarding node is obtained. The expected distance function covered by the forwarding node transmission is obtained, and the unit distance expected energy consumption, end-to-end delay and its weighted cost function expression are established. The expression is suitable for studying the optimal power transmission under UWSNs network conditions.
Deep Routing Protocol
Depth Based Routing (DBR) is an opportunistic routing protocol defined by UWSNs. The method is simple. The goal of the DBR protocol is to send any part of the network to the floating sonar buoy. The algorithm based on holding time is inherited from the vehicle network designing, that is, each forwarding node which receives the data packet to be forwarded has a waiting time, and the waiting time is inversely proportional to the depth difference between two adjacent forwarding nodes [7].
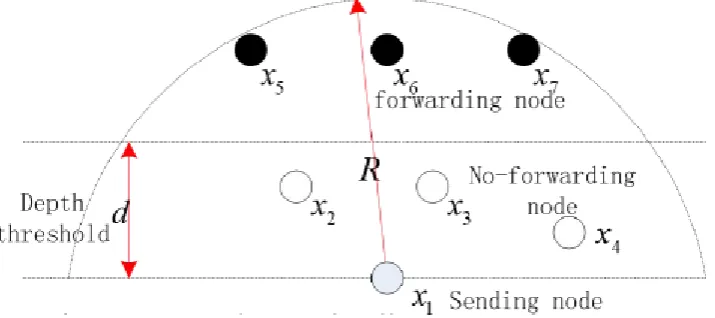
[image:2.595.119.477.499.658.2]As shown in Fig.1, assuming the sending node x1Node duing to limited transmission radiusx1,the data packet transmitted by cannot directly reach the surface of the sonar buoy, and the data packet contains the depth of nodex1, each node receiving it can correctly calculate the different depth from node x1 .One of the configuration parameters of the protocol is the depth threshold.dEach node whose depth difference is less than the depth threshold is not a qualified forwarding node, such as node x2 ,x3 ,x4 ;The depth difference between node x5 ,x6 ,x7 and nodex1Depth is greater than the depth thresholdd,nodex5,x6,x7are qualified forwarding nodes. The depth threshold is used to prevent short-range communication, but in some cases it can also be assumed to be negative or 0, so that all nodes with a lower depth than the transmitting node are qualified forwarding nodes to avoid question related to the local minimum of the network topology[8].
Figure 1. Schematic diagram of DBR forwarding node transmission.
Each forwarding node calculates a delay time that is inversely proportional to the depth difference, that is, the waiting time. The node keeps the data packet in its queue during the waiting time. If the packet is retransmitted during this period, the queue is cancelled. Otherwise, The packet will be forwarded when the waiting time expires. Ideally, the node closest to the sending node can be selected as a forwarding node in a distributed manner to avoid packet collisions and redundant transmissions. The waiting time works in an ideal way, the node with a depth difference of d will
act as a forwarding node if and only if two constraints are met:
(2) all nodes fromx i
1
cannot receive the packet.In the transmission diagram of Fig.1, if and only if the node x6 Correctly receives data packet sending byx1, butx5andx7are failed to Receive data packet, nodex6is the forwarding node.
Multi-hop protocol model with directional antenna
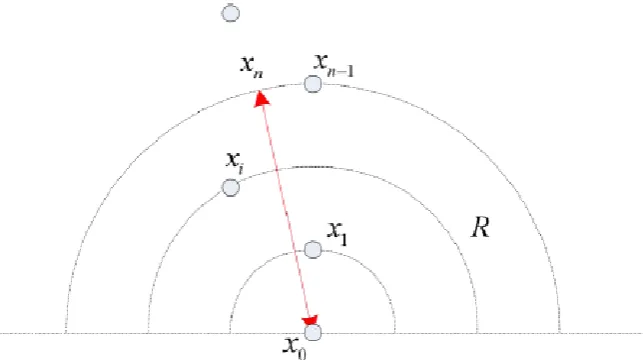
[image:3.595.141.463.225.405.2]Forwarding Node Location Model. Referring to Fig.2, a schematic diagram of a directional antenna multi-hop protocol model, a sending nodex0transmits the data packet in a certain direction. According to the convention of the Deep Routing Protocol[9], there are n potential forwarding nodes in the radius R range, and the position of the forwarding node in the sending direction is independent and evenly distributed.
Figure 2. Schematic diagram of directional antenna multi-hop protocol model.
AssumingXi
indicates a random variable of the distance fromx0To the first node, where1 i n,
i
XReal interval
0,R
Probability density function corresponding to the Beta distributionp.d.f .for:
1 1 1 n i iX i n
n x R x
f x n
i R
(1) x represents the distance between nodexiandx0,under the condition of R andn Under the condition, the expected density of the forwarding node can be obtained.:
lim n R n R
(2)
is the number of expected nodes per unit distance in the network, for the Eq.1
.Seeking the
limit, duing to
! lim 1 ! i i n nn i n x
,
lim 1
n x n x e
n , Depth location model of forwarding nodes
in the network can be determined with a probability density of,the iForwarding node location
p.d.f .given by the above Eq.3.
1
1 ! i x i
X i e x f x i
(3)
Non-forwarding Node Probability Model. The node whose distance isxcan successfully receives the data packet sending by nodex0The probability is
x
byx0The probability of sending a packet is:
ypf y expe
(4)
All the above nodes, the probability o failing to receive data packet sending by x0 is:
1
1 1 n R y R x s y e e
pf y e dx
R y R y
(5) Taking the limit of Eq. 5:
lim 1
n R y n R e e pf y R y (6)
Bring the Expected Density Eq.2 into Eq. 6:
1lim 1 n n y n e
pf y e
y
n y n
n
(7)
The probability of FirstiForwarding node Pi is:
0
x i X i
P
f x e pf x dx(8) duing toE X i
i, the desired distance covered by the forwarding node transmissionLis:
0
1
1 1
log i
i iP e
L E
(9)among them, 0.577216is the Euler constant, 1
1 t x
E x e dx
t
[image:4.595.54.538.73.479.2]
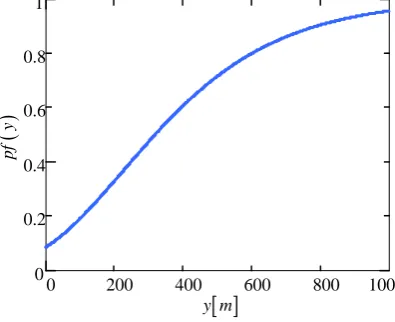
is an exponential integral function.Fig.3 shows that in UWSNs with a node density of 10 nodes/km, the maximum distance covered by the forwarding node for receiving packets is 1000m. 0.01Node /m, 1 / 300, greater than the depth thresholddAll nodes cannot receive The probability curve of the transmitted by node x0.
0 200 400 600 800 1000
0 0.2 0.4 0.6 0.8 1 y m pf y
Figure 3. Non-forwarding node probability curve.
Performance Analysis
[image:4.595.198.396.556.717.2]depth thresholdd,the probability of sending a packet is d
e ,the larger the parameter,the shorter the corresponding the desired transmission distance. The forwarding node transmission energy consumption model isThe function is as follows:
1En G
(10)
Among themGIs a normalization constant,It is an environmental factor parameter such as node depth, salinity, and expansion factor. In UWSNs, the transmission power is consumed by the spreading and attenuation of the signal, and the spreading factor is lower than that of the terrestrial network, value is between 1 and 2.
The expected energy consumption per unit distance is:
En l
Cons l =L (11)
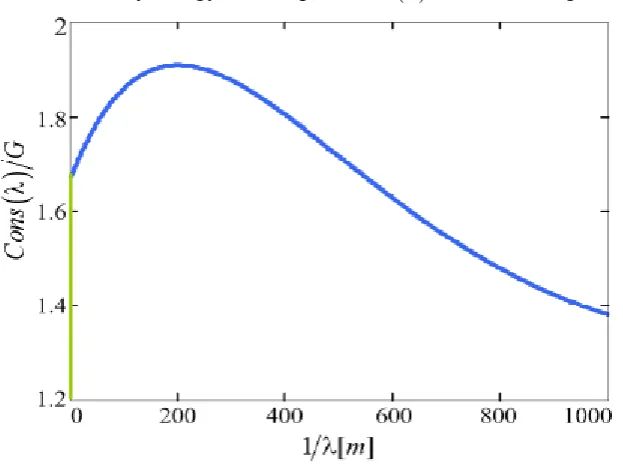
[image:5.595.144.456.316.548.2]For 1, in WhenCons
Approaching 0, in 0WhenCons
Approaches. Fig.4 gives 1.5, the expected energy consumption per unit distanceCons
/GThe graph, as can be seen from Fig.4 1 / 200nearby energy consumptionCons
/G there is a great value.Figure 4. Unit distance expected energy consumption graph.
End-to-end Delay Analysis. To measure the speed at which packets are forwarded in the network, which is determined by measuring the expected time that the packet covers the unit distance. When no eligible forwarding node correctly receives data packet sending byx0, it must be
resent and reset the waiting time].Suppose t is the time required for packet transmission, and the expected expectation of the packet being successfully forwarded Time
for:
T TimeL
(12) Fig.5 shows in the case of 1.5 the unit distance expected time curve, as expected, through the curve can be derivedlimTime
Figure 5. Graph of the expected distance per unit distance.
Numerical Optimization. Energy consumption is not the only requirement for UWSNs, and the issue of end-to-end latency must also be considered. Short-range transmission requires that the data packet be sent multiple times to obtain correct reception. The DBR protocol uses a multi-hop mechanism that needs to be forwarded or retransmitted when the waiting time expires, so the power saving and end-to-end delay are weighed. From the perspective of saving energy consumption, it is more convenient to use short-distance transmission, but to minimize end-to-end delay, using maximize power transfer. Through linear combination Cons
with Time
, The cost function is obtained :
Cost a Con b Time (13)
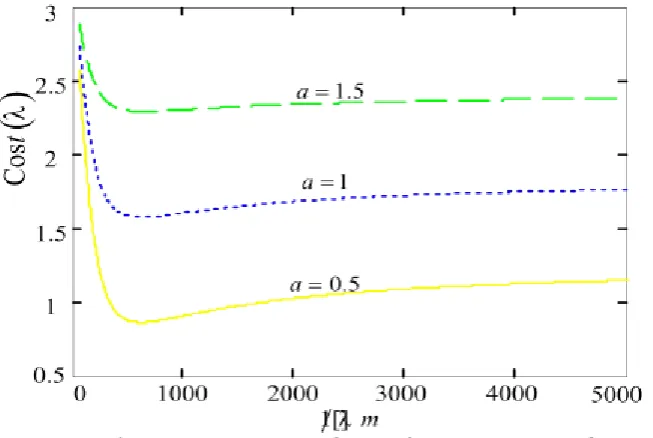
Among them aand b for a constant greater than or equal to 0, since the underwater acoustic signal propagates in an underwater environment at a speed close to 1500 m/s, 2 s is taken as the sum of the hold time and the transmission time. Fig.6 is a graph of the cost function, where
1 / 300m, G1000, T2s, aTakes 0.5, 1, and 1.5, respectively.b1. Although the minimum value of the cost function can be obtained in Fig. 6, the number of nodes corresponding to the cost function at the minimum value cannot be determined.
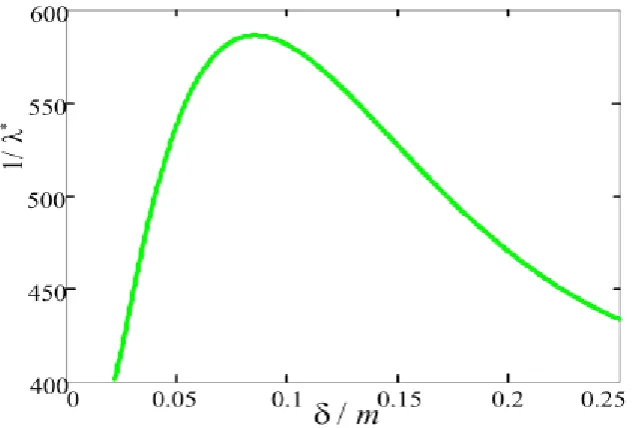
[image:6.595.136.463.548.767.2]The following functions are established by the relationship between the node density and the optimal transmission range:
arg min Cost
[image:7.595.139.458.186.400.2] (14)
Fig.7 shows the relationship graph of the node densityand optimal transmission range1 /, for relatively low node density tending to repeat short-distance transmission, which relies on redundant transmission to transmit data packets. For the optimal transmission power there is a maximum near 0.1, and the protocol can achieve good performance at low energy.
Figure 7. Versus Relation graph rate.
Conclusion
Based on the deep routing protocol, this paper establishes the expected energy consumption and end-to-end delay mathematical model based on the forwarding node location model, the non-forwarding node probability model, and the forwarding node expected transmission distance model, through the expected energy consumption and end-to-end delay mathematics. Model to evaluate the performance of underwater wireless sensor networks. The expected energy consumption and end-to-end delay are analyzed. The specific expressions of expected energy consumption per unit distance, end-to-end delay and its weighted cost function are given. The above expressions can effectively evaluate the performance of underwater wireless sensor network parameters, which can be used as the basis of the parameter optimization configuration design of underwater wireless sensor network, the basis is suitable for studying the optimal power transmission under UWSNs network conditions.
Acknowledgement
The work is supported by the Nature Science Research Project of Suzhou University under Grant (2016YZD09, 2014XJZY33, 2014XQNRL013, 2014zy074) , the Research in major science and technology Foundation of Anhui Province Grant (18030901023),and Educational Cooperation and Education Project of the Ministry of Education(201802048024).
References
[2] Wang Ji, Lin Jiehua, Xie Shiyi, The Environment Monitoring System Based on Wireless Sensor Network, Chinese Journal of Sensors and Actuators. 28(2015)1732-1740.
[3] Zhang Hong-jun, ZHhang Ya-li. Hybrid routing protocol based on depth adjustment in underwater wireless sensor networks, Computer Engineering and Design. 31(2016)2898-2903.
[4] Lan Sheng-lin, Du Xiu-juan, Liu Fan, Feng Zhen-xing, Level-based adaptive geo-routing for underwater sensor network, Application Research of Computers. 31(2014)236-238.
[5] Xie Wei-jia, Liu Jian-ming, He Ye, Li Long. Depth Based Directional Routing Protocol in Underwater Sensor Networks, Microelectronics & Computer. 32(2015)40-45.
[6] Pan Yong-dong, Depth-based suppressing void routing optimal algorithm in UWSNs, Transducer and Microsystem Technologies. 36(2017)139-142.
[7] Nan Shupo, Feng Naiqin. Opportunistic Routing for Underwater Wireless Sensor Network Based on Depth and Reliable Link, Computer Engineering. 44(2018)79-83.
[8] Huang Hai-jun, Sun Shi-yun, Zhang Ren-mi, Depth Adjustment Based Void Avoidance Routing in UWSNs, Instrument Technique and Sensor. 18(2017)117-121.