R E S E A R C H A R T I C L E
Open Access
Pain drawings in somatoform-functional pain
Niklaus Egloff
1*, Rafael JA Cámara
1, Roland von Känel
1, Nicole Klingler
1, Elizabeth Marti
2and Marie-Louise Gander Ferrari
1Abstract
Background:Pain drawings are a diagnostic adjunct to history taking, clinical examinations, and biomedical tests in evaluating pain. We hypothesized that somatoform-functional pain, is mirrored in distinctive graphic patterns of pain drawings. Our aim was to identify the most sensitive and specific graphic criteria as a tool to help identifying somatoform-functional pain.
Methods:We compared 62 patients with somatoform-functional pain with a control group of 49 patients with somatic-nociceptive pain type. All patients were asked to mark their pain on a pre-printed body diagram. An investigator, blinded with regard to the patients’diagnoses, analyzed the drawings according to a set of numeric or binary criteria.
Results:We identified 13 drawing criteria pointing with significance to a somatoform-functional pain disorder (all p-values≤0.001). The most specific and most sensitive criteria combination for detecting somatoform-functional pain included the totalnumber of marks, thelength of the longest mark,and the presence ofsymmetric patterns. The area under the ROC-curve was 96.3% for this criteria combination.
Conclusion:Pain drawings are an easy-to-administer supplementary technique which helps to identify somatoform-functional pain in comparison to somatic-nociceptive pain.
Keywords:Chronic pain, Functional pain syndromes, Pain drawing, Somatoform pain disorder
Background
Pain drawings (PDs) are widely used to record subjec-tive pain symptoms. In addition to good history taking, physical examinations, and results of biomedical tests, they can support to differentiate several types of local pain syndromes, such as chronic low back pain [1,2], chronic shoulder pain [3], neurogenic pain [4], and headaches [5].
Instead of focusing on any particular anatomical site,
we concentrated on a particularpain type: We examined
patients whose complaints could not be explained by ei-ther a peripheral structural or a neuropathic lesion. In psychiatric terms, the latter complaints are traditionally referred to as ‘somatoform pain’, whereas somatic medi-cine prefers the term ‘functional pain’ (e.g. functional pain syndromes). In the following, we will use the term
somatoform-functional painto describe this entire group of pain disorders.
Our aim was to identify those particular graphic cri-teria which specifically help to differentiate between somatoform-functional pain and somatic-nociceptive
pain. More specifically, we wanted to find out which
combination of features in a drawing has the best pre-dictive value (sensitivity and specificity) to identify somatoform-functional pain. Based on the arguments of Margolis et al.,we strictly applied quantitative methods of picture analysis and avoided any qualitative or experience-based interpretations of pictures or signs [6].
Methods
Setting, design, and patients
We compared two groups of inpatients at a tertiary
uni-versity hospital: one with somatoform-functional pain,
the other with unequivocalsomatic-nociceptive pain. We selected all patients solely according to these two pain types, but other basic characteristics were also noted. * Correspondence:[email protected]
1Division of Psychosomatic Medicine, Department of General Internal
Medicine, Inselspital, Bern University Hospital and University of Bern, Bern, Switzerland
Full list of author information is available at the end of the article
Patients withsomatoform-functionalpain were recruited
from themedical psychosomaticdepartment. The defining
eligibility criterion was a pain without an explanatory morphologic correlate. Such a correlate was excluded by standard clinical, serological and radiological methods.
Patients with somatic-nociceptive pain were recruited
from the orthopedic department. Only patients with a
clear peripheral correlate, verified by standard clinical and technical diagnostic methods (i.e. X-ray, MRI or CT), were included from this department. Patients with pain of neuropathic origin (e.g. diabetic neuropathy, spinal canal stenosis, discopathia), cancer-related pain and those with inflammatory pain (e.g., rheumatoid arth-ritis) were not included in this pilot study.
In both departments the treating specialists made diagnoses according to the usual Western standards and diagnostic classification systems (ICD-10, DSM-IV).
To assess depressive mood we used the depression subscale of the Hospital Anxiety and Depression Scale (HADS-D) [7,8]. To limit potential confounding of somatic-nociceptive pain by overt psychological factors, we excluded patients from the orthopedic department who endorsed a comorbid psychiatric disorder.
The patients were individually instructed by the inves-tigator to mark all painful body areas with a red pencil on a letter-sized body diagram. The used body diagram shows four views of the whole body: frontal view, rear view, right and left lateral views (size: 105 mm from neck to sole). Additionally, there are enlarged views of the head, the neck, and the distal extremities. Patients
were not given any instructions on how to apply the
pencil (e.g. hatched or solidly filled areas), nor were they advised about the use of particular signs (e.g. circles, crosses, or arrows).
The study protocol has been approved by the local ethical committee and all patients provided written informed consent.
Definition of pain drawing criteria
The evaluation of all PDs was carried out by only one in-vestigator. He was blinded with regard to the pain diag-nosis and the department’s origin of the patients. The inventory of the drawings is based on their graphic fea-tures only. We strictly renounced any interpretive cri-teria (e.g. “not corresponding to anatomic structures”). The criteria included objective aspects only, e.g. theform (lines, hatches, circles, and rectangles) and the orienta-tion(e.g. horizontal lines, symmetrical distribution). We took theposition with regard to the template border(i.e. lines following the contour of the body scheme, or marks exceeding the border of the body scheme) into Flowchart
62 patients from the
medical-psychosomatic department
84 patients from the
orthopedic department
62 patients with somatoform-functional
and 49 with somatic-nociceptive pain were analyzed. All patients fulfilled the
eligibility criteria.
29 patients were excluded because of
psychiatric comorbidity.
6 patients because of neuropathic pain
[image:2.595.56.290.89.253.2](5x spinalcanalstenosis,1x discopathia)
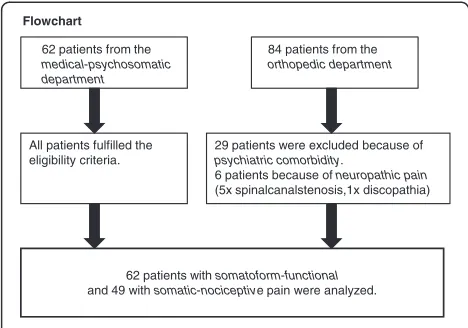
Figure 1Flow-chart of patients selected for analysis.This figure illustrates the recruitment process.
Table 1 Health characteristics of 111 pain patients according to diagnostic groups
Variable Somatoform-functional
pain (n = 62)
Somatic-nociceptive pain (n = 49)
P-value
Age (years) 47±12 (20–75) 55±17 (16–84) 0.005
Female sex (%) 62.9 34.7 0.003
Pain duration (months) 99±115 (3–451) 17±24 (0.1-100) <0.001
Pain level (NRS) 6.4±2.2 (1–10) 3.5±1.4 (1–7) <0.001
Depressive disorder (%) 87.1 0 <0.001
Anxiety disorder (%)1) 35.5 0 <0.001
Opioids (%) (includes Tramadol) 30.2 6.1 <0.001
NSAIDs (%) (includes Paracetamol and Metamizol) 50.0 93.3 0.001
Antidepressants (%) 85.5 0 <0.001
Antiepileptics (%) 24.2 0 <0.001
1) includes PTSD.
NSAIDs= non-steroidal anti-inflammatory drugs;NRS= numerical rating scale.
[image:2.595.57.540.536.700.2]account. In addition, we consideredquantitative criteria (i.e. number of marked quadrants, number of pain regions, and number of different marks) as well as the sizeof the marks (i.e. longest mark). Overall, our evalu-ation included a comprehensive panel of 24 graphic cri-teria (cf. below).
Data analysis
We compared the pain groups in terms of health charac-teristics and pain drawing marks. In the latter
compari-son we distinguished between frequentmarks, occurring
in at least 25% of the patients in one of the pain groups,
and rare marks. The frequency of category-type
state-ments was expressed in percentages, whereas the mean ± standard deviation (SD) was used for continuous variables. P-values for differences of PDs in the two pain groups
were computed by Mann–Whitney U test and Pearson
chi-square test or Fisher’s exact test where appropriate. Significance level was set as 0.001 with Bonferroni correc-tions for 24 comparisons. Furthermore, two multivariate logistic regression analyses were performed for frequent marks with respect to control variables: One basic model
(analysis 1) adjusted only for age and gender, a second
(analysis 2) additionally forother characteristic group dif-ferences. Principally, all covariates were tested which might co-influence the drawings of the two different pain groups (e.g. age, gender, pain duration, pain severity, as well as mood). Ninety-five % confidence intervals were calculated for all odds ratios.
[image:3.595.59.539.324.701.2]Finally, in order to identify the combination of criteria with the highest selectivity (i.e. sensitivity and specifi-city), we used receiver operating characteristic (ROC) curves: In a first step, we identified the criterion with the highest selectivity out of all significant frequent
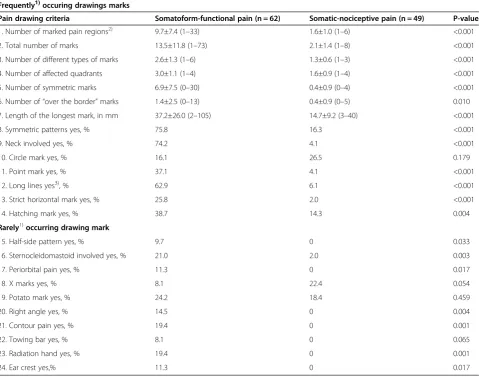
Table 2 Pain drawing criteria according to diagnostic groups
Frequently1)occuring drawings marks
Pain drawing criteria Somatoform-functional pain (n = 62) Somatic-nociceptive pain (n = 49) P-value
1. Number of marked pain regions2) 9.7±7.4 (1–33) 1.6±1.0 (1–6) <0.001
2. Total number of marks 13.5±11.8 (1–73) 2.1±1.4 (1–8) <0.001
3. Number of different types of marks 2.6±1.3 (1–6) 1.3±0.6 (1–3) <0.001
4. Number of affected quadrants 3.0±1.1 (1–4) 1.6±0.9 (1–4) <0.001
5. Number of symmetric marks 6.9±7.5 (0–30) 0.4±0.9 (0–4) <0.001
6. Number of“over the border”marks 1.4±2.5 (0–13) 0.4±0.9 (0–5) 0.010
7. Length of the longest mark, in mm 37.2±26.0 (2–105) 14.7±9.2 (3–40) <0.001
8. Symmetric patterns yes, % 75.8 16.3 <0.001
9. Neck involved yes, % 74.2 4.1 <0.001
10. Circle mark yes, % 16.1 26.5 0.179
11. Point mark yes, % 37.1 4.1 <0.001
12. Long lines yes3), % 62.9 6.1 <0.001
13. Strict horizontal mark yes, % 25.8 2.0 <0.001
14. Hatching mark yes, % 38.7 14.3 0.004
Rarely1)occurring drawing mark
15. Half-side pattern yes, % 9.7 0 0.033
16. Sternocleidomastoid involved yes, % 21.0 2.0 0.003
17. Periorbital pain yes, % 11.3 0 0.017
18. X marks yes, % 8.1 22.4 0.054
19. Potato mark yes, % 24.2 18.4 0.459
20. Right angle yes, % 14.5 0 0.004
21. Contour pain yes, % 19.4 0 0.001
22. Towing bar yes, % 8.1 0 0.065
23. Radiation hand yes, % 19.4 0 0.001
24. Ear crest yes,% 11.3 0 0.017
1) Marks referred to as“frequently occurring“appeared in≥25% of cases in one of the two groups. Marks referred to as“rarely occurring“appeared in less than 25% of cases in both groups.
Table 3 Odds ratio ofFrequentdrawing criteria in somatoform-functional vs. somatic-nociceptive pain on logistic regression
Pain drawing criteria Analysis 1 Analysis 2
Adjusted for age and gender Adjusted for age, gender, pain duration, pain severity and mood
OR 95% CI OR 95% CI
1. Number of marked pain regions 2.39 1.59-3.60 4.64 1.64-13.1
2. Total number of marks 1.84 1.37-2.48 4.42 1.61-12.13
3. Number of different types of marks 3.93 2.08-7.44 3.65 1.27-10.54
4. Number of affected quadrants 3.74 2.22-6.27 3.97 1.62-9.72
5. Number of symmetric marks 2.66 1.61-4.40 3.49 1.48-8.26
6. Number of“over the border”marks 1.50 1.03-2.18 1.72 0.95-3.10
7. Length of the longest mark, mm 1.57 1.25-1.98 1.52 1.07-2.16
8. Symmetric patterns yes, % 19.6 6.46-59.38 21.94 3.59-134.11
9. Neck involved yes, % 53.95 11.29-257.78 140.4 7.80-2527.29
10. Circle mark yes, % 0.56 0.21-1.55 0.31 0.05-1.77
11. Point mark yes, % 12.32 2.55-59.53 9.46 0.76-118.02
12. Long lines yes, % 22.99 6.12-86.39 16.94 2.22-129.38
13. Strict horizontal lines yes, % 0.074 0.01-0.62 0.08 0.00-1.71
14. Hatching mark yes, % 3.72 1.33-10.42 8.66 1.56-48.14
Explanations for models adjusted for age and gender:
Forcategoricalvariables (yes, no) odds ratios indicate the following: if e.g. criterion no.11 (point mark) was present, the odds of a patient suffering from somatoform pain was 12-fold higher than suffering from somatic pain.
Forcontinuousvariables odds ratios indicate the following: e.g. for one additional mark (e.g. criterion no. 2) the odds of the patient suffering from somatoform pain as opposed to somatic pain was increased by factor 1.84.
Criterion no.7 (longest mark) was measured in 5 mm steps: For every increase of the length of the longest mark by 5 mm, the odds of the patient suffering from somatoform as opposed to somatic pain was increased by factor 1.57.
Bold figures: pain drawing criteria with OR > 3.
a
b
c
d
e
n
f
o
g
g
h
i
j
k l
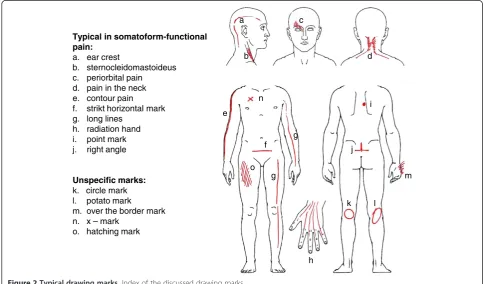
m Typical in somatoform-functional
pain: a. ear crest
b. sternocleidomastoideus c. periorbital pain
d. pain in the neck e. contour pain f. strikt horizontal mark g. long lines
h. radiation hand i. point mark j. right angle
Unspecific marks: k. circle mark l. potato mark
m. over the border mark n. x – mark
o. hatching mark
[image:4.595.55.542.441.725.2]criteria. In a second step, we identified those criteria which added the most to the selectivity of the first crite-rion. To achieve this, the first criterion was separately modeled (i.e. two variables per model) with each of the other frequent criteria by binary logistic regression. Pairs of criteria which both contributed to the model were combined with the natural logarithm (ln) of the equation of the model. For instance, if the odds ratio was 2 for criterion A and 3 for criterion B, the score would be ln2 times criterion A plus ln3 times criterion B. This method allows to quantify the additive predictive value of multiple criteria. The most sensitive and specific com-binationwas again analyzed by ROC-curve analysis. The two best matching criteria of this second combination were afterwards modeled once more by binary logistic regression, this time with a third criterion, in order to fi-nally identify the most appropriate triple-combination.
Results
Description of the patients
The flowchart (Figure 1) describes the selection of the 62 (56%) patients with somatoform-functional pain and
the 49 (44%) patients with somatic-nociceptive pain. Of the orthopedic group, 6 patients were excluded because of neuropathic pain syndrome and 29 because of psychi-atric comorbidity.
Among the patients from the medical-psychosomatic
department, chronic functional somatic syndromes
included fibromyalgia (n = 14), chronic tension headache (n = 4), chronic temporomandibular pain (n = 1), atypical facial pain (n = 1), chronic back pain (n = 16), functional abdominal pain or chronic pelvic pain (n = 8). Other patients suffered from inexplicable pain of the trunk (n = 8), pain-related functional hemi-syndromes (n = 6), inexplicable chronic postsurgical pain (n = 1), chronic shoulder/arm pain (6), and chronic cervico/thoracic pain (n = 11).
Among the patients from the orthopedic department,
acute traumatic pain included traumas of the upper extremities or shoulders (n = 11), bone fractures or joint lesions of the lower extremities (n = 15), thoracic, vertebral or pelvic traumas (n = 7). Degenerative osteo-arthritic pain included hip arthritis (n = 9), knee arthritis (n = 9), degenerative shoulder pain (n = 5), and dege-nerative low back pain (n = 7).
a b c
[image:5.595.60.541.368.702.2]d e 3f f h
Sixteen patients with somatoform-functional and 13 patients with somatic-nociceptive pain had more than one diagnosis for their pain type.
Further patient characteristics are shown in Table 1 together with p-values for group differences.
Description of pain drawings
Thirteen of the 24 analyzed graphic criteria displayed differences of the p-values≤0.001. Eleven of these cri-teria werefrequent (= occurred >25% in one of the two pain groups), cf. Table 2.
[image:6.595.58.540.88.435.2]In the first multivariate analysis, Analysis 1 adjusted forageand gender, 7 of the frequent criteria had an OR > 3 (range 3.72–53.95). In the second multivariate ana-lysis, Analysis 2 adjusted forage, gender, pain duration, pain severityand mood, 10 criteria had an OR > 3 (range 3.49–140.4), cf. Table 3.
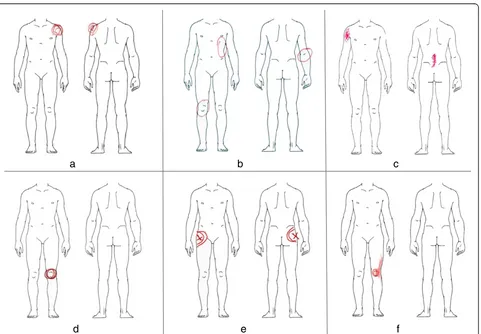
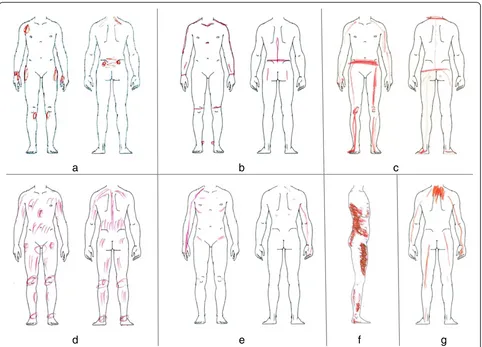
Figure 2 gives a graphic index of the investigated PD marks. A selection of representative examples of somatic-nociceptive and somatoform-functional PDs is illustrated with Figures 3 and 4.
Most sensitive and specific combination
The most equilibratedcriteria combinationto
differenti-ate between the two types of pain included the total
number of marks, the length of the longest mark, and presence versus absence of symmetric patterns (statistic calculations are shown in Tables 4 and 5). This means
that PDs with a greater numberof marks, typically with
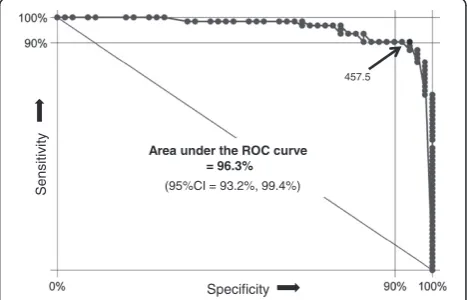
symmetric patterns and long marks, are most likely of somatoform-functional origin. The area under the
ROC-a
b
c
d
e
f
g
Figure 4Typical PDs from patients with somatoform-functional pain.Picturea-gshow pain drawings of patients witha-gmedically inexplicable pain syndromes. Somatoform-functional pain is typically associated with symmetric patterns, long lines, and a higher number of marks.
Table 4 Binary logistic regression of the most sensitive and specific combination of pain drawing criteria Pain drawing criteria OR/unit
(95% CI)
Log likelihood
p-value
Total number of marks 1.7 (1.3, 2.3) - 25 < 0.001
Length of the longest mark 1.1 (1.0, 1.1) 0.029
Symmetric patterns (yes/no) 6.5 (1.6, 26.9) 0.010
[image:6.595.305.539.635.700.2]curve for this triple criteria combination was 96.3% (Figure 5).
Furthermore, the effective predicting score value of an individual drawing could be computed by using the
fol-lowing score formula: 55 × the total number of marks,
plus32.5×for each five-mm of the longest mark, plus an
additional amount of 187 if symmetric patterns are
present. For instance, a pain drawing with 8 marks, in which the extension of the longest mark is 25 mm, in-cluding symmetric patterns, yields a score value of 788. With a score of≥779.5, the positive predictive value for a somatoform-functional pain would be nearly 100% (95%CI: 91.8%, 100%). Sixty-nine percent of our patients
with somatoform-functional pain scored≥779.5 (69.3%,
95%CI: 56.3%, 80.4%). The cut-off of 457.5 represents
the mathematically optimal combination of sensitivity
(90.3%; 95%CI: 80.1%, 96.4%) and specificity(93.9%; 95% CI: 83.1%, 98.7%) to discern somatoform-functional from somatic-nociceptive pain. This cut-off would still yield a positive predictive value of 94.9% for the probability of somatoform-functionalpain (95%CI: 85.8%, 98.9%). Con-versely, a score < 457.5 would generate a probability of somatic-nociceptivepain of 88.5% (95%CI: 76.6%, 95.6%).
Discussion
This study is an approach to a better implementation of PDs as one tool in the diagnostic assessment of somatoform-functional pain syndromes. PDs of patients withsomatoform-functional pain differ significantly with respect to a defined spectrum of graphic features. The frequency and the stereotypical appearance of these pat-terns procure a suitable tool for diagnostic purposes. The greatest power to identify somatoform-functional pain resulted in our study from the combination of the number of marks, length of the longest mark, and
pres-ence versus absence of symmetric patterns. The area
under the ROC-curve for this triple criteria combination is more than 95% (Figure 5). Assuming that the percent-age of our cohort of pain patients with somatoform-functional pain (56%) is representative for the pain population assessed in a tertiary pain center, 91.9% of these patients would be correctly classified by these three pain drawing criteria alone (95%CI: 85.2%, 96.2%). The prevalence of some drawing criteria was highly dif-ferent between the two pain populations (e.g., neck in-volvement, symmetric patterns; Table 2). This difference
mathematically explains why some of the odds ratios are unusually high (Table 3). Clearly, the absolute values of these odds ratios should not be overinterpreted but may underscore the observation that some of the pain draw-ing criteria are vastly different between the two groups of pain patients.
The two patient groups also differed vastly in terms of their basic characteristics (Table 1). This was expected because somatoform-functional pain shows known asso-ciations with for instance female gender and increased pain duration. In addition, more than 80% of our somatoform-functional pain patients suffered from cli-nical depression. It is generally known that somatoform-functional pain disorders are frequently associated with psychiatric disorders. Excluding patients with somatoform-functional pain with a concurrent psychiatric comorbi-dity would have yielded a clinically less representative sample. Nevertheless, their PDs should not be used as a psychodiagnostictest in disguise [9]. There are more use-ful tests available for specific psychodiagnostic screening purposes [10]. Our opinion is that the graphic patterns in somatoform-functional pain disorders illustrate several pain specific perceptional aspects. By definition, the indicated pain areas reflect, in contrast to the somatic-Table 5 ROC-formula of the best combination of pain drawing criteria
Formula to compute the score Mean ± SD (Range) OR/SD (95% CI) Log likelihood p-value
55 points multiplied with the total number of marks plus 748 ± 700 (81 4397) 1114 (62, 20’132) - 25 < 0.001
32.2 points multiplied with the length of the longest mark plus
187 points if symmetric patterns are present
This table shows the properties of the best pain drawing criteria after combining them to one single continuous variable. The combination to one variable is necessary to obtain one single receiver operating characteristic curve including the diagnostic properties of all three criteria.
Area under the ROC curve = 96.3%
(95%CI = 93.2%, 99.4%)
457.5
Specificity
Sensitiv
ity
[image:7.595.305.539.486.636.2]nociceptive pain, no injuries. The signs in somatorm-functional pain disorders may have diverse other causes. In the following, we will discuss some possible explana-tions illustrated with PDs.
Inexplicable functional pain syndromes are often asso-ciated with generalized hyperalgesia [11-13]. In such a case, even the perception of normal postural tone (Figure 4f ), the force in muscle insertions (Figure 4a), or the weight exerted on joints (Figures 4b, 4c) is amplified and results in a painful sensation. This generalized hyperalgesia of the musculoskeletal system could also explain the high number as well as the symmetrical dis-tribution of the patients’complaints. Other graphic pat-terns are indicative of increased local muscle tension [14]. Obviously, the neck is an area of predilection for stress-associated muscular pain (Figure 2a, 2d): 75% of our patients suffering from somatoform-functional pain indicate in their PDs neck pain. Finally, another subtype of somatoform-functional pain can be found in patients suffering from severe posttraumatic stress disorder. Their initial physical pain related to the trauma often seems to leave an irreversible imprint on their body
scheme which persists for years in some sort of “
mem-ory pain” [15,16] (Figure 4g: patient with
whiplash-associated PTSD 10 years ago).
To conclude, we think that pain drawings of patients with somatoform-functional pain could hint at their cryptic and almost unknown pathophysiology. Generally, we recommend the PD-method as a helpful diagnostic adjunct in the assessment of any complex pain problems. Specially, the identification of patients with somatoform-functional pain is difficult and often related to frustrat-ing diagnostic detours. An early identification of somatoform-functional pain is of clinical importance: Whereas treatment of somatic-nociceptive pain relies on analgesics (according to WHO criteria), the therapy of somatoform-functional pain considers dual antidepres-sants with analgesic properties alone or in combination with other modalities of multimodal pain treatment [17]. In this study we excluded orthopedic patients with a psychiatric comorbidity as well as pain patients with
bothsomatoform-functional pain and somatic-nociceptive
pain. When assessing PDs in clinical routine, however, one should keep in mind that the individual patient may also present with combinations of different pain types. Generally, we would not advise the use of PDs to rule out somatic-nociceptive pain, but recommend them as a positive indicator to identify somatoform-functional complaints.
We emphasize several limitations of our pilot study. Since we did not include any patients with neuropathic pain, tumor pain, or inflammatory rheumatic diseases, we cannot make any statement about the above men-tioned criteria with regard to these patient groups.
Because of more multilocular or widespread pain
ori-gins, these pain groups might show a closer overlap in their PDs with somatoform-functional pain syndromes than the classic orthopedic pain patients. For further dif-ferentiations more investigations are essential. Although we controlled for important demographic and clinical covariates, we are unable to exclude the possibility that factors other than the type of pain (e.g., the different clinical setting) might have contributed to differences in PD. Assessment of PD with only one rater does not allow to draw conclusions about the interrater reliability of PD.
Conclusion
To sum up, PDs are an easy-to-administer technique helping the clinician to detect somatoform-functional pain in comparison with somatic-nociceptive orthopedic pain. Clinical experience shows that many patients do appreciate this personalized and documentative style as one means of the diagnostic approach.
Abbrevations
(HADS-D): Hospital Anxiety and Depression Scale; (PDs): Pain drawings; (ROC): Receiver operating characteristic; (SD): Curves, standard deviation.
Competing interests
The authors have no competing interests to report. All authors declare no financial or other relationships that might lead to a competing interest.
Authors’contributions
NE and MLG are responsible for the whole clinical concept and examinations, and RvK and RC for the study design and the statistical analyses. NE and RvK supervised the study on a medical-methodological level. NK, MLG and EM performed the clinical tests. All authors participated substantially in the acquisition or the analyses of the data. All co-authors were involved in drafting or revising the manuscript and have approved its final version.
Prior presentations
All authors confirm that the manuscript has not been published elsewhere.
Acknowledgments
The authors thank Annette Kocher and Jean Pierre Geri for their editorial assistance. All authors declare no financial or other relationships that might lead to a conflict of interest.
Author details
1Division of Psychosomatic Medicine, Department of General Internal
Medicine, Inselspital, Bern University Hospital and University of Bern, Bern, Switzerland.2Department of General Internal Medicine and Department of Orthopedic Surgery, Bern University Hospital and University of Bern, CH-3010 Bern, Switzerland.
Received: 19 April 2012 Accepted: 17 December 2012 Published: 20 December 2012
References
1. Mann NH, Brown MD, Hertz DB, Enger I, Tompkins J:Initial-impression diagnosis using Low-back pain patient pain drawing.Spine1993,
18:41–53.
3. Toomingas A:Characteristics of pain drawings in the neck-shoulder region among the working population.Int Arch Occup Env Health1999,
72:98–106.
4. Bertilson B, Grunnesjö M, Johansson SE, Strender LE:Pain drawing in the assessment of neurogenic pain and dysfunction in the neck/shoulder region: inter-examiner reliability and concordance with clinical examination.Pain Med2007,8(2):134–146.
5. Broadbent E, Niederhoffer K, Hague T, Corter A, Reynolds L:Headache sufferers‘drawings reflect distress, disability and illness.J Psychosom Res
2009,66:465–470.
6. Margolis RB, Tait RC, Krause SJ:A rating system for use with patient pain drawings.Pain1986,24:56–65.
7. Bjelland I, Dahl AA, Haug TT, Neckelmann D:The validity of the hospital anxiety and depression scale. An updated literature review.J Psychosom Res2002,52(2):69–77.
8. Herrmann C, Kaminsky B, Rüger U, Kreuzer H:Praktikabilität und klinische relevanz eines routinemässigen psychologischen screenings von patienten internistischer allgemeinstationen.Psychother Psychosom Med Psychol1999,49:48–54.
9. Greenough CG, Fraser RD:Comparison of eight psychometric instruments in unselected patients with back pain.Spine1991,16(9):1068–1074. 10. Carnes D, Ashby D, Underwood M:A systematic review of pain drawing
literature- should pain drawings Be used for psychologic screening? Clin J Pain2006,22(5):449–457.
11. Yunus MB:Central sensitivity syndromes: a New paradigm and group nosology for fibromyalgia and overlapping conditions, and the related issue of disease versus illness.Semin Arthritis Rheum2008,37:339–352. 12. Banic B, Petersen-Felix S, Andersen OK, Radanov BP, Villiger PM,
Arendt-Nielsen L, Curatolo M:Evidence for spinal cord hypersensitivity in chronic pain after whiplash injury and in fibromyalgia.Pain2004,
107:7–15.
13. Egloff N, von Känel R:Kommentar zu faustregel 7.Praxis2010,99:26–28. 14. Richter P, Hebgen R:Triggerpunkte und muskelfunktionskettenbuch, 2. Auflage.
Stuttgart: Hypokrates Verlag; 2007.
15. Walter S, Leissner N, Jerg-Bretzke L, Hrabal V, Traue HC:Pain and emotional processing in psychological trauma.Psychiatr Danub2010,22(3):465–470. 16. Egloff N, Hirschi A, von Känel R:Schmerzstörungen bei traumatisierten–
neurophysiologische aspekte und klinische phänomenologie.Praxis2012,
101(2):87–97.
17. Clauw DJ:Fibromyalgia: an overview.Am J Med2009,122(12):3–13.
doi:10.1186/1471-2474-13-257
Cite this article as:Egloffet al.:Pain drawings in somatoform-functional pain.BMC Musculoskeletal Disorders201213:257.
Submit your next manuscript to BioMed Central and take full advantage of:
• Convenient online submission
• Thorough peer review
• No space constraints or color figure charges
• Immediate publication on acceptance
• Inclusion in PubMed, CAS, Scopus and Google Scholar
• Research which is freely available for redistribution