2018 2nd International Conference on Modeling, Simulation and Optimization Technologies and Applications (MSOTA 2018) ISBN: 978-1-60595-594-0
Value Analysis and Research in the Field of Mobile Communication
Qian ZHU, Sui-xiang GAO, Jing WANG and Yi-xin GENG
*University of Chinese Academy of Sciences, Beijing, China
*Corresponding author
Keywords: Multiple data source, High value, Machine learning, Classification algorithm.
Abstract. With the popularization of smart devices, the demand for mobile communication is increasing. The pursuit of stronger signals and faster transmission rates make effective value assessment and rational allocation of resources more important. In this paper, mobile communication value assessment problem is converted into base station classification problem with data, the high-value base station densely distributed area is the high-value mobile communication area. We have given a new value partitioning solution based on machine learning classification model, and on the real test set has achieved far better than the traditional method.
Introduction
Due to the rapid development of LTE mobile communication technology, we can meet the mobile communication needs of more regions through technology upgrades. However, as the needs of users continue to increase, how to prioritize the communication needs of high-value regions, and to provide higher bandwidth and faster transmission rates for high-value regions has become our current consideration [1].
Analysis and research on the value of communication will be applied to all aspects of our lives. Firstly, the analysis and research of value areas will help us to further optimize the allocation of mobile communication resources. High-value areas consider resource load balancing, and low-value areas consider resource redistribution. Secondly, at this stage, China's 4G technology has basically achieved regional coverage. According to the introduction in IMT-2020 5G Trials in China [2], we will be able to achieve 5G network construction in 2020. In the process of 4G to 5G, some high-value areas will be given priority. The need to establish 5G base stations is becoming more and more urgent, allowing high-value areas to prioritize the use of higher bandwidth, and faster transmission rates are what we are currently considering. Using the analysis and research of the value area to identify high-value areas and prioritize the establishment of 5G base stations, it also has guiding significance for site planning in the field of 5G mobile communication.
In this paper, we propose a new scheme for analyzing and researching the value of mobile communications. By analyzing the antenna data of the base station and the measurement report data of the base station, the problem of the mobile communication value of the area is converted into the value of the base station, the useful key features are extracted, and the binary classification model is established by using the related classification algorithm of machine learning. Therefore, the high and low value of the base station is scientifically and effectively divided, and the areas where the high-value base stations are densely distributed are considered to be high-value areas. Through the importance feedback of the different characteristic data indicators of the base station in the classification model, the importance ranking of different features is given, and the analysis of the value of mobile communication is guided.
Related Works
high-value community in the whole network, and then form a value area through the relevant combination of valuable communities to guide network construction and network optimization [3]. In addition, from the perspective of the user, the user value of the mobile network user is analyzed, and the distribution area of the high-value user is extracted through the analysis of the user behavior of the mobile communication user, the user habit, and the geographic feature data of the user using the service. Effectively configure network resources for these areas to achieve accurate resource delivery [4]. However, these two solutions mainly rely on the field experience to artificially select features and determine thresholds. There are many uncertainties, which are greatly influenced by human factors, and cannot give a common solution. It is difficult to divide the fuzzy areas where the data of some indicators are not much different.
At present, researchers in related fields have benefited from the fiery development of machine learning technology, and have begun to study the application and practice of machine learning algorithms in the field of mobile communication value research [5]. This paper also fits this trend and has certain contributions in the construction of classification algorithms, parameter tuning, and model evaluation.
Data Set
The data set we currently have is mainly divided into two parts, base station antenna data and base station measurement report data. These data are real data of 4G base stations in Beijing obtained from
China Mobile Communications Group Beijing Branch., Ltd (CMCC_BJ), which is reliable and
persuasive. By selecting the base station identification cell_id in both data as the unique key value, we merge two pieces of data to obtain a two-dimensional data set.
In the low-value base station marking, finding the base station data that it's scene_type feature is the mountain, river, village, suburb, suburban road and cemetery, marking its label as 0, which is low value, this part of the base station data has 14,242.
In the high-value base station marking, we currently use a combination of two plan:
Plan A: CMCC_BJ gave a list of base stations for thematic analysis. These base stations are very valuable areas currently evaluated by CMCC_BJ, but the amount of data is insufficient.
Plan B: The POI(points of interest) in Beijing are downloaded from the public dataset. Although these latitude and longitude coordinate points are not required for the mobile communication field, they have a certain regional representation and can play a role in assisting the marking of high-value base stations. We select representative important application scenarios, such as POI coordinate points of shopping malls, hospitals, schools, tourist attractions, etc. Base stations within 100 meters of POI coordinate points are marked as high-value base stations.
Through the comprehensive analysis of the above two plans, the base station data label is marked as 1, which is high value, and this part of the base station data has 78,432.
In the subsequent model building process, in order to facilitate the model evaluation, the data set with 92,674 data will be cross-validated for 7:3 segmentation, that is, 70% of the data will be randomly selected for model training, and the rest 30% of the data is used for model validation.
Data Preprocessing
Data preprocessing is the most important step before the model is established. The quality of data preprocessing directly affects the final classification effect. Experience: Data quality determines the upper bound of the final result, while model and parameter tuning is just as close as possible to the upper bound.
Horizontal_angle, Vertical_angle, Send_power, M_vertical_angle, E_vertical_angle and etc. Categorical features include Branch, Cell_type, Band_type, Manufacturer and etc.
For metric features, we use the following method to process the data [6]:
a)Missing value processing: manually padding missing values, filling in missing values with global constants, using attribute center metrics, using attribute mean or median of all samples of the same class as a given tuple attribute, filling in missing values with the most likely values , use other features to predict missing feature values.
b)Outlier processing: removes outliers by setting some thresholds
c)Data normalization: data is mapped between [0, 1] by linear transformation of the original data.
min max min * x
x . (1)
Where max is the maximum value of the feature sample data, and min is the minimum.
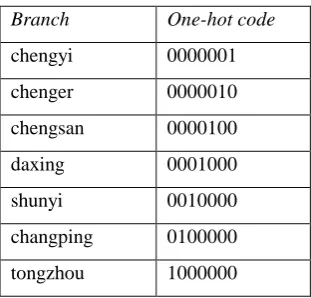
[image:3.595.220.376.319.468.2]For categorical features, we use one-hot encoding to process [7], using N status bits to represent N different categories of this feature, ensuring that only 1 bit of a single feature in each sample is in state 1, and the others are all zeros. For example, the Branch feature is processed as follows:
Table 1. One-hot encoding.
Branch One-hot code
chengyi 0000001
chenger 0000010
chengsan 0000100
daxing 0001000
shunyi 0010000
changping 0100000
tongzhou 1000000
Other categorical features are also treated in the same way.
Feature Selection
Feature selection is also a very important step before the model is established. Effective feature selection can reduce the feature dimension, make the model generalization ability stronger, reduce over-fitting, and enhance the understanding between features and eigenvalues.
Considering the characteristics of the data set, the main feature selection methods used in this paper are [8]:
a)Removing features with low variance: Suppose that the feature value of a feature is only 0 and 1, and in all input samples, 95% of the instances have a value of 1 for this feature, then it can be considered that this feature is not very effective. If 100% is 1, then this feature is meaningless.
b) Removing features with high relevant: Calculate the correlation between each feature, here mainly uses Pearson Correlation:
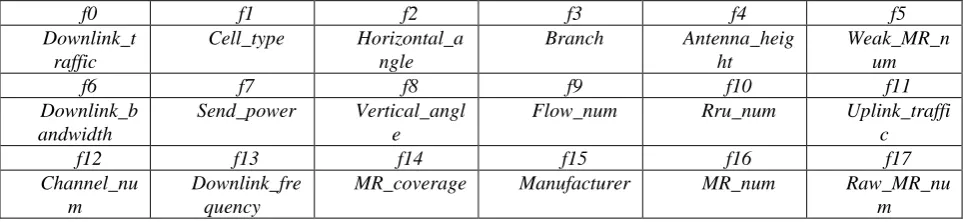
Table 2. The features of base station data.
f0 f1 f2 f3 f4 f5
Downlink_t raffic
Cell_type Horizontal_a ngle
Branch Antenna_heig ht
Weak_MR_n um
f6 f7 f8 f9 f10 f11
Downlink_b andwidth
Send_power Vertical_angl e
Flow_num Rru_num Uplink_traffi c
f12 f13 f14 f15 f16 f17
Channel_nu m
Downlink_fre quency
MR_coverage Manufacturer MR_num Raw_MR_nu m
Model Description
In the process of model building, we tried to use LR (logical regression), SVM (support vector machine), Decision Tree, Random Forest, GBDT and XGBoost algorithms in machine learning. Through the analysis of the performance of various classification model models and the application of the situation, the GBDT and XGBoost algorithms were finally selected to solve this problem.
GBDT(Gradient Boosting Decision Tree), was first proposed by Friedman J H in the paper Greedy
function approximation: A gradient boosting machine [9], which is widely used in the industry
because of its outstanding performance in the field of classification. In our paper, its model F is defined as the addition model:
T t T t t t t tth x w f x w
w x F 0 0 ) ; ( ) ; ( ) ;
( (3)
Where x is the input sample, h is the classification regression tree, w is the parameter of the classification regression tree, and is the weight of each tree. Solving the optimal model by minimizing the loss function, which uses the gradient descent method.
N
i
i
i F x w
y L F 0 * )) ; ( , ( min
arg (4)
In the classification algorithm, GBDT has many characteristics due to its unique nature, which can flexibly process various data, including continuous values and discrete values. In the case of relatively few parameter tuning, the prediction accuracy can also be very high. The robustness to outliers is also very strong, but there are dependencies between weak learners, it is difficult to train data in parallel, So, the emergence of XGBoost solves the problem of training speed.
XGBoost was originally an improved version of the GBDT algorithm proposed by T Chen [10]. Explicitly, the tree model complexity is added to the optimization target as a regular term. The second-order Taylor expansion is used in the formula derivation, and the split-point finding approximation algorithm is implemented. Later model verification can also be seen that XGBoost is superior to GBDT in model training time and model accuracy.
ni t i t
t i i t constant f x f y y l Obj 1 ) 1 ( ^ ) ( ) ( )) ( ,
( (5)
T
j j
t T w
f 1 2
2 1 )
( (6)
Parameter Tuning
In this part, we use the GridSearchCV method to adjust the parameters of the two models of GBDT and XGBoost respectively [11]. The main idea is: assume that the model has N parameters, first adjust it for a certain parameter, let it be in a certain range. Constantly changing, fixing the remaining N-1 parameters to the default values, using the model's AUC value to evaluate the parameter adjustment, find the optimal parameters, then fix the N-2 parameters to the default values, and continue to adjust the second parameter until The AUC value is best by parameter tuning.
Table3 is the optimal parameters of GBDT model parameter adjustment. Table 4 is the optimal parameters of XGBoost model parameter adjustment.
Table 3. GBDT tuning parameters.
n_estimators learning_rate max_depth min_samples_split min_samples_leaf
280 0.2 7 400 40
Table 4. XGBoost tuning parameters
learning_rate n_estimators max_depth min_child_weight gamma
0.1 140 9 1 0.2
reg_alpha subsample seed colsample_bytree n_jobs
0.01 0.7 27 0.8 4
Experimental Results
To assess the performance of the model, we use standard machine learning classification model metrics such as precision, recall, F1 and AUC values [12].The closer all values are to 1, the better the classification effect.
The precision is the percentage of high-value base stations predicted by the model that predict correctly (actually high-value base stations). Recall refers to the proportion of the actual high-value base stations that are correctly predicted (predicted as high-value base stations). F1 is the harmonic mean of the accuracy rate and the recall rate. It is a comprehensive evaluation indicator and is defined as follows:
Recall Precision
Recall Precision
F
2* *
1 (7)
In the process of training the classification model, we use cross-validation to randomly select data for model iteration. After multiple iterations, the model classification effect is as stable as possible to a constant value. From the final model performance, the evaluation of various classification indicators has achieved quite good results. The GBDT model has a precision value of 0.9271, a recall value of 0.9300, an F1 value of 0.9275, and an AUC value of 0.9655. The XGBoost model has a precision value of 0.9295, a recall value of 0.9323, an F1 value of 0.9296, and an AUC value of 0.9683. This result has far exceeded the traditional method of high and low value base station classification.
[image:5.595.78.518.658.696.2]The results are shown in Table 5:
Table 5. Model evaluation effect
Precision Recall F1 AUC
GBDT 0.9271 0.9300 0.9275 0.9655
XGBoost 0.9295 0.9323 0.9296 0.9683
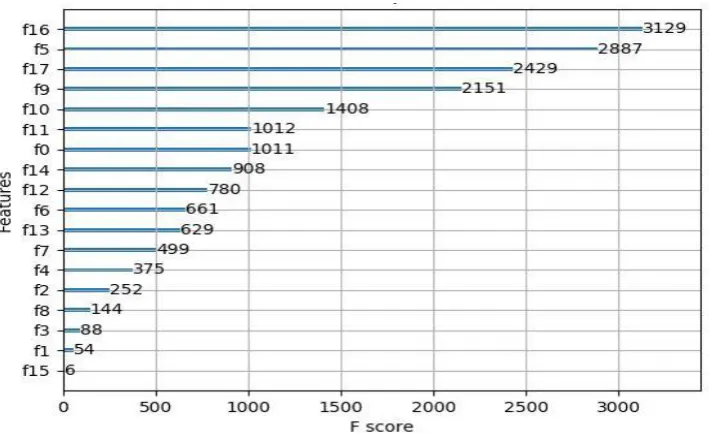
Figure 1. Feature importance.
The ordinate in Figure 1 indicates features, the corners of the features correspond to Table 2, and the abscissa indicates the importance of the features. The proportion of its importance is specifically as follows:MR_numis 16.98%, Weak_MR_num is 15.67%, Raw_MR_num is 13.18%, Flow_num is 11.68%, Rru_num is 7.64%, Uplink_traffic is 5.49%, Downlink_traffic is 5.48%, MR_coverage is 4.93%, Channel_num is 4.23%, Downlink_bandwidth is 3.59%, Downlink_frequency is 3.41%,
Send_power is 2.71%, Antenna_height is 2.03%, Horizontal_angle is 1.37%, Vertical_angle is
0.78%, Branch is 0.48%, Cell_type is 0.3%, Manufacturer is 0.03%.
Summary
In this paper, we have innovatively proposed a solution for the value analysis of LTE mobile communication by using machine learning classification algorithms. Through the final model test, the features of the base station antenna data and the base station measurement report data, such as
MR_num, Weak_MR_num, Raw_MR_num, Flow_num, and etc, are especially important for the base
station value division.
We are pleased that our model is able to achieve more than 90% accuracy on the test set. Future research work will continue to work in the following two areas:
(1)Use Stacking and other technologies to model fusion and capture the advantages of each model.
(2)Focus on the regional value of the area where the high-value base stations are densely distributed.
References
[1] Shen X, Tang S. The analysis of TD-LTE industry value chains in Chinese mobile communication market[C]// IEEE International Conference on Computer Science and Information Technology. IEEE, 2010:166-169.
[2] Dong L, Zhao H, Chen Y, et al. Introduction on IMT-2020 5G Trials in China[J]. IEEE Journal on Selected Areas in Communications, 2017, 35(8):1849-1866.
[3] Zhou S. Coverage and networking analysis of TD-LTE system[C]//Iet International Conference on Communication Technology and Application. IET, 2012:428-431.
[5] Ide C, Hadiji F, Habel L, et al. LTE Connectivity and Vehicular Traffic Prediction Based on Machine Learning Approaches[C]//Vehicular Technology Conference. IEEE, 2015:1-5.
[6] Wang Z, Wen C, Xu X, et al. Fault Diagnosis Method Based on Gap Metric Data Preprocessing and Principal Component Analysis[J]. 2018.
[7] Sion R, Atallah M, Prabhakar S. Rights Protection for Categorical Data[J]. IEEE Transactions on Knowledge & Data Engineering, 2005, 17(7):912-926.
[8] Guyon I. An introduction to variable and feature selection[M]. JMLR.org, 2003.
[9] Friedman J H. Greedy function approximation: A gradient boosting machine.[J]. Annals of Statistics, 2001, 29(5):1189-1232.
[10] Tianqi Chen, Tong He, Michael Benesty, et al. xgboost: Extreme Gradient Boosting[J]. 2016.
[11] Eiben A E, Smit S K. Parameter tuning for configuring and analyzing evolutionary algorithms[J]. Swarm & Evolutionary Computation, 2011, 1(1):19-31.