2018 International Conference on Applied Mechanics, Mathematics, Modeling and Simulation (AMMMS 2018) ISBN: 978-1-60595-589-6
Design and Implementation of Data Analysis and Processing Software
for Ship Pose and Position Based on GUI
Ming ZHAO*
and Chao-bin YANG
Hubei University of Technology, Wuhan, Hubei, China *Corresponding author
Keywords: MATLAB, GUI, Ship pose and position, Data analysis, Data processing.
Abstract. Because of the low efficiency data analysis and processing for ship pose and position, A set of ship pose and position data processing software was designed and implemented by MATLAB graphical user interface (GUI). In order to make the interface more layering and operational, we use several separate callback function to realize global callback by relevant with botton-up design methods. The software realize some functions: evaluating the data quality, data graphic outputing, and data tabulated outputting.
Introduction
The space measurement ship is an important part of China's space measurement and control network, which mainly undertakes the offshore measurement and control mission of the target aircraft. Space measurement ship requires inertial navigation systems to measure ship position and attitude information in real time for eliminating measurement errors under dynamic conditions at sea. The position and equipment of Yuanwang 7 Ship include inertial navigation equipment and satellite navigation equipment, navigation console can receive storage inertial navigation, guidance measurement information and status information. Besides, it can also store the raw data of the inertial internal components, and simultaneously receive and store the hull deformation information output by the deformation measuring device.
The posture and position information generated by the navigation equipment and the deformation equipment are with lots of characteristics including lots of types, different storage formats, large amount of stored data, and difficult analysis and processing afterwards. In actual work, there is a large demand for post-processing of ship attitude and ship position data. There are multiple analysis and processing requirements for different data in precision analysis, fault troubleshooting, state determination, data inversion, long-term accumulation comparison and some other time.
At present, the data analysis and processing methods adopted are basically temporary, that is, the programs are written according to different needs every time, the code re-usability is poor, and the analysis processing efficiency is quite low. Therefore, it is necessary and meaningful to design and implement a ship position data analysis and processing software, which is easy to operate, but also comprehensive in analysis and processing data, extensible, and intuitive in visual display.
Software Requirements Analysis and Overall Architecture
Software Requirements Analysis
File to Be Processed
a. Saves data of navigation display console
20Hz inertial navigation measurement data, 1Hz inertial navigation state data, guardian state data, guardian self-positioning data, guardian ephemeris data, guardian almanac data, optical deformation measurement data, INS calculation deformation measurement data.
b. Save data of inertial navigation machine Lower machine guidance data
c. Other
Save File Storage Mechanism and Format
a. Navigation display console and inertial navigation lower computer save file is a binary save file in dat format;
b. The save file of optical distortion display console is a save file in excel format. c. The theodolite masters the local save file is a kind of save file in txt format.
Software Output
Evaluate the data quality based on curves, tables, and other file formats that need to be generated.
Software Architecture
The software is designed as a stand-alone version, with the data type as the module division principle, to achieve easy operation, strong customization requirements through the rich man-machine interface, and fully consider the implementation of the expandable interface.
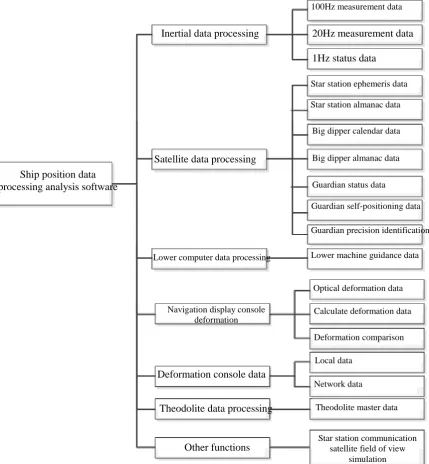
The software intends to call the sub-window via the menu mode. The menu is a two-level menu. The main menu is inertial data processing, satellite data processing, lower computer data processing, deformation data processing, and theodolite data processing. Set the secondary menu according to the data type of the combing. The overall architecture of the software is shown in Figure 1.
Ship position data processing analysis software
Inertial data processing
Satellite data processing
Lower computer data processing
Navigation display console deformation
Deformation console data
Theodolite data processing
Other functions
100Hz measurement data
20Hz measurement data
1Hz status data
Star station ephemeris data
Star station almanac data
Big dipper calendar data
Big dipper almanac data
Guardian status data
Guardian self-positioning data
Guardian precision identification
Lower machine guidance data
Optical deformation data
Calculate deformation data
Deformation comparison
Local data
Network data
Theodolite master data
Star station communication satellite field of view
[image:2.595.84.514.292.757.2]Software Design
Development Environment Determination
The computing function of MATLAB is powerful, the vector, array, matrix and other operations and file processing functions provided offers convenient conditions for data processing. MATLAB also provides support for graphical user interfaces (GUIs) that visualizes boring programming languages. From the current software trend, a friendly graphical interface can not only make people more acceptable, but also improve efficiency.
A graphical user interface (GUI) is a user interface created by using graphical objects such as buttons, text boxes, scroll bars, menus, and more. The process of implementing a GUI consists of two basic tasks: one is the component layout of the GUI, and the other is the GUI component programming. All of these functions are done through the graphical user interface development environment GUIDE.
This paper is based on MATLAB/GUI user graphical interface development tool implementation.
Interface Design
Analyze the main functions to be realized in each interface, use the series of tools provided by the MATLAB graphical user interface development environment GUI to create the main interface of the concept and each sub-interface, complete the corresponding functions, and ensure the reasonable layout and beautiful interface.
Main Interface Design
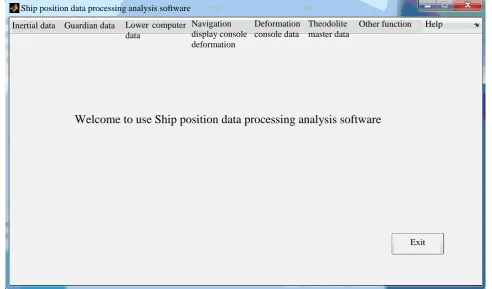
Enter any sub-interface by selecting the menu bar through the main interface of the system. Then click the “Exit” button to exit the system.
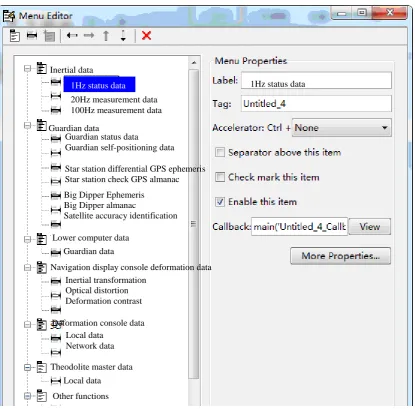
[image:3.595.52.545.428.717.2]The menu bar displayed in the main interface is designed by the menu editor. The main interface is shown in Figure 2, and the menu editor is shown in Figure 3.
Figure 2. Main interface schematic.
Ship position data processing analysis software
Inertial data Guardian data Lower computer data
Navigation display console deformation data
Deformation console data
Theodolite master data
Other function Help
Welcome to use Ship position data processing analysis software
Figure 3. Menu editor schematic.
Sub-interface Design
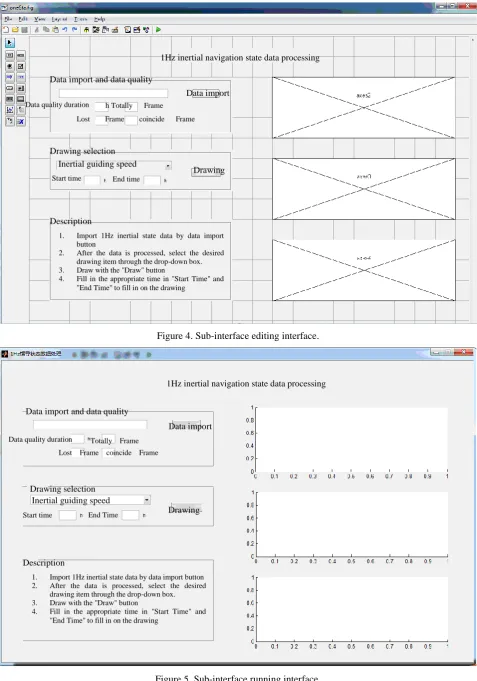
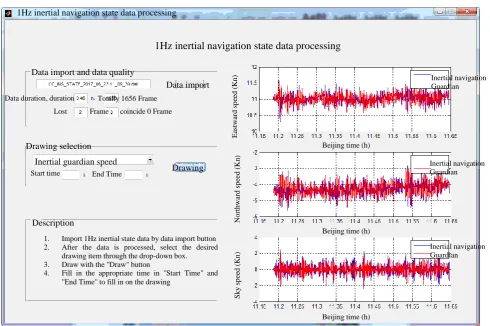
Taking the inertial navigation 1Hz state data processing interface as an example, briefly explain the sub-interface design. Create a blank MATLAB GUI interface, place the required GUI controls in the appropriate positions, and set the properties of each control,, the interface after setting is shown as in Figure 4.The interface consists of data input and data quality assessment area, drawing selection area, drawing area, description area and some other areas.The interface after running is shown as in Figure 5.
Inertial data
1Hz status data
20Hz measurement data 100Hz measurement data
Guardian data
Guardian status data
Guardian self-positioning data
Star station differential GPS ephemeris Star station check GPS almanac
Big Dipper Ephemeris Big Dipper almanac
Satellite accuracy identification
Lower computer data Guardian data
Navigation display console deformation data Inertial transformation
Optical distortion Deformation contrast
Deformation console data Local data
Network data
Theodolite master data
Local data
Other functions
Figure 4. Sub-interface editing interface.
Figure 5. Sub-interface running interface.
1Hz inertial navigation state data processing
Data import and data quality
Data import Data quality duration h Totally Frame
Lost Frame coincide Frame
Drawing selection Inertial guiding speed
Drawing Start time End time
Description
1. Import 1Hz inertial state data by data import button
2. After the data is processed, select the desired drawing item through the drop-down box. 3. Draw with the "Draw" button
4. Fill in the appropriate time in "Start Time" and "End Time" to fill in on the drawing
1Hz inertial navigation state data processing
Data import and data quality
Data import
Drawing Data quality duration Totally Frame
Lost Frame coincide Frame
Drawing selection Inertial guiding speed
Start time End Time
Description
1. Import 1Hz inertial state data by data import button 2. After the data is processed, select the desired
drawing item through the drop-down box. 3. Draw with the "Draw" button
Software Test
According to the function of the designed graphical interface, the user writes a callback function that can implement the function for each different graphic object until can control the input of the data directly through each control on the interface, and can easily and intuitively see the expected results. After the GUI interface is designed, the software needs to be tested, which means a lot of verification is performed to determine that the software can achieve the expected function well. Mainly to improve the writing of callback function code and humanized design such as prompt dialog.
Take the INS 1Hz state data processing interface as an example to test the software.
[image:6.595.132.459.255.374.2]Import the inertial navigation 1Hz state file through the “Data Import” button, and process the data to give a progress prompt, as shown in Figure 6.After the processing is completed, the data quality is given, mainly is the number of dropped frames and re-frames, as shown in Figure 7.
Figure 6. Progress bar interface.
Select the drawing content, click the “Draw” button, and finish drawing in the drawing area, as shown in Figure 7.
Figure 7. Drawing interface.
Progress bar
Progress completed 36.3527%
Cancel
1Hz inertial navigation state data processing
1Hz inertial navigation state data processing
Data import and data quality
Data import
Drawing Data duration, duration Totally 1656 Frame
Lost Frame , coincide 0 Frame
Drawing selection
Inertial guardian speed Start time End Time
1. Import 1Hz inertial state data by data import button 2. After the data is processed, select the desired
drawing item through the drop-down box. 3. Draw with the "Draw" button
4. Fill in the appropriate time in "Start Time" and "End Time" to fill in on the drawing
Description E as tw ard s p eed ( K n ) N o rt h w ar d s p eed ( K n ) Sk y s p ee d ( K n )
Beijing time (h)
Beijing time (h)
Beijing time (h)
Inertial navigation Guardian Inertial navigation Guardian Inertial navigation Guardian 6. After the data is processed, select the desired
drawing item through the drop-down box. 7. Draw with the "Draw" button
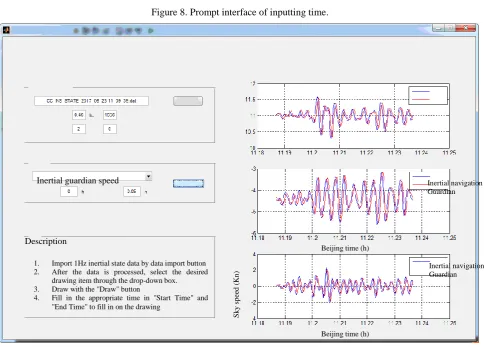
[image:6.595.56.547.422.748.2]In the drawing selection area, enter the start time and end time, you can zoom in on the drawing to judge the input time, and give the prompt box as shown in Figure 8.The drawing is enlarged as shown in Figure 9.
Figure 8. Prompt interface of inputting time.
Figure 9. Drawing enlargement interface.
Conclusion
The GUI-based ship position data analysis and processing software achieves the expected design goals. The processing scope covers all types of data in the ship position system, providing convenient means for daily equipment troubleshooting, post-mortem data processing analysis, and equipment status analysis. The software contains the advantages of visualization, interactivity, easy operation, and scalability.
References
[1] Ming Zhang, Design of Demonstration System for Communication Principles Based on MATLAB GUI, Experimental Technology and Management, vol. 30(9), pp. 111-113, 2013.
Warning
The end time cannot be greater than the length of time!
Inertial guardian speed Inertial navigation
Guardian
Inertial navigation Guardian 1. Import 1Hz inertial state data by data import button
2. After the data is processed, select the desired drawing item through the drop-down box. 3. Draw with the "Draw" button
4. Fill in the appropriate time in "Start Time" and "End Time" to fill in on the drawing
Description
Sk
y
s
p
ee
d
(
K
n
)
Beijing time (h)
[image:7.595.57.542.231.578.2][2] Fei Huang, Zhenxin Liu and Ming Luo, Simulation System of Asynchronous Motor Based on Graphical User Interface(GUI), Modern Electronic Technology, vol. 6, pp. 178-180, 2007.
[3] Ran Chen and Xiaping Zhang, The Design and Simulation of FIR Digital Filter Based on MATLAB GUI, Journal of NanJing XiaoZhuang University, vol. 6, pp. 15-20, 2015.
[4] Cheng Zhang, Guofei Shang and Fangfang Huang et al, Design and inplementation of the ecological pressure waring system based on MATLAB(GUI), Environmental Science and Technology, vol. 39(5), pp. 200-205, 2016.