S O F T W A R E
Open Access
SPECtre: a spectral coherence-based
classifier of actively translated transcripts
from ribosome profiling sequence data
Sang Y. Chun
1†, Caitlin M. Rodriguez
2†, Peter K. Todd
2,3and Ryan E. Mills
1,4*Abstract
Background:Active protein translation can be assessed and measured using ribosome profiling sequencing strategies. Prevailing analytical approaches applied to this technology make use of sequence fragment length profiling or reading frame occupancy enrichment to differentiate between active translation and background noise, however they do not consider additional characteristics inherent to the technology which limits their overall accuracy.
Results:Here, we present an analytical tool that models the overall trinucleotide periodicity of ribosomal occupancy using a classifier based on spectral coherence. Our software, SPECtre, examines the relationship of normalized ribosome profiling read coverage over a rolling series of windows along a transcript relative to an idealized reference signal without the matched requirement of mRNA-Seq.
Conclusions:A comparison of SPECtre against previously published methods on existing data shows a marked improvement in accuracy for detecting active translation and exhibits overall high accuracy at a low false discovery rate. In addition, SPECtre performs comparably to a recently published method similarly based on spectral
coherence, however with reduced runtime and memory requirements. SPECtre is available as an open source software package at https://github.com/mills-lab/spectre.
Keywords:Ribosome profiling, Spectral coherence, Translation, Classification
Background
Ribosome profiling is a next-generation sequencing strat-egy that enriches for ribosome-protected mRNA foot-prints indicative of active protein translation [6]. Fragments of mRNA bound by ribosomal complexes are selected for by enzymatic digestion, isolated using a su-crose cushion or gradient, released from their occupying ribosome, size-selected by gel electrophoresis, and then sequenced. Thus, sequencing and analysis of ribosome-protected fragments (RPFs) of mRNA enables profiling of the translational content of a sample on a transcriptome-wide level.
Various algorithms have been developed to differentiate protein-coding and non-coding transcripts in ribosome profiling sequence data using fragment length distribution differences [6] and read frame enrichment of aligned reads [2]. However, classification based on extreme outlier ana-lysis of fragment length organization similarity score (FLOSS) differences is agnostic to the ribosome-protected fragment abundance over a transcript. Furthermore, classification based on read frame alignment enrichment (ORFscore) is optimized for canonical open reading frame (ORF) usage only. In addition, neither of the algorithms described above are available as standalone packages and must be implemented by the user. Published more re-cently, RiboTaper [4] utilizes a coherence-based approach to detect actively translated transcripts from the alignment of ribosome-protected fragments; however, the RiboTaper algorithm requires matched ribosome profiling and mRNA sequence libraries and can take multiple days to analyze a single sample.
* Correspondence:[email protected]
†Equal contributors
1
Department of Computational Medicine and Bioinformatics, University of Michigan, Ann Arbor, MI 48109, USA
4Department of Human Genetics, University of Michigan, Ann Arbor, MI
48109, USA
Full list of author information is available at the end of the article
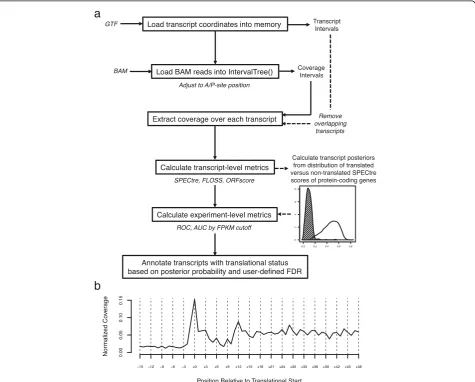
Here we introduce SPECtre, a classification algorithm based on spectral coherence to identify regions of active translation with high sensitivity and specificity using aligned ribosome profiling sequence reads without the requirement of a matched mRNA sequence library (Fig. 1a). SPECtre leverages a key feature of ribosome profiling where sequence reads aligned to a reference transcriptome will track the tri-nucleotide periodicity characteristic of tran-scripts as they are translated by ribosomes, and reports both significant signals of translation as well as windowed periodicity scores for visualizing results within a genomic context. Options to change the size of windows analyzed, the step size between adjacent windows, false discovery rate, abundance cutoffs to define actively translated ver-sus nontranslated score distributions, and parameters to optimize runtime performance are provided to the user to customize. Implementations of FLOSS and ORFscore are included with SPECtre for comparative purposes.
Implementation
In contrast to non-coding transcripts, ribosome profiling fragments aligned to protein-coding transcripts are charac-terized by a trinucleotide periodic signal as ribosome-bound mRNAs are translated into protein in a codon-dependent manner (Fig. 1b). Thus coding transcripts may be differenti-ated from non-coding transcripts by the presence or absence of a strong tri-nucleotide periodic signal. To measure the strength of this tri-nucleotide signal, we calculate the spec-tral coherence [3] over sliding N nucleotide length windows across a transcript (see also Additional file 1: Materials and Methods). Spectral coherence is a measurement of the power relationship between two signals over the frequency domain, such that two signals with shared frequencies will have high coherence, whereas two un-related signals will be of low coherence. The SPECtre score, based on a modified Welch’s spectral density es-timate [11] of overlapping windows, is calculated for
a
b
[image:2.595.62.538.320.702.2]each transcript from a user-provided transcript annota-tion database.
For a given transcript with coordinates defined by the setC, the A- or P-site adjusted read positions overlapping those coordinates are extracted from a BAM alignment file. The coverage over each coordinate in the set is summed, then normalized to the position with the highest coverage, such that all coordinate positions defined by the set C
range from zero (no coverage) to one (highest coverage). The default SPECtre score is calculated as the average (Welch’s) coherence over N nucleotide sliding windows across a normalized coverage region against an idealized tri-nucleotide control signal of the same length. Therefore, the SPECtre score across a normalized coverage regionR,
with coordinatesC, against an idealized tri-nucleotide peri-odic signalS with frequencyj, over adjacentNnucleotide windows is given by:
SpecRS;j¼ 1
M XM
m¼1
CohRm;mþNSN;j f or all mþN∈C ð1Þ
Alternatively, the number of sliding windows (Wn) over
the coordinate set C, may be modified based on the step size between each window. Therefore, given a coordinate setC, and step size ofL:
Wn¼CLn; f or n≥1and L≥1 ð2Þ
Therefore, the default SPECtre score of a normalized coverage region R, at frequency j of an idealized trinu-cleotide signalS, overNnucleotide sliding windows with a step size ofL, is given by the equation:
SpecRS;j ¼
1
M
XM
m¼1
CohRm;mþNSN;j f or all m∈Wnand all m
þN∈C
ð3Þ
Distributions of these scores are generated using a user-defined fragments per kilobase per million reads, or FPKM [9], cutoff to differentiate transcripts under active translation from those that are not; these distributions are then used to derive a minimum SPECtre score threshold for active translation given a pre-determined false discovery rate, as well as the posterior probability that a given transcript or region is actively translated.
Ribosome profiling libraries treated with cycloheximide typically isolate RPFs of 28 to 30 nucleotides in length; these fragments align with high fidelity to protein-coding regions [6]. However, in the absence of cycloheximide, conformational changes in the ribosomal complex en-rich for a shorter range of RPFs that also map with high fidelity to protein-coding regions [8]. Enrichment of these shorter-range fragments may obscure the tri-nucleotide signal profiled by coherence-based classifiers,
like SPECtre, and may under-estimate the number of ac-tively translated ORFs. We simulated increasing variance of RPF lengths outside of the expected enrichment of 28– 30 nt length fragments through a biased sampling of reads aligned to the housekeeping gene ACTB. With increased bias, the RPF length distribution is no longer enriched in fragments of 28–30 nt in length, but instead progressively resembles a uniform distribution (Additional file 1: Figure S1). Biased re-sampling of 10,000 out of over 500,000 P-site adjusted reads aligned to ACTB was performed over 10,000 trials, and in each trial the sampled reads were converted into normalized coverage, then scored by SPECtre. Using an extreme outlier cutoff, this biased sampling analysis suggests that SPECtre scoring re-mains robust under increased variance in sequence library fragmentation (Additional file 1: Figure S1 and S2).
Results
We assessed the sensitivity and specificity of each classi-fication algorithm using recently published ribosome profiling and mRNA-Seq data derived from HEK293 cells [4]. For the comparative analysis of each classifica-tion algorithm in the HEK293 ribosome profiling library, RiboTaper (version 1.3) was run against published read alignments using the included GENCODE (v19) transcript annotation database [5]. The highest scoring RiboTaper ORFs were extracted from the orfs_found results file using the transcript identifiers and scoring method from the ORFs_max output. These ORFs were then scored by SPECtre (using default parameters), FLOSS and ORFscore, and then relative performance of each algorithm was assessed by receiver operating characteristic (ROC) analysis. Previous work has benchmarked classifier performance using a series of transcript FPKM cutoffs [4] or other coverage-based metrics [2, 7]. Therefore ROC analyses were performed using a series of ORF abundance cutoffs based on FPKM to differentiate those under active translation from those that are not. In this manner, we are able to assess the ability of each approach to identify ORFs with signatures of active translation in the interrogated cell type. We performed ROC analyses and calculated the area under the curve (AUC) over pre-defined RPF abundance cutoffs (0.5, 1.0, 3.0, 5.0 and 10.0 FPKM) to assess the relative performance of each classification algorithm to accurately define regions of active translation. In HEK293 cells, SPECtre conforms with high fidelity to RiboTaper classification and outperforms both FLOSS and ORFscore to identify actively translated ORFs (Fig. 2a and b).
of matched mRNA-Seq data. Ribosome profiling sequence reads from each set were aligned to the mouse or zebrafish reference genome and transcriptome, respectively. Anti-sense, overlapping and neighboring protein-coding and non-coding transcripts were removed from the analysis using methods described previously [7]. The FLOSS, ORFscore and SPECtre metrics were calculated for each remaining transcript and ROC analyses were carried out
as described above. SPECtre remains robust in its classifi-cation of actively translated transcripts in the standalone mESC ribosome profiling library (Fig. 2c and Additional file 1: Table S2), and exhibits a marked improvement in accuracy in a meta-analysis of ribosome profiling libraries derived from zebrafish embryos (Fig. 2d).
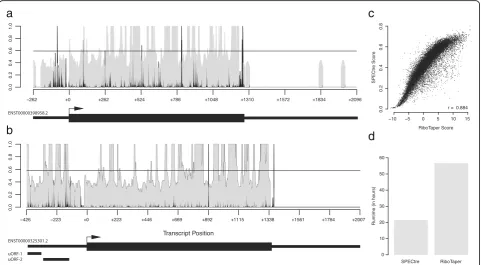
A unique feature of SPECtre is its ability to report and visualize signals of periodicity in the context of
a
b
c
d
[image:4.595.57.540.89.543.2]surrounding genomic features. Graphical output from SPECtre analysis is shown for two representative tran-scripts (Fig. 3a and b). Shown in Fig. 3a is the condensed transcript profile of RCC1201 (ENST0000398958) with the 5′UTR and 3′UTR depicted by the narrow black lines, and the CDS region depicted with the thicker black line. In gray is the normalized P-site adjusted read coverage over the transcript, with the posterior probability calcu-lated by SPECtre denoted by the black line. The dashed horizontal line represents the translational threshold cal-culated by SPECtre at a false discovery rate (FDR) of 0.05. In addition to the transcript structure depicted in Fig. 3b are two upstream open reading frames (uORFs) detected separately by RiboTaper (asterisked black bars) in the MIEF1 (ENST0000325301) transcript. Although the 5′ UTRs of both RCC1201 and MIEF1 are profiled by RPF coverage, SPECtre analysis identifies only the uORFs in the 5′UTR of MIEF1, also identified previously by RiboTa-per [4], with a tri-nucleotide signal of sufficient strength to be indicative of translational potential.
A further analysis of these and other ORFs assessed by both SPECtre and RiboTaper show a very high degree of score consistency between the two algorithms (Fig. 3c) in addition to their comparable overall accuracy. However,
SPECtre has been designed to be fast and efficient and ex-hibits a runtime almost one-third of that required by Ribo-Taper (Fig. 3d) without the necessity of RNA-Seq data. This is achieved through SPECtre’s ability to chunk experiments and parallelize analyses over multiple threads, depending on available computational resources, which enables this exceedingly fast runtime relative to existing methods and decreases the computational barrier between library align-ment to application and validation. For these experialign-ments, SPECtre analysis was split by chromosome and run using 8 processors, with 32 gigabytes of RAM allocated; RiboTaper was run with default parameters, using 8 processors and 64 gigabyes of RAM. Both SPECtre, and RiboTaper were run on a high-performance computing cluster running Red Hat Enterprise Linux version 6.4 (Santiago). For installation simplicity and application efficiency, SPECtre has been written in Python with minimal third-party dependencies; the only non-standard Python libraries required for SPECtre analysis are RPy2, NumPy [10], HTSeq [1], SAM-Tools, PyFASTA, PySAM, and the R package ROCR.
Conclusions
SPECtre is a flexible, lightweight, command-line driven ana-lytical package that identifies regions of active translation
a
b
c
d
[image:5.595.58.540.389.654.2]through modeling of the tri-nucleotide periodicity char-acteristic of translation by ribosomes, and does so with high fidelity to a recently published method that relies on a similar coherence-based approach. SPECtre classifi-cation also out-performs prevailing algorithms based on fragment length distribution profiling and reading frame occupancy enrichment. SPECtre is robust across ribosome profiling libraries derived from multiple organisms and cell types, even in the absence of matching mRNA-Seq data, and is capable of identifying active translation in regions previously thought to be non-coding. Further, SPECtre is under continuous development to optimize compute runtime and memory overhead in order to fa-cilitate the efficient and accurate investigation of trans-lational dynamics through ribosome profiling sequence analysis.
Availability and requirements
Project name: SPECtre
Project home page: https://github.com/mills-lab/spectre Operating systems: Linux, OS X
Programming languages: Python, R
Other requirements: Python v2.7.8+, rpy2, HTSeq, samtools v0.19+, pyfasta v0.5.2+, and pysam 0.9.1.4 + .
Additional file
Additional file 1:Supplemental methods, tables, figures and example scripts. (DOCX 143 kb)
Abbreviations
AUC:Area under the curve; FLOSS: Fragment length organization similarity score; FPKM: Fragments per kilobase per million mapped reads;
mESC: Mouse embryonic stem cells; ORF: Open reading frame; RAM: Random access memory; RHEL: Red Hat Enterprise Linux; ROC: Receiver operating characteristic; RPF: Ribosome-protected fragment; uORF: Upstream open reading frame
Acknowledgements
We would like to thank the University of Michigan DNA Sequencing Core for their advice, technical support, and services.
Funding
This work was supported by the University of Michigan [REM], the Michigan Discovery Fund [REM and PKT] and the National Institutes of Health [R01NS086810 to PKT, R01HG007068 to REM]. SYC was supported by the Proteome Informatics of Cancer Training Grant [T32CA140044]. CMR was supported by the Ruth L. Kirchstein National Research Service Award [F31NS090883].
Availability of data and materials
The datasets supporting the conclusions of this article are available in the Gene Expression Omnibus repository, GSE53693 [7], GSE60095 [2], and https://ohlerlab.mdc-berlin.de/files/RiboTaper/alignment_files.tar.gz [4].
Authors’contributions
SYC designed the algorithm, wrote the program, comparatively benchmarked the different algorithms, and wrote the manuscript. CMR provided biological and technical expertise, helped to refine the algorithm, and revised the manuscript. PKT conceived the study and revised the manuscript. REM conceived the study, modified the algorithm, and revised the manuscript. All authors read and approved the final manuscript.
Competing interests
The authors declare that they have no competing interests.
Consent for publication Not applicable.
Ethics approval and consent to participate Not applicable.
Author details
1Department of Computational Medicine and Bioinformatics, University of
Michigan, Ann Arbor, MI 48109, USA.2Department of Neurology, University of Michigan, Ann Arbor, MI 48109, USA.3Veterans Affairs Medical Center, Ann
Arbor, MI 48105, USA.4Department of Human Genetics, University of
Michigan, Ann Arbor, MI 48109, USA.
Received: 21 June 2016 Accepted: 18 November 2016
References
1. Anders S, Pyl PT, Huber W. HTSeq–a Python framework to work with high-throughput sequencing data. Bioinformatics. 2015;31(2):166–9.
2. Bazzini AA, Johnstone TG, Christiano R, Mackowiak SD, Obermayer B, Fleming ES, Vejnar CE, Lee MT, Rajewsky N, Walther TC, Giraldez AJ. Identification of small ORFs in vertebrates using ribosome footprinting and evolutionary conservation. EMBO J. 2014;33:981–93.
3. Bendat JS, Piersol AG. Random Data: Analysis and Management Procedures. Wiley Interscience. 1986.
4. Calviello L, Mukherjee N, Wyler E, Zauber H, Hirsekorn A, Selbach M, Landthaler M, Obermayer B, Ohler U. Detecting actively translated open reading frames in ribosome profiling data. Nat Methods. 2015;13:165–70. 5. Harrow J, Frankish A, Gonzalez JM, Tapanari E, Diekhans M, Kokocinski F,
Aken BL, Barrell D, Zadissa A, Searle S, Barnes I, Bignell A, Boychenko V, Hunt T, Kay M, Mukherjee G, Rajan J, DespacioReyes G, Saunders G, Steward C, Harte R, Lin M, Howald C, Tanzer A, Derrien T, Chrast J, Walters N, Balasubramanian S, Pei B, Tress M, Rodriguez JM, Ezkurdia I, van Baren J, Brent M, Haussler D, Kellis M, Valencia A, Reymond A, Gerstein M, Guigó R, Hubbard TJ. GENCODE: the reference human genome annotation for The ENCODE project. Genome Res. 2012;22(8):1760–74.
6. Ingolia NT, Ghaemmaghami S, Newman JRS, Weissman JS. Genomewide analysis in vivo of translation with nucleotide resolution using ribosome profiling. Science. 2009;324:218–23.
7. Ingolia NT, Brar GA, SternGinossar N, Harris MS, Talhouame GJS, Jackson SE, Wills MR, Weissman JS. Ribosome profiling reveals pervasive translation outside of annotated proteincoding genes. Cell Rep. 2014;8:1365–79. 8. Lareau LF, Hite DH, Hogan GJ, Brown PO. Distinct stages of the translation
elongation cycle revealed by sequencing ribosome-protected mRNA fragments. Elife. 2014;3:e01257.
9. Trapnell C, Williams BA, Pertea G, Mortazavi A, Kwan G, van Baren MJ, Salzberg SL, Wold BJ, Pachter L. Transcript assembly and quantification by RNASeq reveals unannotated transcripts and isoform switching during cell differentiation. Nat Biotech. 2010;28:511–5.
10. van der Walt S, Colbert C. Varoquaux GThe NumPy Array: A structure for efficient numerical computation. Computing in Science & Engineering. 2011;13:22–30.
![Fig. 2 Comparative analysis of SPECtre against previously published translational classification algorithms.ccutoffs as measured by AUC.profiling in zebrafish [2] over various RPF abundance cutoffs as measured by AUC](https://thumb-us.123doks.com/thumbv2/123dok_us/113296.1016428/4.595.57.540.89.543/comparative-previously-published-translational-classification-algorithms-profiling-abundance.webp)