2018 International Conference on Computer, Electronic Information and Communications (CEIC 2018) ISBN: 978-1-60595-557-5
Research on Optimization Method and Experiment of
Digital Camouflage Pattern
Qi JIA, Zai-yuan LIU
*, Wei-dong XU, Jiang-hua HU and Xu-liang LV
College of Field Engineering, Army Engineering University of PLA, Nanjing, China
*Corresponding author
Keywords: Digital camouflage pattern, Index extraction, Optimization, Experiment.
Abstract. The design of digital camouflage pattern directly affects the camouflage effect. In order to solve the problem of digital camouflage effect evaluation and the optimization of digital pattern, three index features, including extraction brightness contrast, color feature and orientation feature, are selected to construct the synthetic evaluation index system of digital camouflage. A model of digital camouflage effect evaluation based on multi index grey clustering algorithm is established. Then he model is programmed with MATLAB software to compare the camouflage effect of different digital camouflage patterns and choose the best digital camouflage pattern. Finally, the virtual scene method is used to detect the subjective camouflage effect of digital camouflage pattern. The results show that the synthetic evaluation index system of digital camouflage based on background has certain feasibility, and the result of operation is more accurate and effective, so it can realize the optimization of digital camouflage.
Introduction
Digital camouflage is an important way for soldiers and military equipment to protect them. Because the characteristic of modern warfare is that the line is vague, the sudden nature is very strong, and the scope of the target is expanding continuously, for camouflage, the difference of natural background also shows rapid variability. In recent years, many experts have done some research on the evaluation of camouflage effect. Xu proposed a camouflage performance evaluation model based on Euclidean distance [1]. Zhang researched on digital camouflage technology of ground equipment [2]. Jiro evaluated camouflage effect by establishing gray-level histogram [3]. Qin improved evaluation camouflage effect by digital imitation of camouflage objective quantitative evaluation [4]. Deng proposed fidelity evaluation of Ground-to-air missile weapon based on cloud theory [5]. These results have some reference value for the research of camouflage evaluation. However, individual indicators can only effectively evaluate certain backgrounds, and the results of most of the single indicators of the background are not so accurate.
Construction of Comprehensive Evaluation Index System
Index system refers to the index group which is composed of several interrelated indexes in order to accomplish certain research purposes. Because the index represents the attribute of a certain aspect of the evaluation object, multiple indexes can evaluate the complete expression of most attributes of the object. So, the evaluation object can be evaluated comprehensively by establishing the system model with all indexes. Therefore, it is very important to establish the comprehensive evaluation Index system accurately before the comprehensive evaluation of camouflage.
The Extraction of Evaluation Index
elements of human recognition. Therefore, they are regarded as the target characteristics of camouflage evaluation. The extraction methods of different evaluation indexes are introduced below. In the color space, the brightness indicates the intensity of the color and is a dimension that is related to the brightness of the color. Color is an important visual property, compared with other features, color characteristics is a strong visual characteristic, color extraction is very easy, but also by the rotation, peace and size of the impact of small changes, stable nature [6].
The orientation of the image is formed by the repeated occurrence of the gray distribution in the spatial position, so there will be some spatial correlation characteristics between the two pixels separated from one distance in the image space. The two statistics are mainly used in the following.
Angular Second order moment
(1) Contrast ratio
(2) Entropy
(3) Dependence
(4)
, , ,
By calculating the above 4 eigenvalues, we get the characteristic vector . The eigenvalue is normalized to the interval by means of formula.
(5)
is a normalized eigenvalue.
Using Manhattan distance, the similarity degree is 0 when the orientation feature of the two images is identical to the characteristic similarity . The formula for Manhattan calculation is as follows
(6)
Pretreatment of Evaluation Index
This paper mainly adopts the method of vector normalization. is
removed with , and the reference sequence is . The Comparison series is
(7) Where, i=1, 2, ..., N. k=1, 2, ..., N.
Determination of Weight Value of Evaluation Index
(8) Calculates the proportion of the target value of the I object under the j index ,
(9) The normalized matrix Y= of the data can be obtained.
Calculates the information entropy value of the index j. For the first j index, the Greater difference, the greater the effect of on the program evaluation, the smaller the entropy value [8]:
(10) Where, k>0, k=1/ln N. 0.
The information utility value of the index j is calculated by . The weight of Evaluation
index is .
Construction of Comprehensive Evaluation Index System
Through each index value and index weight, we can get the comprehensive evaluation index coefficient matrix, whose formula is
(11) The matrix Z of comprehensive evaluation Index system can be used as the data platform for synthetic evaluation of camouflage camouflage. Through the above analysis can obtain the camouflage Camouflage Index system establishment flow, as shown in the Figure.1.
(a) (b)
Figure 1. The process diagram. Figure 2. The background images.
Selection of Camouflage Samples
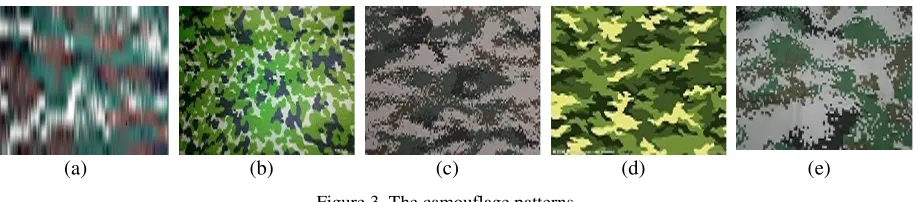
In this paper, 5 kinds of camouflage images were used to experiment with 2 different woodland backgrounds, as shown in the figure. This is shown in Figure.2 and Figure.3. As can be seen from the graph, the camouflage background of the target is dominated by transverse trees and large jungle.
(a) (b) (c) (d) (e)
Figure 3. The camouflage patterns. Establish a Camouflage Evaluation Matrix
Using the extraction method of the second chapter, the paper extracts the characteristic values of 3 indexes of background and camouflage images, calculates the background and the similarity of each camouflage pattern according to the similarity Criterion, and obtains the initial evaluation index matrix based on the similarity data of 3 sets of indicators. In this matrix, the rows are represented as camouflage images in 5, and the columns represent the three indicators from the color feature to the orientation feature and are converted to tables as shown in Table.1.
Table 1. The contrast of camouflage pattern and background picture.
Similarity Luminance Color Direction
Picture 1 0.2398 0.3848 0.6411
Picture 2 0.2914 0.6515 1.7553
Picture 3 0.2391 0.0906 0.6023
Picture 4 0.2870 0.3545 0.6059
Picture 5 0.2662 0.4571 1.4225
The Establishment of Sample Weight Coefficient Matrix
[image:4.612.150.465.438.512.2]Standardized functions are used to standardize the original matrix, and the normalized matrix is transformed into a table, as shown in Table.2.
Table 2. The normalized matrix.
Similarity Luminance Color Direction
Picture 1 -1.72 -0.01 -0.67
Picture 2 0.71 1.30 1.37
Picture 3 0.66 -1.47 -0.74
Picture 4 0.33 -0.16 -0.73
Picture 5 0.02 0.34 0.76
The normalized matrix of index similarity is obtained. According to the method of determining weight of evaluation index, the weights of different indexes under this particular background are determined by using entropy weight method. The weights of each index are calculated to be V= (0.070096, 0.188657, 0.741247).
The Result of Experiment
According to the index similarity matrix of five camouflage images and the influence weights of three indexes, the digital model of camouflage system can be used as shown in Table.3, which is the data system of camouflage evaluation index. Based on these data, the camouflage effect of camouflage image in different background can be evaluated.
Table 3. The sorting pictures.
Similarity Luminance Color Direction Result Sorting
Picture 1 0.006499 0.38479 0.641068 0.548239 3
Picture 2 0.007945 0.651508 1.755338 1.424608 1
Picture 3 0.007912 0.090595 0.602321 0.464114 5
Picture 4 0.007718 0.354503 0.605872 0.516521 4
According to the final program operation, the evaluation value of the synthetic evaluation index of digital camouflage is obtained, which reflects the quality of camouflage image and background camouflage effect. When the value of the corresponding digital camouflage pattern is high, then it shows that the camouflage pattern in the current background has a better camouflage effect, on the contrary, the camouflage pattern in the current background and background of the difference is more obvious. As shown in Table.3, the evaluation value of each digital camouflage pattern under this background is the camouflage pattern 2> camouflage Pattern 5> Camouflage Pattern 1> Camouflage Pattern 4> Camouflage Pattern 3.
Analyze the Result of Experiment
The optimization of the camouflage effect of digital camouflage is realized. First, we can analyze and get the camouflage pattern 2 the camouflage effect is best in the background of this paper, the difference between camouflage pattern 3 and background is great. After the subjective testing experiment, combined weight subjective detection method for the test results of camouflage pattern, finally, we can see that camouflage pattern 2 camouflage effect is still best pattern 5 effect second. But pattern 1 and Pattern 4 weight is very close, to camouflage effect evaluation will have some interference, pattern 3 camouflage effect is the worst. But according to the actual combat requirements, we only need to choose the camouflage effect according to the background of the pattern applied to the camouflage of the target.
Summary
In this paper, based on the background of the digital camouflage Synthetic Evaluation Index system, the camouflage effects of 5 typical camouflage patterns are evaluated by contrast of brightness, color characteristics and orientation features three. Under the comprehensive action of several indexes, each characteristic index has certain representativeness and independence, and the weight of different indexes is considered comprehensively by using the entropy weight method, which ensures the integrity of camouflage effect evaluation. At the same time, according to the optimization method of camouflage pattern camouflage effect, combining MATLAB digital image processing Technology, a comprehensive evaluation index model is established, and finally the model programming is realized, and the evaluation effect is digitized. Finally, the results of the model are demonstrated by the test of the subjective camouflage effect. The experimental results show that the camouflage effect optimization model can effectively and reliably detect the camouflage effect of camouflage pattern and can be applied to the fast selection of camouflage pattern in field background. Due to time constraints, there will inevitably be some deficiencies in the paper.
References
[1] Xu, Tang, Lu, et al. an evaluation model of camouflage equipment performance based on Euclidean distance. Journal of the University of the PLA Polytechnic University (Natural Science Edition), 2001, 2(1), pp. 74-76.
[2] Zhang, Zhang Yong. Research on digital camouflage technology of ground equipment. Digital technology and Applications, 2014 (8), pp. 108-109,111.
[3] Jiro, Lu, Xu, et al. Camouflage Application model based on Gray-level histogram decomposition technology. Journal of PLA University of Technology (natural Science Edition), 2004, 5(3), pp. 74-77.
[5] Deng, Yang, peak, evaluation of pseudo-objective fidelity of Ground-to-air missile weapon based on cloud theory, Firepower and command control, 2013, 38 (3), pp. 92-94.
[6] Xie H, Ortega A. Feature representation and compression for content-based retrieval. Proceedings of SPIE - The International Society for Optical engineering, 2001, 4301, pp. 111-122.
[7] Ishibuchi H, tannka H. A learning algorithm of fuzzy neural networks with triangular fuzzy weights. Fuzzy Sets and Systems, 1995 (71), pp. 277-293.