Open Access
Research article
Characteristics of patients with chronic back pain who benefit from
acupuncture
Karen J Sherman*
1, Daniel C Cherkin
1, Laura Ichikawa
1, Andrew L Avins
2,
William E Barlow
1,3, Partap S Khalsa
4and Richard A Deyo
5Address: 1Group Health Research Institute, Seattle, USA, 2Division of Research, Northern California Kaiser Permanente, Oakland, USA, 3Cancer Research and Biostatistics, Seattle, USA, 4Division of Extramural Research and Training, National Center for Complementary and Alternative Medicine, National Institutes of Health, Bethesda, USA and 5Deparment of Family Medicine, Oregon Health and Science University, Portland, USA
Email: Karen J Sherman* - sherman.k@ghc.org; Daniel C Cherkin - cherkin.d@ghc.org; Laura Ichikawa - ichikawa.l@ghc.org; Andrew L Avins - andrew.avins@ucsf.edu; William E Barlow - williamb@crab.org; Partap S Khalsa - khalsap@mail.nih.gov; Richard A Deyo - deyor@ohsu.edu
* Corresponding author
Abstract
Background: Although many clinicians believe there are clinically important subgroups of persons with "non-specific" low back pain, such subgroups have not yet been clearly identified. As part of a large trial evaluating acupuncture for chronic low back pain, we sought to identify subgroups of participants that were particularly responsive to acupuncture.
Methods: We performed a secondary analysis of data for the 638 participants in our clinical trial comparing different types of acupuncture to usual care to identify baseline characteristics that predicted responses to individualized, standardized, or simulated acupuncture treatments. After identifying factors that predicted improvements in back-related function or symptoms, we determined if these factors were more likely to predict improvement for those receiving the acupuncture treatments than for those receiving usual care. This was accomplished by testing for an interaction between the prognostic factors and treatment group in four models: functional outcomes (measured by the Roland-Morris Disability Scale) at 8 and 52 weeks post-randomization and symptom outcomes (measured with a numerical rating scale) at 8 and 52 weeks.
Results: Overall, the strongest predictors of improvement in back function and symptoms were higher baseline levels of these measures, receipt of an acupuncture treatment, and non-use of narcotic analgesics. Benefit from acupuncture compared to usual care was greater with worse pre-treatment levels of back dysfunction (interaction p < 0.004 for the functional outcome, Roland Morris Disability Scale at 8 weeks). No other consistent interactions were observed.
Conclusion: This secondary analysis found little evidence for the existence of subgroups of patients with chronic back pain that would be especially likely to benefit from acupuncture. However, persons with chronic low back pain who had more severe baseline dysfunction had the most short-term benefit from acupuncture.
Published: 21 September 2009
BMC Musculoskeletal Disorders 2009, 10:114 doi:10.1186/1471-2474-10-114
Received: 27 March 2009 Accepted: 21 September 2009
This article is available from: http://www.biomedcentral.com/1471-2474/10/114 © 2009 Sherman et al; licensee BioMed Central Ltd.
Background
Low back pain is a common and costly problem that plagues the developed world [1-5]. Although there are a plethora of treatment options for low back pain, most evaluated treatments are of modest, if any, benefit [6,7]. One explanation for this observation is that there are, as yet, unidentified subgroups of persons with back pain who would be more likely to respond to some treatments than to others [8,9]. The challenge, then, would be to identify which individuals would be most likely to benefit from which treatments. In fact, most primary care clini-cians believe there are distinct subgroups of patients within currently defined "non-specific" low back pain [9]. If true, determining which treatments would be most ben-eficial for specific types of patients could substantially improve the effectiveness and efficiency of treatment [10,11].
Although many studies have identified factors associated with improvement in back pain [12-14], only a few have looked at those which predict improvement from a spe-cific treatment. For example, analyses by Underwood [15] suggested that greater expectations of treatment success might be more likely to lead to improved outcomes for patients receiving exercise combined with spinal manipu-lation than for those receiving usual care, exercise alone, or manipulation alone. Other studies found that persons with high levels of fear avoidance were more likely to ben-efit from an educational booklet and an exercise program [16] than were those without high levels of fear avoid-ance.
This study contributes to this nascent field of research by analyzing data from a large randomized trial of acupunc-ture for chronic low back pain [17] in order to determine if there are identifiable subsets of patients who were espe-cially likely to benefit from acupuncture.
Methods
We performed a secondary analysis of data for the 638 participants in our clinical trial of acupuncture for chronic back pain. In that trial, we found that participants who received acupuncture or simulated acupuncture had greater improvements in functional status and symptoms at the end of the treatment and at follow-up than those receiving usual medical care [17]. Details of the primary results and trial design are presented elsewhere [17,18], but a brief summary of the trial design is provided below. The trial was conducted in two integrated health care sys-tems (Group Health in Seattle and Kaiser Permanente in Northern California) whose institutional review boards approved the study.
We recruited 638 participants 20 to 70 years of age with non-specific low back pain that had lasted at least 3 months. Persons with prior use of acupuncture were
excluded. Participants were randomized to one of four treatments: individualized acupuncture, standardized acupuncture, simulated acupuncture (non-insertive stim-ulation of acupuncture points), or usual medical care. Par-ticipants were informed that the study was evaluating "different methods of stimulating acupuncture points". Those randomized to acupuncture or simulated acupunc-ture received 10 treatments over 7 weeks. All participants also received a self-care book and retained full access to the medical care provided by their insurance benefit. Tel-ephone interviewers, masked to treatment, administered questionnaires to participants at baseline and at 8 and 52 weeks post-randomization.
Baseline Data Collection
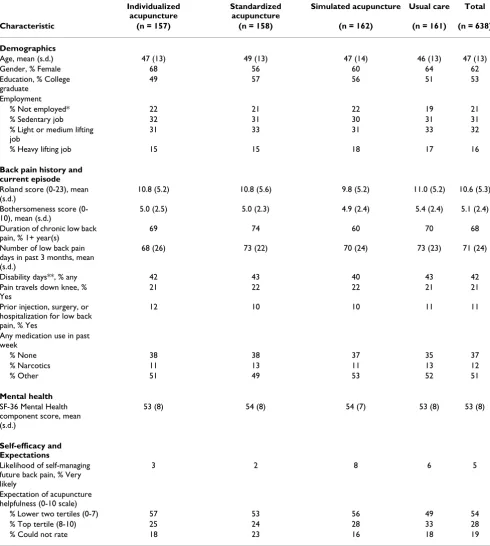
We collected baseline information on sociodemographic characteristics, status of current back pain, back pain his-tory, health status, perceived likelihood of self-managing future back pain, and expectations of acupuncture's help-fulness. Back pain history included pain duration and prior use of injections, hospitalization or surgery for back pain. Participants who reported use of any of these three treatments were labeled as having received "intensive treatment". To characterize the current episode, we asked about activity limitations (i.e., the number of days spent in bed, lost from work or school, or cutting down on usual activities due to back problems during past month) [19], back-related functional status (using the 23-item modi-fied Roland Morris Disability Scale [Roland score], where a higher score indicates greater dysfunction) [17,20], bothersomeness of current back symptoms using a 0 to 10 numerical rating scale (where a higher score is associated with worse symptoms) [17] pain below the knee, and medication use in the past week. The SF-36 Mental Health Component Summary Score was used to measure mental health status [21]. Finally, expectations of acupuncture's helpfulness was assessed using a 0 to 10 numerical rating scale, which were then analyzed in three categories: top tertile of expectations (8-10), lower two tertiles of expec-tations (0-7), or "could not rate" for those who could not provide a rating. The characteristics of the study popula-tion are presented in Table 1.
Statistical Methods
time since first back pain (categorized as less than one year, a year or more, unknown), ever had any intensive back treatments (i.e., injection, hospitalization, or sur-gery), and number of days of back pain in the last 3 months. The questions characterizing the current episode
[image:3.612.59.549.102.648.2]of back pain included the baseline dysfunction score (Roland score), the baseline bothersomeness score, if there were any of 3 types of activity limitations in the last month described in the previous paragraph (yes vs. no), medication use in the past week (narcotics, any other,
Table 1: Baseline characteristics of study population
Individualized acupuncture
Standardized acupuncture
Simulated acupuncture Usual care Total
Characteristic (n = 157) (n = 158) (n = 162) (n = 161) (n = 638)
Demographics
Age, mean (s.d.) 47 (13) 49 (13) 47 (14) 46 (13) 47 (13) Gender, % Female 68 56 60 64 62 Education, % College
graduate
49 57 56 51 53
Employment
% Not employed* 22 21 22 19 21 % Sedentary job 32 31 30 31 31 % Light or medium lifting
job
31 33 31 33 32
% Heavy lifting job 15 15 18 17 16
Back pain history and current episode
Roland score (0-23), mean (s.d.)
10.8 (5.2) 10.8 (5.6) 9.8 (5.2) 11.0 (5.2) 10.6 (5.3) Bothersomeness score
(0-10), mean (s.d.)
5.0 (2.5) 5.0 (2.3) 4.9 (2.4) 5.4 (2.4) 5.1 (2.4) Duration of chronic low back
pain, % 1+ year(s)
69 74 60 70 68
Number of low back pain days in past 3 months, mean (s.d.)
68 (26) 73 (22) 70 (24) 73 (23) 71 (24) Disability days**, % any 42 43 40 43 42 Pain travels down knee, %
Yes
21 22 22 21 21
Prior injection, surgery, or hospitalization for low back pain, % Yes
12 10 10 11 11
Any medication use in past week
% None 38 38 37 35 37 % Narcotics 11 13 11 13 12 % Other 51 49 53 52 51
Mental health
SF-36 Mental Health component score, mean (s.d.)
53 (8) 54 (8) 54 (7) 53 (8) 53 (8)
Self-efficacy and Expectations
Likelihood of self-managing future back pain, % Very likely
3 2 8 6 5
Expectation of acupuncture helpfulness (0-10 scale)
% Lower two tertiles (0-7) 57 53 56 49 54 % Top tertile (8-10) 25 24 28 33 28 % Could not rate 18 23 16 18 19 * Includes homemaker, student, unemployed, and retired.
none,) and pain below the knee (yes vs. no). Mental health status was measured by the Mental Component Score of the SF-36 and self-efficacy and expectation of acu-puncture helpfulness were categorized as reported in the previous paragraph.
Because important outcomes among persons with back pain include both functional improvement and symptom relief in the near and long-term, we constructed four sep-arate ordinary least squares linear regression models to explore whether functional status or symptoms changed in response to acupuncture or simulated acupuncture treatment: dysfunction (Roland score) and bothersome-ness score at both 8 and 52 weeks. These four initial mod-els evaluated which of the 15 candidate variables predicted change in one of the outcomes at a specific time point. In addition to the 15 candidate variables described above, we included treatment group.
We then constructed reduced models for each of the four outcome/time points. These models included only those variables that were significant predictors of outcome at α ≤ 0.05 (for a two tailed test) in at least one of the initial models. We also chose, a priori, to include gender and expectation of acupuncture helpfulness because gender is often related to outcome and many other studies have found patient expectations for a treatment associated with better outcomes among those who received it [22-25]. The reduced models also included interaction terms between each treatment group and all other independent variables. This allowed us to test the hypothesis that specific predic-tor variables could predict response to different acupunc-ture treatments. Because of the large number of
comparisons, we only report interactions where α≤ 0.01
for a two tailed test. Furthermore, we looked for consist-ency of the interactions among both acupuncture groups and the simulated acupuncture group to rule out spurious results that might occur for one group, but not the other acupuncture groups.
Finally, we decided to test whether the percentage change in the dysfunction outcome at 8 weeks was constant over the range of baseline values for each of the three acupunc-ture or simulated acupuncacupunc-ture groups. We used a log transformation of our data, first adding a constant value of 1 to the dysfunction score to eliminate values equal to zero. Therefore, the model we tested was: log10 [(Roland at 8 weeks + 1)/(Roland at baseline + 1)] = (log10(Roland at 8-weeks + 1) - log10(Roland at baseline + 1)). All data were analyzed using SAS/STAT version 9.1 [26].
Results
Baseline Predictors of Outcome
Treatment group and six of the 15 potential predictor var-iables were significant predictors of changes in outcome in at least one of the four models (Tables 2 and 3).
Treat-ment group and baseline dysfunction score were signifi-cant in three of the four models. Persons receiving acupuncture or simulated acupuncture improved more in function than those who received usual care at both 8 and 52 weeks and in symptom reduction at 8 weeks. Higher baseline dysfunction scores were associated with worse dysfunction scores at both 8 and 52 weeks and with worse bothersomeness scores at 52 weeks. Higher baseline both-ersomeness scores predicted higher bothboth-ersomeness scores at both 8 and 52 weeks. Use of narcotics was asso-ciated with worse functional and symptom outcomes at 52 weeks. No other measures were found to be significant predictors of outcome in more than one of the four mod-els.
Interaction between Baseline Predictor Variables and Treatment Response
significant interactions between predictor variables and treatment group.
Discussion
This secondary data analysis found that persons with more severe pre-treatment back dysfunction demon-strated the greatest benefits from acupuncture or simu-lated acupuncture treatment, as measured by changes on the Roland score. Few other significant interactions emerged and none were consistent for both short and long term follow-ups. Regression to the mean is probably responsible for some of the greater improvement after 8 weeks in members of the usual care group with the worst back pain, given our finding that individuals in the usual care group improved more if their baseline dysfunction scores were worse. However, this phenomenon is unlikely to explain why the difference between usual care and acu-puncture at 8 weeks increased as the baseline dysfunction scores increased. Thus, we have demonstrated interaction on an additive scale with the measurement of the Roland scores as absolute changes from baseline. This may merely reflect the greater opportunity for absolute change in those with higher baseline Roland scores. However, looked at from the perspective of relative percentage
change from baseline, which is consistent with working on a multiplicative scale, the acupuncture (and simulated acupuncture) groups reduced their dysfunction approxi-mately 30% more than did the usual care group - no mat-ter what the baseline dysfunction score actually was. Thus, there was no interaction on the multiplicative scale. In fact, the measurement of interaction here, as is commonly found, depends on the scale that is being used.
[image:5.612.56.567.97.402.2]Our findings are generally consistent with those of the few prior studies attempting to identify subgroups of individ-uals who respond best to specific treatments for back pain. Typically, these studies report few strong and consistent characteristics that identify subgroups of treatment responders for a specific intervention [15,27]. However, most of these studies are not large enough to identify all but the strongest interactions. In one of the largest prag-matic trials of acupuncture for chronic back pain includ-ing over 2000 patients, Witt et al [28] found that 3 of 9 evaluated characteristics of patients (younger age, worse baseline back dysfunction, more than 10 years of educa-tion) were effect modifiers indicating better response to acupuncture. One of the challenges in comparing results across studies is that studies typically assess a somewhat
Table 2: Multivariate analysis of overall predictors of back related dysfunction (Roland score)
Roland score*
8-week 52-week
Variable Categories β ** (SE) P-value β ** (SE) P-value
Baseline Roland score Continuous 0.43 (0.05) <.0001 0.56 (0.05) <.0001
Baseline bothersomeness score Continuous 0.10 (0.10) 0.30 0.001 (0.10) 0.99 Any disability Yes vs. No 0.78 (0.46) 0.09 0.01 (0.49) 0.99 SF-36 Mental Health score Continuous -0.02 (0.01) 0.17 -0.01 (0.01) 0.58 Age Continuous -0.01 (0.02) 0.51 0.02 (0.02) 0.33 Gender Female vs. Male 0.42 (0.41) 0.32 0.37 (0.44) 0.39 Education level College graduate, Yes vs. No -0.19 (0.42) 0.65 -0.81 (0.44) 0.07 Employment Heavy lifting job vs. Unemployed -0.16 (0.70) 0.81 -1.76 (0.74) 0.16
Light/Medium lifting job vs. Unemployed -0.53 (0.57) -1.22 (0.60) Sedentary job vs. Unemployed -0.61 (0.59) -0.86 (0.63) Employment unknown vs. Unemployed -1.07 (1.84) -0.93 (1.90)
Medication use Narcotics vs. None 0.43 (0.69) 0.81 1.77 (0.73) 0.04 Other vs. None 0.02 (0.43) 0.12 (0.46)
Self-efficacy High vs. Low 0.61 (0.93) 0.51 -0.20 (1.00) 0.84 Expectation of acup. help Top tertile vs. Lower two tertiles -0.58 (0.47) 0.42 -0.23 (0.50) 0.55
Could not rate vs. Lower two tertiles -0.44 (0.53) 0.45 (0.56)
Duration of chronic LBP >= 1 y vs. <1 y 0.24 (0.45) 0.60 0.49 (0.48) 0.30 Pain travels below knee Yes vs. No -0.02 (0.51) 0.98 -0.37 (0.54) 0.50 Days of LBP in last 3 mo Continuous 0.02 (0.01) 0.10 0.01 (0.01) 0.46 Intense LBP treatment Yes vs. No 1.20 (0.63) 0.06 0.51 (0.66) 0.44 Treatment group Individualized acupuncture vs. Usual care -2.38 (0.56) <.0001 -2.21 (0.59) 0.001
Standardized acupuncture vs. Usual care -2.44 (0.55) -1.81 (0.58)
Simulated acupuncture vs. Usual care -2.86 (0.55) -1.03 (0.58)
* For ease of identification, all independent variables with P < 0.5 are in boldface type
different list of possible characteristics as potential mod-erators of response to treatment.
Our finding that treatment expectations did not pre-dict response to specific types of acupuncture differs from the findings of previous researchers. Kalauokalani [22] and Linde [23] both found that more optimistic expecta-tions of treatment led to better outcomes from acupunc-ture. Thomas's [29] results were more complex. She found no benefit of acupuncture over usual care for persons with positive beliefs about acupuncture, but found acupunc-ture more effective for those who were agnostic about its benefits.
The results of these trials cannot be directly compared to our study because of differences in the way the data were collected and analyzed. However, our finding that indi-viduals who could not provide a rating of their expecta-tion of acupuncture's effectiveness did not have worse outcomes clearly demonstrates that our findings are dif-ferent than those of Linde [23]. In that study, participants who could not rate their expectation of acupuncture's effectiveness did worse than the others, who nearly always believed that acupuncture would be "effective" or "very effective". Given the variability in the findings across these
studies, further research is needed to understand the dif-ferent effects of pre-treatment expectations on outcomes of acupuncture care.
Our study has a number of limitations. For one thing, our study only explored characteristics of individuals that were predictive of superior outcomes for acupuncture (or a type of acupuncture) versus usual care. Conceivably, our findings may have differed had we used a different com-parison group. We did not collect data on fear avoidance, which is associated with poor prognosis in some data sets [27]. If patients with higher levels of fear avoidance were less likely to improve from acupuncture, our lack of infor-mation on this variable would be a limitation of our study.
Our study was large and high follow-up rates. However, the samples sizes required to detect interactions must be four times larger than that required for detecting a main effect of similar magnitude [30]. Thus, we would be able to detect only large interactions.
[image:6.612.57.558.98.400.2]Finally, as with all post-hoc analyses, the results must be interpreted with caution and need to be replicated in other data sets. We suspect that replication would best be
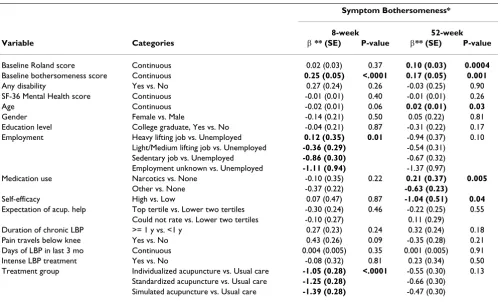
Table 3: Multivariate analysis of overall predictors of Symptom Bothersomeness score
Symptom Bothersomeness*
8-week 52-week
Variable Categories β ** (SE) P-value β** (SE) P-value
Baseline Roland score Continuous 0.02 (0.03) 0.37 0.10 (0.03) 0.0004
Baseline bothersomeness score Continuous 0.25 (0.05) <.0001 0.17 (0.05) 0.001
Any disability Yes vs. No 0.27 (0.24) 0.26 -0.03 (0.25) 0.90 SF-36 Mental Health score Continuous -0.01 (0.01) 0.40 -0.01 (0.01) 0.26 Age Continuous -0.02 (0.01) 0.06 0.02 (0.01) 0.03
Gender Female vs. Male -0.14 (0.21) 0.50 0.05 (0.22) 0.81 Education level College graduate, Yes vs. No -0.04 (0.21) 0.87 -0.31 (0.22) 0.17 Employment Heavy lifting job vs. Unemployed 0.12 (0.35) 0.01 -0.94 (0.37) 0.10
Light/Medium lifting job vs. Unemployed -0.36 (0.29) -0.54 (0.31) Sedentary job vs. Unemployed -0.86 (0.30) -0.67 (0.32) Employment unknown vs. Unemployed -1.11 (0.94) -1.37 (0.97)
Medication use Narcotics vs. None -0.10 (0.35) 0.22 0.21 (0.37) 0.005
Other vs. None -0.37 (0.22) -0.63 (0.23)
Self-efficacy High vs. Low 0.07 (0.47) 0.87 -1.04 (0.51) 0.04
Expectation of acup. help Top tertile vs. Lower two tertiles -0.30 (0.24) 0.46 -0.22 (0.25) 0.55 Could not rate vs. Lower two tertiles -0.10 (0.27) 0.11 (0.29)
Duration of chronic LBP >= 1 y vs. <1 y 0.27 (0.23) 0.24 0.32 (0.24) 0.18 Pain travels below knee Yes vs. No 0.43 (0.26) 0.09 -0.35 (0.28) 0.21 Days of LBP in last 3 mo Continuous 0.004 (0.005) 0.35 0.001 (0.005) 0.91 Intense LBP treatment Yes vs. No -0.08 (0.32) 0.81 0.23 (0.34) 0.50 Treatment group Individualized acupuncture vs. Usual care -1.05 (0.28) <.0001 -0.55 (0.30) 0.13
Standardized acupuncture vs. Usual care -1.25 (0.28) -0.66 (0.30) Simulated acupuncture vs. Usual care -1.39 (0.28) -0.47 (0.30) * For ease of identification, all independent variables with P < 0.5 are in boldface type
undertaken in the context of a meta-analysis using indi-vidual patient level data from all included studies, as that would increase the sample size substantially [31]. The Acupuncture Trialist Collaboration, a new international collaboration among researchers to share data and con-duct meta-analyses from large trials of acupuncture for pain, may be well-suited to conduct such analyses.
Researchers have employed two different approaches in their attempts to identify sub-groups of persons with low back pain that would benefit from specific treatments. Some studies, including ours, have searched for sub-groups using regression analyses to see what
characteris-tics are associated with superior outcomes for specific treatments. Others have developed "clinical prediction rules" wherein patients are initially categorized into more homogenous groups based on clinical findings and pain history. Such rules can then be tested in studies where patients are given treatments that are matched to the type of treatment that is believed better able to address their underlying problem [32]. For example, Childs [11] used this approach to validate a clinical prediction rule for spi-nal manipulation.
Clinical prediction rules have yet to be identified for acu-puncture. In principle, various Chinese medicine
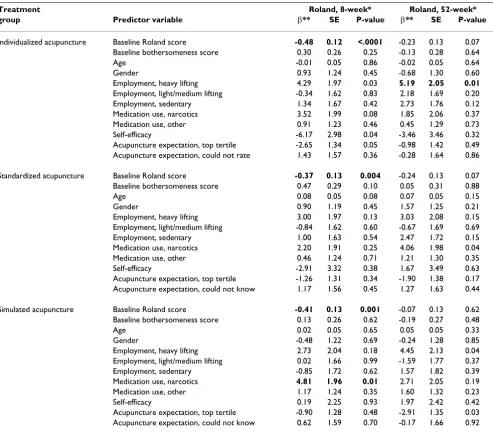
find-Table 4: Interaction between treatment group and significant baseline predictor variables for back related dysfunction (Roland score).
Treatment Roland, 8-week* Roland, 52-week*
group Predictor variable β** SE P-value β** SE P-value
Individualized acupuncture Baseline Roland score -0.48 0.12 <.0001 -0.23 0.13 0.07 Baseline bothersomeness score 0.30 0.26 0.25 -0.13 0.28 0.64 Age -0.01 0.05 0.86 -0.02 0.05 0.64 Gender 0.93 1.24 0.45 -0.68 1.30 0.60 Employment, heavy lifting 4.29 1.97 0.03 5.19 2.05 0.01
Employment, light/medium lifting -0.34 1.62 0.83 2.18 1.69 0.20 Employment, sedentary 1.34 1.67 0.42 2.73 1.76 0.12 Medication use, narcotics 3.52 1.99 0.08 1.85 2.06 0.37 Medication use, other 0.91 1.23 0.46 0.45 1.29 0.73 Self-efficacy -6.17 2.98 0.04 -3.46 3.46 0.32 Acupuncture expectation, top tertile -2.65 1.34 0.05 -0.98 1.42 0.49 Acupuncture expectation, could not rate 1.43 1.57 0.36 -0.28 1.64 0.86 Standardized acupuncture Baseline Roland score -0.37 0.13 0.004 -0.24 0.13 0.07 Baseline bothersomeness score 0.47 0.29 0.10 0.05 0.31 0.88 Age 0.08 0.05 0.08 0.07 0.05 0.15 Gender 0.90 1.19 0.45 1.57 1.25 0.21 Employment, heavy lifting 3.00 1.97 0.13 3.03 2.08 0.15 Employment, light/medium lifting -0.84 1.62 0.60 -0.67 1.69 0.69 Employment, sedentary 1.00 1.63 0.54 2.47 1.72 0.15 Medication use, narcotics 2.20 1.91 0.25 4.06 1.98 0.04 Medication use, other 0.46 1.24 0.71 1.21 1.30 0.35 Self-efficacy -2.91 3.32 0.38 1.67 3.49 0.63 Acupuncture expectation, top tertile -1.26 1.31 0.34 -1.90 1.38 0.17 Acupuncture expectation, could not know 1.17 1.56 0.45 1.27 1.63 0.44 Simulated acupuncture Baseline Roland score -0.41 0.13 0.001 -0.07 0.13 0.62 Baseline bothersomeness score 0.13 0.26 0.62 -0.19 0.27 0.48 Age 0.02 0.05 0.65 0.05 0.05 0.33 Gender -0.48 1.22 0.69 -0.24 1.28 0.85 Employment, heavy lifting 2.73 2.04 0.18 4.45 2.13 0.04 Employment, light/medium lifting 0.02 1.66 0.99 -1.59 1.77 0.37 Employment, sedentary -0.85 1.72 0.62 1.57 1.82 0.39 Medication use, narcotics 4.81 1.96 0.01 2.71 2.05 0.19 Medication use, other 1.17 1.24 0.35 1.60 1.32 0.23 Self-efficacy 0.19 2.25 0.93 1.97 2.42 0.42 Acupuncture expectation, top tertile -0.90 1.28 0.48 -2.91 1.35 0.03 Acupuncture expectation, could not know 0.62 1.59 0.70 -0.17 1.66 0.92 * For ease of identification, all independent variables with P < 0.5 are in boldface type
[image:7.612.61.554.99.531.2]ings, including Chinese medicine diagnosis, might be useful for developing such a rule. In practice, however, progress in this area has been limited because there is typ-ically poor diagnostic concordance among TCM practi-tioners [33,34] and because individual patients with chronic low back pain are often given multiple TCM diag-nostic labels [34,35].
Thoughtful collaboration among practitioners and researchers may ultimately lead to the development of prediction rules that match patients to the most appropri-ate health care provider. Such collaborations are most
likely to be fruitful if they initially focus on developing comprehensive models that incorporate the physiological underpinnings of the biopsychosocial model [36].
Conclusion
This analysis found little evidence for the existence of sub-groups of patients with chronic back pain that would be especially likely to benefit from acupuncture. The only statistically significant and consistent finding was that persons starting with greater back dysfunction improved the most from acupuncture or simulated acupuncture after 8 weeks, in terms of change score, although the
per-Table 5: Interaction between treatment group and significant baseline predictor variables for Symptom Bothersomeness score
Bothersomeness, 8-week*
Bothersomeness, 52-week*
Treatment group Predictor variable β** SE P-value β** SE P-value
Individualized acupuncture Baseline Roland score -0.15 0.06 0.01 -0.09 0.07 0.16 Baseline bothersomeness score 0.04 0.13 0.74 0.02 0.14 0.87 Age 0.03 0.02 0.23 0.01 0.03 0.60 Gender 0.11 0.62 0.86 0.17 0.67 0.80 Employment, heavy lifting 1.97 0.99 0.05 2.51 1.06 0.02 Employment, light/medium lifting -0.70 0.81 0.39 1.35 0.87 0.12 Employment, sedentary 0.52 0.84 0.54 1.20 0.91 0.19 Medication use, narcotics 0.35 1.00 0.72 0.14 1.06 0.90 Medication use, other 0.36 0.61 0.55 -0.06 0.67 0.93 Self-efficacy -2.21 1.49 0.14 -1.52 1.78 0.40 Acupuncture expectation, top tertile -1.10 0.67 0.10 -1.44 0.73 0.051 Acupuncture expectation, could not know -0.27 0.79 0.73 -0.17 0.85 0.84 Standardized acupuncture Baseline Roland score -0.05 0.06 0.39 -0.06 0.07 0.39 Baseline bothersomeness score -0.06 0.15 0.69 -0.09 0.16 0.57 Age 0.04 0.02 0.09 0.04 0.03 0.15 Gender 0.38 0.60 0.52 0.78 0.64 0.23 Employment, heavy lifting 0.87 0.99 0.38 0.68 1.07 0.53 Employment, light/medium lifting -1.28 0.81 0.12 -0.55 0.87 0.53 Employment, sedentary 0.18 0.82 0.83 0.40 0.89 0.65 Medication use, narcotics 1.01 0.96 0.29 0.44 1.02 0.67 Medication use, other 0.07 0.62 0.91 0.05 0.67 0.94 Self-efficacy -1.82 1.66 0.27 -1.30 1.80 0.47 Acupuncture expectation, top tertile -0.68 0.66 0.30 -0.87 0.71 0.22 Acupuncture expectation, could not know 0.35 0.79 0.66 0.70 0.84 0.41 Simulated acupuncture Baseline Roland score -0.22 0.06 0.0005 0.02 0.07 0.79 Baseline bothersomeness score -0.08 0.13 0.56 -0.10 0.14 0.46 Age 0.04 0.02 0.07 0.05 0.03 0.08 Gender 0.03 0.61 0.96 0.14 0.66 0.83 Employment, heavy lifting 2.10 1.02 0.04 0.97 1.10 0.38 Employment, light/medium lifting 0.70 0.83 0.40 0.05 0.91 0.96 Employment, sedentary 0.07 0.86 0.94 1.03 0.94 0.27 Medication use, narcotics 2.49 0.98 0.01 -0.19 1.06 0.86 Medication use, other 0.70 0.62 0.26 -0.09 0.68 0.89 Self-efficacy -0.75 1.13 0.51 0.28 1.25 0.82 Acupuncture expectation, top tertile 0.27 0.64 0.67 -1.29 0.69 0.06 Acupuncture expectation, could not know -0.16 0.80 0.84 0.75 0.86 0.38 * For ease of identification, all independent variables with P < 0.5 are in boldface type
[image:8.612.59.555.96.543.2]centage improvement from baseline was consistent all lev-els of baseline dysfunction. Future studies are needed to confirm the findings of this post-hoc analysis.
Competing interests
The authors declare that they have no competing interests.
Authors' contributions
KJS, ALA, RAD were involved in the conceptualization and design of the analysis involved in this report; LI and WEB conducted the analysis; all authors were involved in inter-pretation of the findings; KJS, DCC, LI and WEB drafted the manuscript and all authors read and approved the final manuscript.
Acknowledgements
The National Center for Complementary and Alternative Medicine (NCCAM) funded this study through a Cooperative Agreement (U01 AT 001110). Dr. Partap Khalsa, Project Officer for NCCAM, was involved in the analysis and interpretation of data and review and approval of the man-uscript. The contents of this publication are solely the responsibility of the authors and do not necessarily represent the official views of NCCAM.
We also thank Lhasa OMS, Weymouth Massachusetts, for donating the Sei-rin acupuncture needles used in this study. We also thank the original mem-bers of the SPINE study team for their contributions to the conduct of the trial.
References
1. Sternbach RA: Survey of Pain in the United States: The Nuprin Pain Report. Clin J Pain 1986, 2:49-53.
2. Martin BI, Deyo RA, Mirza SK, Turner JA, Comstock BA, Holling-worth W, Sullivan SD: Expenditures and health status among adults with back and neck problems. JAMA 2008, 299(6):656-664.
3. Frymoyer JW: Back pain and sciatica. N Engl J Med 1988, 318(5):291-300.
4. Luo X, Pietrobon R, Sun SX, Liu GG, Hey L: Estimates and pat-terns of direct health care expenditures among individuals with back pain in the United States. Spine 2004, 29(1):79-86. 5. Stewart WF, Ricci JA, Chee E, Morganstein D, Lipton R: Lost
pro-ductive time and cost due to common pain conditions in the US workforce. JAMA 2003, 290(18):2443-2454.
6. Deyo RA: Treatments for back pain: can we get past trivial effects? Ann Intern Med 2004, 141(12):957-958.
7. Haldeman S, Dagenais S: A supermarket approach to the evi-dence-informed management of chronic low back pain. Spine J 2008, 8(1):1-7.
8. Waddell G: Subgroups within "nonspecific" low back pain. J
Rheumatol 2005, 32(3):395-396.
9. Kent P, Keating J: Do primary-care clinicians think that nonspe-cific low back pain is one condition? Spine 2004, 29(9):1022-1031.
10. Vlaeyen JW, Morley S: Cognitive-behavioral treatments for chronic pain: what works for whom? Clin J Pain 2005, 21(1):1-8. 11. Childs JD, Fritz JM, Flynn TW, Irrgang JJ, Johnson KK, Majkowski GR, Delitto A: A clinical prediction rule to identify patients with low back pain most likely to benefit from spinal manipula-tion: a validation study. Ann Intern Med 2004, 141(12):920-928. 12. Henschke N, Maher CG, Refshauge KM, Herbert RD, Cumming RG,
Bleasel J, York J, Das A, McAuley JH: Prognosis in patients with recent onset low back pain in Australian primary care: incep-tion cohort study. BMJ 2008, 337:a171.
13. Pincus T, Burton AK, Vogel S, Field AP: A systematic review of psychological factors as predictors of chronicity/disability in prospective cohorts of low back pain. Spine 2002, 27(5):E109-120.
14. Kent PM, Keating JL: Can we predict poor recovery from recent-onset nonspecific low back pain? A systematic review.
Man Ther 2008, 13(1):12-28.
15. Underwood MR, Morton V, Farrin A: Do baseline characteristics predict response to treatment for low back pain? Secondary analysis of the UK BEAM dataset [ISRCTN32683578].
Rheu-matology (Oxford) 2007, 46(8):1297-1302.
16. Burton AK, Waddell G, Tillotson KM, Summerton N: Information and advice to patients with back pain can have a positive effect. A randomized controlled trial of a novel educational booklet in primary care. Spine 1999, 24(23):2484-2491. 17. Cherkin DC, Sherman KJ, Avins AL, Erro JH, Ichikawa L, Barlow WE,
Delaney K, Hawkes R, Hamilton L, Pressman A, et al.: A rand-omized trial comparing acupuncture, simulated acupunc-ture, and usual care for chronic low back pain. Arch Intern Med
2009, 169(9):858-866.
18. Cherkin DC, Sherman KJ, Hogeboom CJ, Erro JH, Barlow WE, Deyo RA, Avins AL: Efficacy of acupuncture for chronic low back pain: protocol for a randomized controlled trial. Trials 2008, 9:10.
19. Riess P: Current estimates from the national health interview survey: United States, 1984. Hyattsville, MD: National Center for Health Statistics DHHS publication PHS 86-1584; 1986. Vital and health statistics; 10;156.
20. Roland M, Morris R: A study of the natural history of back pain. Part I: development of a reliable and sensitive measure of disability in low-back pain. Spine 1983, 8(2):141-144.
21. Ware JEJ: SF-36 health survey update. Spine 2000, 25(24):3130-3139.
22. Kalauokalani D, Cherkin DC, Sherman KJ, Koepsell TD, Deyo RA: Lessons from a trial of acupuncture and massage for low back pain: patient expectations and treatment effects. Spine
2001, 26(13):1418-1424.
23. Linde K, Witt CM, Streng A, Weidenhammer W, Wagenpfeil S, Brinkhaus B, Willich SN, Melchart D: The impact of patient expectations on outcomes in four randomized controlled
[image:9.612.55.281.96.248.2]tri-Predicted values of the 8-week dysfunction score (Roland score) by baseline dysfunction score (Roland score) for each treatment group
Figure 1
Predicted values of the 8-week dysfunction score (Roland score) by baseline dysfunction score (Roland score) for each treatment group. The predicted values are adjusted for baseline values of: Roland score, bother-someness score, and age (as continuous variables); gender, employment type, medication use, acupuncture expectation, self-efficacy, and group (as categorical variables); and interac-tion between baseline Roland score and treatment group. The adjusted means assume a mean age of 47 years, bother-someness = 5, and equal weighting in each level of the cate-gorical covariates. 0 2 4 6 8 10 12 14 16 18 20
0 2 4 6 8 10 12 14 16 18 20 22 Roland Score at baseline
Publish with BioMed Central and every scientist can read your work free of charge
"BioMed Central will be the most significant development for disseminating the results of biomedical researc h in our lifetime."
Sir Paul Nurse, Cancer Research UK
Your research papers will be:
available free of charge to the entire biomedical community
peer reviewed and published immediately upon acceptance
cited in PubMed and archived on PubMed Central
yours — you keep the copyright
Submit your manuscript here:
http://www.biomedcentral.com/info/publishing_adv.asp
BioMedcentral
als of acupuncture in patients with chronic pain. Pain 2007, 128(3):264-271.
24. Smeets R: Active Rehabilitation for Chronic Low Back Pain: Cognitive-behavioral, Physical or Both? Maastricht: Maastricht University; 2006.
25. Smeets RJ, Beelen S, Goossens ME, Schouten EG, Knottnerus JA, Vlaeyen JW: Treatment expectancy and credibility are associ-ated with the outcome of both physical and cognitive-behav-ioral treatment in chronic low back pain. Clin J Pain 2008, 24(4):305-315.
26. SAS Institute I: SAS/STAT® 9.1 User's Guide. Cary, NC: SAS
Institute, Inc; 2004.
27. Klaber Moffett JA, Carr J, Howarth E: High fear-avoiders of phys-ical activity benefit from an exercise program for patients with back pain. Spine 2004, 29(11):1167-1172. discussion 1173. 28. Witt CM, Jena S, Selim D, Brinkhaus B, Reinhold T, Wruck K, Liecker
B, Linde K, Wegscheider K, Willich SN: Pragmatic Randomized Trial Evaluating the Clinical and Economic Effectiveness of Acupuncture for Chronic Low Back Pain. Am J Epidemiol 2006, 164(5):487-96.
29. Thomas KJ, MacPherson H, Thorpe L, Brazier J, Fitter M, Campbell MJ, Roman M, Walters SJ, Nicholl J: Randomised controlled trial of a short course of traditional acupuncture compared with usual care for persistent non-specific low back pain. BMJ 2006, 333(7569):623.
30. Brookes ST, Whitely E, Egger M, Smith GD, Mulheran PA, Peters TJ: Subgroup analyses in randomized trials: risks of subgroup-specific analyses; power and sample size for the interaction test. J Clin Epidemiol 2004, 57(3):229-236.
31. Stewart LA, Parmar MK: Meta-analysis of the literature or of individual patient data: is there a difference? Lancet 1993, 341(8842):418-422.
32. Hebert J, Koppenhaver S, Fritz J, Parent E: Clinical prediction for success of interventions for managing low back pain. Clin
Sports Med 2008, 27(3):463-479. ix-x.
33. Hogeboom CJ, Sherman KJ, Cherkin DC: Variation in diagnosis and treatment of chronic low back pain by traditional Chi-nese medicine acupuncturists. Complement Ther Med 2001, 9(3):154-166.
34. Kalauokalani D, Sherman KJ, Cherkin DC: Acupuncture for chronic low back pain: diagnosis and treatment patterns among acupuncturists evaluating the same patient. South
Med J 2001, 94(5):486-492.
35. Sherman KJ, Cherkin DC, Hogeboom CJ: The diagnosis and treat-ment of patients with chronic low-back pain by traditional Chinese medical acupuncturists. J Altern Complement Med 2001, 7(6):641-650.
36. Langevin HM, Sherman KJ: Pathophysiological model for chronic low back pain integrating connective tissue and nervous sys-tem mechanisms. Med Hypotheses 2007, 68(1):74-80.
Pre-publication history
The pre-publication history for this paper can be accessed here: