Effects of Pivot Location and Reduced Pitch Rate on Pitching
Rectangular Flat Plates
Huai-Te Yu∗
National Defense University, 33551 Taoyuan, Taiwan, Republic of China and
Luis P. Bernal†
University of Michigan, Ann Arbor, Michigan 48109
DOI: 10.2514/1.J055244
This paper presents the results of an experimental investigation of the unsteady flow about pitching flat plates. Hydrodynamic force and two-dimensional particle image velocimetry measurements are reported for three pivot locations (leading edge, midchord, and trailing edge), reduced pitch rates from 0.022 to 0.39, and in still water, which corresponds to infinite reduced pitch rate. The wing has rectangular planform with effective aspect ratio 4, and the wing pitching motion is from 0 to 45 deg angle of attack. The relation between hydrodynamic force and vortical flow development as a function of pivot location and reduced pitch rate is discussed. Reasonable agreement is found between measured hydrodynamic force and quasi-steady potential flow theoretical results. Several vortical flow features are identified and discussed, including 1) the effect of pivot location and pitch acceleration on formation and evolution of vortical structures, 2) the impact of interaction between vortical flow structures on hydrodynamic force development, and 3) three-dimensional flow development and transient vortex development.
Nomenclature
AR = b2∕S, geometric aspect ratio (equal to 2), m
ARe = 2AR, effective aspect ratio, m a = lift slope for finite aspect-ratio wing a0 = lift slope for two-dimensional airfoil
B = 2tp∕ta, ratio of pitch time to pitch acceleration time b = 2c, wetted span of the wing, m
CA = 2FA∕ρU2∞S, axial force coefficient CD = 2D∕ρU2∞S, drag coefficient CL = 2L∕ρU2∞S, lift coefficient
CN = 2FN∕ρU2∞S, normal force coefficient c = 0.0508, chord length of the wing, m
D = drag, N
dt = time between camera exposures
dx = particle displacement between camera exposures, pixel e = relaxation coefficient
FA = axial force, N FN = normal force, N
Fr = U∞∕gb0.5, Froude number
Fx = xcomponent of force in sensor frame of reference, N Fy = ycomponent of force in sensor frame of reference, N h = hold coefficient
K = 0.5cαm0∕U∞, reduced pitch rate L = lift, N
Re = U∞c∕ν, Reynolds number S = bc, wetted area of the wing,m2
St = αm0c2∕ν, Stokes number s = start coefficient
ta = αm0∕αm0 0, pitch acceleration time, s tc = c∕U∞, convective time, s tp = αm∕αm0, pitch time, s
t1 = first transition time point when a wing starts to pitch-up
in an unsmooth motion trace, s
t2 = second transition time point when a wing starts to hold
in an unsmooth motion trace, s
t3 = third transition time point when a wing starts to return in
an unsmooth motion trace, s
t4 = fourth transition time point when a wing returns back to
initial position in an unsmooth motion trace, s U∞ = constant freestream velocity,m∕s
w = angular frequency, Hz αm = maximum pitch angle, deg
α0
m = maximum pitch rate,deg∕s
α00
m = maximum pitch acceleration,deg∕s2
αt = pitch angle, deg α0t = pitch rate,deg∕s
α00t = pitch acceleration,deg∕s2
β = ratio of smoothing angle to the maximum pitch angle γ = ratio of margin acceleration to maximum pitch
acceleration during the smoothing Δt = half time for smoothing angle, s Δα = smoothing angle, deg
δ = induced drag factor ν = kinematic viscosity,m2∕s
κ = induced lift factor
τ = tp∕tc, ratio of pitch time to convective time
ω = vorticity,1∕s
I. Introduction
T
HE rapidly pitching airfoil or wing is a canonical flow capturing the influence of dynamic stall and flow separation on the flight performance and maneuverability of fixed- and rotary-wing aircraft [1–20]. For fixed-wing aircraft, the phenomenon of dynamic stall beneficially increases high-angle-of-attack maneuverability. Dynamic stall is characterized by formation of a large-scale vortex structure on the suction side of the wing. This vortex is regarded as a dynamic stall vortex [4,5,11,12,14,17] or leading-edge vortex [6,7,20]. For rotary-wing aircraft [21], to maintain the overall lift performance during high-speed forward flight, the angle of attack of the retreating blade must increase to compensate for the lower relative flow speed, which can lead to dynamic stall. More recently, rapidly pitching wings are found to play an important role in lift enhancement of flapping-wing aircraft [22,23]. For flapping wings, significant lift enhancement occurs during wing pronation or supination, Received 1 April 2016; revision received 19 August 2016; accepted forpublication 22 August 2016; published online 3 November 2016. Copyright © 2016 by the American Institute of Aeronautics and Astronautics, Inc. All rights reserved. All requests for copying and permission to reprint should be submitted to CCC at www.copyright.com; employ the ISSN 0001-1452 (print) or 1533-385X (online) to initiate your request. See also AIAA Rights and Permissions www.aiaa.org/randp.
*Assistant Professor, Department of Mechanical and Aerospace Engineering, Chung Cheng Institute of Technology; [email protected]. Member AIAA.
†Professor, Department of Aerospace Engineering; [email protected]. Member AIAA.
702 Vol. 55, No. 3, March 2017
accompanied by the formation of a leading-edge vortex (Gopalakrishnan and Tafti [24]). This lift is referred to as rotational lift by Walker [25] and Sane and Dickinson [26]. Sane [27] suggested that such rotational lift is caused by increased circulation about the wing associated with a constant rate of change of angle of attack, which was first described by Kramer [28] and is known as Kramer’s effect.
Harmonic and ramp-type pitching motions have been used to capture the unsteady flow dynamics of maneuvering wings. For harmonic pitching motion, the frequency of the motion determines the degree of unsteadiness. The corresponding nondimensional parameter is the reduced frequency (k0.5cw∕U∞), which characterizes the relative magnitude of unsteady effects compared to advection effects. In addition to the purely inertial forces resulting from acceleration of the fluid, unsteady effects result in unsteady production of vorticity and circulatory forces on airfoils and wings. These effects are captured in the classical unsteady analysis of Theodorsen as highlighted by Leishman [21] and many others that followed. The original work of Theodorsen is referred to [29]. However, for ramp-type pitching motions of interest in the current study, the pitch rateαm0 is constant. The relevant dimensionless parameter is the reduced pitch rate (K0.5cαm0∕U∞), where the constant pitch rate is used instead of the frequency. Similar to harmonic wing motions, as reduced pitch rate increases, unsteady effects become increasingly more important, both circulatory and noncirculatory.
Several flow features have been documented by investigators as a function of reduced pitch rate. Daely and Jumper [2] and Jumper et al. [10] reported surface pressure measurement on a NACA 0015 airfoil pivoted about the midchord that showed delayed stall; the airfoil lift vs angle of attack curve in unsteady flow follows the attached flow behavior well beyond the stall angle of attack for steady flow. Strickland and Graham [9] showed similar results for quarter-chord pivot. In these studies, reduced pitch rate variations were obtained by changing constant pitch rate or freestream velocity, or both. Graham and Strickland [8,11] reported maximum lift and drag coefficients linearly proportional to reduced pitch rate for the range 0.088≤K<1, derived from surface pressure measurements on a NACA 0015 airfoil at Re100;000 at quarter-chord pivot. Albertson et al. [14] examined similar NACA 0015 airfoil at Re60;000. They reported maximum values of lift and drag coefficients nonlinearly proportional to reduced pitch rate for K<0.1. The nonlinear correlation is not sensitive to pivot location. Francis and Keesee [3] found similar nonlinear trend of the maximum lift and drag coefficients with reduced pitch rate for a NACA 0012 airfoil. Furthermore, the work of Acharya and Metwally [17] showed that the role of leading-edge suction is as important as dynamic stall, from surface pressure measurements on a NACA 0012 airfoil and quarter-chord pivot. Unsteady boundary-layer flow reversal was investigated by Schreck et al. [20] using shear-stress measurements on a NACA 0015 airfoil at quarter-chord pivot. Unsteady effects on leading-edge suction and boundary-layer flow reversal were found to be susceptible to reduced pitch rate. In these studies, however, the effects of pivot location were not considered, which is of fundamental significance for the unsteady flow.
Data available in the literature on pivot location effects are insufficient and inconsistent. Albertson et al. [14] reported force data derived from surface pressure measurements on a NACA 0015 airfoil and note that pivot location affects lift-to-drag ratio only at angles of attack less than 20 deg before the maximum angle of attack of 60 deg forK0.01and 0.05. The reported change in lift-to-drag ratio is inconsistent with the change in pivot location. Helin and Walker [4] suggested that the effect of pivot location for a NACA 0015 airfoil is analogous to an increase of the pitch rate, based on tungsten-wire flow visualization and hot-wire near-surface velocity measurements. Jumper et al. [16] noted that the distance from the leading edge to the pivot point would be the characteristic length for flow separation on similar pitching NACA 0015 airfoil, instead of midchord concerned for mathematical models. Ol et al. [22] reported the phenomena of delayed formation of a typical leading-edge vortex (LEV) on the suction side of a flat plate atK0.7, from dye flow visualization, in response to the adjustment of pivot location from leading edge to trailing edge. Simultaneously, the growth of a vortex structure on the
pressure side of the flat plate is also present and is called pressure-side LEV. This unique vortex was not shown in the computational work of Visbal and Shang [30] and particle image velocimetry (PIV) data of Oshima and Ramaprian [19] on a NACA 0015 airfoil. Granlund et al. [31,32] reported the variation of force coefficients by pivot location effect, using direct force measurement on both two-dimensional flat plate and aspect ratio 2 flat plates. The character of pressure-side LEV to force generation yet remains to be clarified.
The ramp-type pitching motion experiences an inevitable acceleration at transition. Koochesfahani and Smiljanovski [33] experimentally discovered that the initial pitch acceleration duration has little impact on leading-edge separation as well as dynamic-stall vortex formation and downstream convection, using a NACA 0012 airfoil. Computationally, Gendrich et al. [34] revealed that the force caused by the initial pitch acceleration is constrained in the corresponding phases (i.e., the acceleration duration and angle of attack). The initial pitch acceleration has little influence on the rest of phases within constant pitch rate. The generated force within the phase of pitch acceleration is believed due to apparent mass effect [34]. However, the results of [33,34] were conducted using the same pivot location at quarter-chord. No work has been devoted to pivot location effect in apparent mass force generation.
The primary objective of the present paper is to experimentally establish the relationship of vortical structures with aerodynamic forces in terms of pivot location and reduced pitch rate. A finite wing is pitched rapidly from 0 to 45 deg angle of attack about three pivot locations at several constant pitch rates incorporated with freestream conditions in the water channel. Reduced pitch rateKranges from 0.022 to 0.39. The secondary objective is to understand apparent mass effect as a function of pivot location. The wing is pitched in tranquil water, which is analogous to hover flight but without plunging and feathering motions.
II. Experimental Approach
A. Water Channel and Wing Configuration
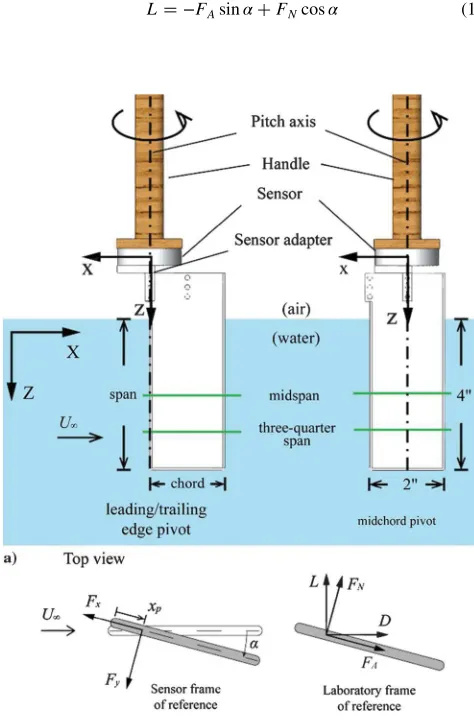
The experiments were conducted in a free-surface low-turbulence water channel facility at the University of Michigan. The test section walls were made of glass sheet. It has cross section dimensions of 61×61 cmand a length of 244 cm. Figure 1 shows a sketch of the facility.
The wing was a flat plate with rectangular planform. It has a 2 in. chord (c2 in:) and two-chord span (b2c) immersed in the water. The wing was made of plexiglass sheet with rounded edges and thickness of 0.125 in. The thickness-to-chord ratio is 0.0625. The wing was mounted vertically in the water channel at the center of the test section with the wing at 45 deg angle of attack. Therefore, the
Fig. 1 Sketch of water channel facility.
[image:2.585.305.543.543.744.2]final position of the wing for all the experiments was the same, and the initial position across the channel varied depending on pivot location. For force measurements, the wing was attached to the sensing side of a force transducer using a sensor adapter and clamped to a rotary table. The sensor adapter was made of aluminum and designed to minimize weight. The total mass attached to the sensor was 41.1 g, including the wing, the sensor adapter, and mounting screws. The force sensor was a Nano 43 transducer manufactured by ATI Industrial Automation. The maximum calibrated load and torque are 18 N and 250 N·mm, respectively, and the corresponding resolutions are1∕256 Nand1∕20 N·mm, the same for all three axes. The load and torque resolutions are 0.72 and 0.13% of the corresponding maximum measured values reported here.
As illustrated in Fig. 2a, the wing was pitched at three pivot locations: leading edge (LE), midchord (MC), and trailing edge (TE). The wing configuration for TE pivot is the same as that for LE pivot, with the wing rotated 180 deg to position the pivot axis at the downstream edge. The pivot axis was aligned with the symmetry axis of the force sensor to facilitate force data analysis. Three forces and three torques were measured in the sensor frame of reference, which has thexaxis in the chordwise direction, theyaxis normal to the wing surface, and thezaxis in the spanwise direction. Figure 2a shows the positive direction of the measured force components. Figure 2b shows typical side-view force diagrams. For LE and MC pivots, thex axis is positive upstream, and theyaxis is positive as indicated. For TE pivot, because of the 180 deg rotation, the positivexandyaxes are in the opposite direction compared to LE and MC pivots. The measured forcesFxandFyare first converted to axial and normal force componentsFAandFN, respectively, and then to liftLand drag D components in the laboratory frame of reference, and their corresponding force coefficientsCLandCD:
L−FAsinαFNcosα (1)
DFAcosαFNsinα (2)
CL2L∕ρU2∞S (3)
CD2D∕ρU2∞S (4)
B. Wing Kinematics
The wing kinematics is a linear ramp pitching motion from 0 deg to a maximum pitch angleαm. Figure 3 shows, from top to bottom, pitch angle αt, pitch rate α0t, and pitch acceleration α0 0t, successively. To minimize model vibration, the motion was smoothed at the transition cornersti, as illustrated att1throught4in
Fig. 3, using a smoothing function adapted from Eldredge et al. [35,36]. The function used here is
αt 0.5αm∕B X4
i1
−1i1lnfcoshBt−ti∕tpg (5)
In addition to the transition corner timesti, Eq. (5) introduces the pitch timetpand the parameterB, which defines the maximum pitch acceleration/deceleration at the transition corners. This expression differs from Eldredge et al. [35,36] in that it does not depend on the freestream velocity. In the cases considered here, the same kinematic is used with several flow speeds resulting in different reduced pitch rates.
The parameterBin Eq. (5) is the ratio of pitch timetpto pitch acceleration timeta. The parameterBis analogous toaαm∕2Kin the original formulation by Eldredge et al. [35,36] andAαm in our preliminary study [37], whereaandAare free parameters andKis the reduced pitch rate that will be described in the next section. As shown in Eq. (6),Bcan be specified by variablesβandγthat determine pitch acceleration:
B2αm∕αm0∕αm0∕αm0 0 2tp∕tacosh−1 1∕γ
p
∕β (6)
whereβis the ratio of pitch angle change during smoothing (Δα) to the maximum pitch angleαm, andγis the ratio of pitch acceleration at the beginning or end of the transitionjα0 0tiΔtjto maximum pitch accelerationαm0 0. Figure 3 provides an illustration of these parameters. The definitions ofβandγare
βΔα∕αm (7)
γ jα0 0t
i−Δtj∕αm0 0 jα0 0tiΔtj∕αm0 0 (8) As shown in Fig. 3, the wing kinematics consists of five phases: start phase, pitch-up phase, hold phase, pitch-return phase, and relaxation phase. The corresponding time durations are defined as follows:
tsstc (9)
tpαm∕αm0 (10)
thhtc (11)
teetc (12)
wheretcis the convective time. The variabless,h, andedetermine the duration of each phase.
For force measurement, the start duration was one convective time (s1); the hold duration was more than 68 convective times Fig. 2 Wing configuration for force measurement.
[image:3.585.40.277.376.739.2](h >68) to ensure steady state over the wing at maximum pitch angle; the relaxation duration was about 30 convective times (e30) to return to the undisturbed initial condition; the durations for pitch-up phase and pitch-return phase were the same. For PIV measurement during pitch-up, the hold duration was set to one convective time (h1) because no data were recorded after the pitch-up phase.
The wing was pitched at three constant pitch rates:αm0 76.4, 37.5, and12.6 deg∕s. The values ofB,βandγ, are given in Table 1. As shown in Table 1, both pitch time tp and maximum pitch acceleration αm0 0 vary with pitch rate αm0. However, the first two constant pitch rates have the same values of parametersBandβ; the last two have the same acceleration duration 2ta but different smoothing angleΔα. Auxiliary signals from motor controller were recorded during the experiments to monitor the wing kinematics for both force and PIV measurements.
The wing kinematics were implemented using a B4836TS rotary table manufactured by Velmex Inc., driven by a stepper motor (model RK266-03A-P1) and a motor controller (model VXM-1-1). The rotary table has a resolution of 40 steps per degree and a maximum pitch rate of100 deg∕s. The controller is programmed to execute motion commands of arbitrary angle increment and speed. In this study, the approach to generate motion commands is different from that used in [38]. Here, Eq. (5) was first discretized with a time step of 0.02 s and converted to motor steps. Then, neighboring points with the same pitch angle, speed, or acceleration were deleted. Finally, the angle increments and speed of the motion commands were determined from the remaining points. As a result, at least 10 points were used to capture the pitch motion during acceleration. The
motion commands execution was simulated and compared with the theoretical value given by Eq. (5) to verify the wing motion. Figure 4 shows an example of the wing kinematics with constant pitch rate of76.4 deg∕s.
C. Direct Force Measurement Test Cases and Data Processing For the present study, the two main independent parameters that define the unsteady flow are the freestream velocityU∞and the pitch rateαm0 introduced by the wing kinematics. NormalizingU∞andαm0 with combinations of wing chordcand fluid kinematic viscosityν, two independent and dimensionless parameters are obtained, the Reynolds number and the Stokes number:
RecU∞∕ν (13)
Stc2α0
m∕ν (14)
The Reynolds number gives the ratio of convective inertial force to viscous force in the flow. The Stokes number gives the ratio of unsteady forces to viscous forces. For the present experiments, the values of Reynolds and Stokes numbers are large, indicating that viscous effects are small. Consequently, at high Reynolds and Stokes numbers, the reduced pitch rateKis commonly employed (Daley and Jumper [2] and Strickland and Graham [9]) to characterize the flow behavior by a pitching wing with a constant pitch rateαm0in a uniform freestreamU∞. The definition ofKis
[image:4.585.134.454.44.328.2]Fig. 3 Illustration of wing kinematics of rectilinear pitch–hold–return motion.
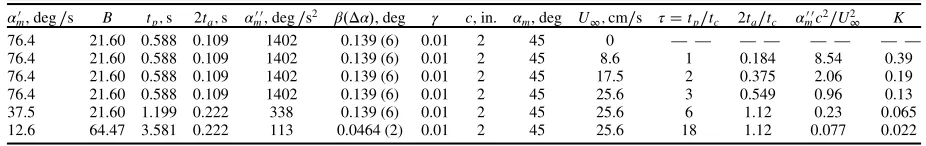
Table 1 Parameters for wing kinematic generation and freestream condition
α0
m,deg∕s B tp;s 2ta;s αm0 0,deg∕s2 βΔα, deg γ c, in. αm, deg U∞;cm∕s τtp∕tc 2ta∕tc αm0 0c2∕U2∞ K
76.4 21.60 0.588 0.109 1402 0.139 (6) 0.01 2 45 0 — — — — — — — —
76.4 21.60 0.588 0.109 1402 0.139 (6) 0.01 2 45 8.6 1 0.184 8.54 0.39
76.4 21.60 0.588 0.109 1402 0.139 (6) 0.01 2 45 17.5 2 0.375 2.06 0.19
76.4 21.60 0.588 0.109 1402 0.139 (6) 0.01 2 45 25.6 3 0.549 0.96 0.13
37.5 21.60 1.199 0.222 338 0.139 (6) 0.01 2 45 25.6 6 1.12 0.23 0.065
12.6 64.47 3.581 0.222 113 0.0464 (2) 0.01 2 45 25.6 18 1.12 0.077 0.022
[image:4.585.61.524.683.756.2]K0.5cαm0∕U∞0.5St∕Re0.5αmtc∕tp (15)
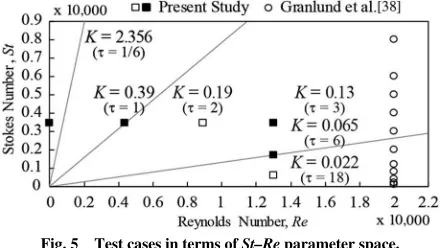
As noted in Eq. (15), K is proportional to the ratio of Stokes number to Reynolds number. Also, for a given maximum pitch angle αm,Kis proportional to the ratio of convective timetcto pitch timetp. It is useful to plot the cases listed in Table 1 in the Stokes number vs Reynolds number space shown in Fig. 5. In this plot, constant values of reduced pitch rateKare straight lines through the origin. As shown in Fig. 5, the value ofKincreases as the slope of the straight line increases.Kis also proportional to the ratio oftptotcdenoted byτ and shown in parentheses in Fig. 5. The limit case τ0 that corresponds to very fast pitching motion is of interest because advection effects are limited to the flow induced by the wing motion itself.
The square symbols in Fig. 5 are the test cases for unsteady force measurement, also shown in Table 1. Three uniform freestream velocities were considered:U∞8.6, 17.5, and 25.6 cm∕s. The corresponding Reynolds numbers areRe4400, 8900, and 13,000, respectively. Combined with three constant pitch rates, also shown in Table 1, give five reduced pitch rates:K0.022, 0.065, 0.13, 0.19, and 0.39. Because the maximum angle of attack (or maximum pitch angle)αmis specified to be 45 deg for all test cases, the longest pitch time is 18 convective times (τ18), and the shortest pitch time is one convective time (τ1). Moreover, the test case atU∞0 (τ0) for the fastest pitch rate was considered to examine questions of apparent mass force as well as linear superposition in flow topology and force development. In addition, steady force
measurements were conducted atRe8900, using the same wing at several angles of attack from 3 deg toαmin increments of 3 deg. All unsteady force measurements were repeated 60 times, and the results were phase-averaged. Steady values at each angle of attack were obtained by averaging samples over 15 s after80tc. Also shown in Fig. 5 are the cases considered by Granlund et al. [39] in their study of a pitching two-dimensional plate.
Force data acquisition and processing includes multiple steps. To avoid aliasing, the sampling frequency was 5 kHz in all cases, well above the cutoff frequency of the filters used in processing. The first data processing step was application of a digital low-pass filter to remove high-frequency noise associated with structural vibrations and electronic/sensor noise. A zero-phase first-order two-path Butterworth filter was used to avoid phase distortion, to reduce spurious oscillations introduced by the filter, and to provide sufficient attenuation of noise. The cutoff frequency was determined using spectral analysis of the pitch acceleration to retain 90% fluctuation signal content. This approach gives consistent filtering effects on force data for the various wing kinematics. Hence, the cutoff frequencies were 8.7, 4.3, and 4.15 Hz for wing kinematics of α0
m76.4, 37.5, and 12.6 deg∕s, respectively. The noise introduced by the rotary table motor was in the range of 100 to 600 Hz. The model vibration fundamental frequencies in air and in still water were about 50 and 15 Hz, respectively. These frequencies are significantly higher than the filter cutoff frequencies, and therefore they are removed by the filter.
The second step is the tare procedure used to remove 1) model weight contributions to the measured force, and 2) model inertia contributions to the measured force, which result in a static tare and dynamic tare, respectively. The static tares are measurements in air and still water at several fixed angles from 0 to 45 deg in 3 deg intervals. It was found that the present wing configuration yields negligible static tare because of the very small mass of the wing and mounting hardware. The dynamic tares are measurements in air with the same kinematics as that in the flow experiments. In the tare measurements, the same filter cutoff frequency was used as in the flow experiments. Because the density of air is very small compared to the water density, the measured forces in air can be assumed to be the model inertia contribution to the force measured in water. D. Two-Dimensional Particle Image Velocimetry Test Cases and Data Process
Test cases for PIV measurements are shown as square solid symbols in Fig. 5. The wing was pitched at two constant pitch rates: α0
m76.4 deg∕sand αm0 37.5 deg∕s. For αm0 76.4 deg∕s, the experiment was conducted atRe4400and 13,000, as well as in still waterRe0. For αm0 37.5 deg∕s, only dynamic flow at Re13;000 was investigated. Consequently, three reduced pitch rates are obtained:K0.065, 0.13, and 0.39.
The PIV system includes a double-pulsed Nd-YAG laser (Spectra Physics PIV 300), light sheet optics, a dual-frame digital camera (Cooke Corp. PCO.4000), a computer image acquisition system, and control electronics. The laser sheet was positioned normal to the pivot axis at two locations: the midspan and three-quarters span, shown as green horizontal lines in Fig. 2. The thickness of the laser sheet was about 0.8 mm. The water channel was seeded with titanium-dioxide particles (Sigma-Aldrich) with a diameter less than5μm. A small amount (∼1 cm3) of dispersant (DARVAN C-N, Vanderbilt) was
added to help produce a uniform particle distribution and increase the particle’s settling time. A sonicator was used to break down particles agglomerates and improve mixing quality. The camera was installed underneath the test section of the water channel and is equipped with a Nikon 105 mm Micro-Nikkor lens to produce a magnification of 16.1 pixel∕mm. As a result, the camera sensor frame of 4008 by 2672 pixels gives a field of view of 248 by 165 mm.
The time between camera exposures (dt) was selected to produce a particle displacementdxof two pixels to minimize particle loss due to spanwise flow. Values used are as follows: dt is 1.444 ms for U∞8.6 cm∕s and 0.4852 ms for U∞25.6 cm∕s. For measurements in still water, dt was determined based on the maximum surface speed along the wing chord. Actual values used are Fig. 4 Example of wing kinematic implementation.
Fig. 5 Test cases in terms ofSt–Reparameter space.
[image:5.585.40.282.41.294.2] [image:5.585.51.271.340.464.2]as follows: atαm0 76.4 deg∕s,dtis 1.843 ms for LE and TE and 3.687 ms for MC pivot.
An in-house-developed MATLAB-based PIV software was employed to analyze PIV data. The particle displacement in the field of view was determined using cross-correlation analysis on displaced interrogation windows. A two-pass analysis was implemented to increase the spatial resolution of the measurement [40]. The first pass uses a nondisplaced interrogation window of 64×64 pixels to estimate particle displacement at all points in the field. The particle displacement found in the first pass was then employed to displace a high-resolution interrogation window32×32 pixelsfor the second pass. Subpixel accuracy of the particle displacement measurements was obtained using a least-squares Gaussian fit of the correlation peak in a3×3 pixelstencil. The measured particle displacements were validated with two criteria: the correlation peak value had to be larger than the noise level in the cross-correlation function, and the value had to be within a window (search window) of expected values. The noise threshold was three times the standard deviation of cross-correlation values in the interrogation window. The search window size for low-resolution interrogation window and high-resolution window were6×6and4×4pixels, respectively. The PIV data were measured in a rectangular grid with 16 pixel spacing, giving a spatial resolution of approximately 1 mm. A3×3median filter was applied to remove outliers. The PIV data were phase-averaged over 60 images.
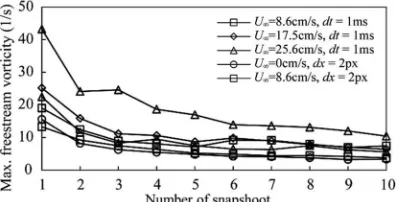
To determine the noise in the measured vorticity fields derived from PIV data, PIV images of the uniform flow without the wing installed in the test section were acquired. In this case, the measured vorticity should be zero, and analyses of these PIV fields provide a good quantitative measurement of the noise in the vorticity field. Figure 6 plots the maximum measured vorticity as a function of the number of PIV fields phase-averaged. For the present 60-image phase average, a vorticity noise of10 s−1is a reasonable estimate. In
the plots that follow, only vorticity values above this noise threshold are shown.
III. Glauert’s Theory for Finite Wing
To highlight the significance of unsteady flow effects due to reduced pitch rate, the force measurement data are compared with a well-established steady theory for the finite wing, as proposed by Glauert [41] and reinterpreted by Anderson [42]. Similar analysis was employed by Granlund et al. [39] for a two-dimensional flat plate in perching motion up to 90 deg angle of attack and Yu et al. [43] for the same two-dimensional flat plate in pitching motion at several maximum angles of attack under the same reduced pitch rateK0.2.
Suppose that the flow over a finite span wing of general planform is steady, incompressible, and inviscid. The lift coefficientCL and induced drag coefficientCDican be estimated by
CLaαa0α∕1 a0∕πARe1κ (16)
CD;iC2L1δ∕πARe (17)
whereais the lift slope for a finite-aspect-ratio wing,a0is the lift
slope for a two-dimensional airfoil,κis the induced lift factor, andδis
the induced drag factor. Followed by the approach by Glauert [41], the values ofδandκcan be obtained by
δ−1Xn
An∕μα 2
∕A1∕μα2; n2m−1 (18)
κ−1 μα∕A1−π∕4∕μ (19)
Equations (18) and (19) give the factors to characterize the departure from optimal elliptical lift distribution. The coefficientsAn are unknown values and need to be determined by
X
An∕αnμsin0.5 mπ∕psin0.5 nmπ∕p
μsin0.5 mπ∕p; m1;2;3; : : : ; p (20)
Equation (20) satisfies the static equilibrium of angle of attack of the wing (i.e., the geometric angle of attackαis equal to the sum of effective angle of attack and induced angle of attack). The induced angle of attack is contributed from induced velocity caused by steady free-trailing vortex filaments in the wake. For a detailed derivation of Eq. (20), refer to [41]. The integral value ofpin Eq. (20) has a physical meaning, which includes thepth circulation at thepth location at a uniformly spaced location from the center of the span to one wing tip. Then, it gives the same numbers ofAnto approximateκandδ. In Eqs. (18–20), the parameterμfor a flat plate of rectangular planform is defined by
μ0.25a0∕ARe (21)
The parameterARein Eq. (21) is the effective aspect ratio of the wing. For the testing configuration shown in Fig. 2, the free surface of the water channel is expected to behave like a plane of symmetry. In reality, the presence of surface waves deforms the water surface and may affect the force measurement. The effect of free surface can be studied using Froude number [44], which is given by
FrU∞∕pgb (22)
whereU∞is freestream velocity,gis gravitational acceleration, andbis the wing span immersed in the water. Hoerner [44] found that the effect of the surface wave is insignificant as Froude number closes to zero. The current testing configuration gives Froude number in a region of 0–0.256. This region of small Froude number suggests the value of effective aspect ratio could be assumed as 4 for the present study, twice the geometric aspect ratio of the experiment.
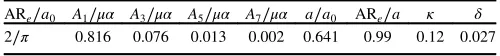
For a rectangular wing withARe4, the values ofδandκare found to be 0.027 and 0.12, respectively, by consideringp4in conformity with Glauert [41]. This value ofpincludes four locations to approximate the coefficientsAnas a function of the angle of attack
α. The coefficients in use are given in Table 2. On no account of effects of reduced pitch rate and pivot locations, the resultant theoretical results are steady and given by black solid curves, denoted by“Theory”in the following figures.
IV. Results and Discussion
A. Overview of Dynamic Flow by Pitching Wing
Figure 7 shows normal forceFNand axial forceFAas a function of convective time. The purpose is to ensure data quality and understand overall performance of dynamic flow by various time scales of disturbance. The solid, dashed, and dotted curves represent the wing kinematics ofαm0 76.4, 37.5, and12.6 deg∕s, respectively. The corresponding pitch angles are shown as the gray curve in the same freestream at Re13;000. The blue, green, and red curves correspond to the freestream at Re4400, 8900, and 13,000, respectively. These notations are also employed for the following figures if not otherwise specified.
Figure 7 shows macro time scale of force evolution. Close examinations are given and discussed in the following sections. In general, the normal force increases rapidly during the pitch-up Fig. 6 Comparison of vorticity variation in various freestream velocity.
[image:6.585.62.260.644.745.2]motion, followed by a decrease until a constant steady-state value is reached. The decrease of normal force shows some oscillatory behavior at early times in transition to the steady state, which is in phase with the axial force oscillation. The normal force bumps up at the same phase as a more negative axial force, which indicates an increasing axial force toward the leading edge. As revealed from the force data atK0.022–0.13, the transition behavior depends on the time scale of the disturbance of the wing to the freestream convection. Figure 7 also shows that the magnitude of the axial force is tenfold smaller than that of the normal force. The axial force reaches a steady-state value at the same convective time as the normal force (t∕tc>30). The axial force at steady state is negative, which implies forward force and significant leading-edge suction. The magnitude of the leading-edge suction force is very low compared to that estimation by potential theory, as expected for separated flow at the leading edge. It is not clear at this point how this suction force depends on the geometry of the leading edge; for example, a sharper leading edge may promote leading-edge suction. Note also that the force magnitudes for test cases at lowerRe8900 or 4400 are comparatively small due to small dynamic pressure contributed from freestream velocity.
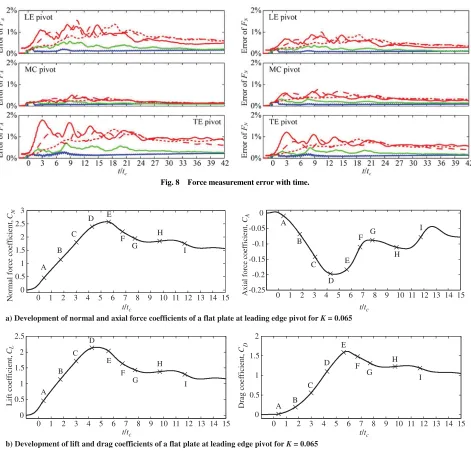
Figure 8 shows the distribution of measurement errors. The percentage of measurement error is the ratio of 95% confidence intervals of the measurement to the maximum measured force among the cases. The maximum force is 0.541 N measured from the test configuration of the pitching wing at LE pivot atK0.13. The measurement errors at selected phases are also shown as error bars in Fig. 7. The variation of measurement errors during wing motion is larger than that after a long relaxation to steady state.
These errors are promising in the flow with a higher freestream velocity and for test cases at LE and TE pivots. Nevertheless, all errors are in an order of 10 mN or less. For axial force, these errors are small but significantly compared to the measured force. For the normal force, these values are very small compared to the measured normal force.
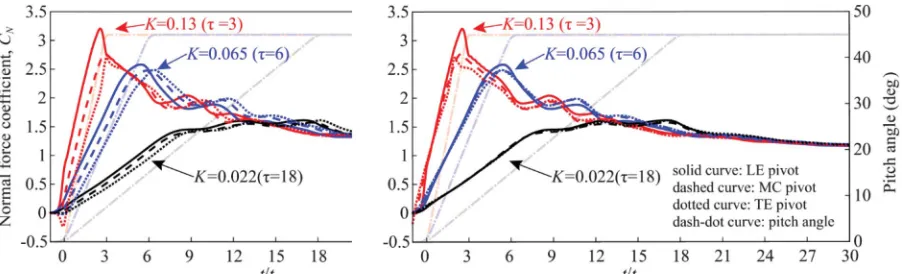
To understand the interrelation of vortical flow structures and force generation, a representative of force development is given in Fig. 9, and the corresponding PIV measurement is presented in Fig. 10. Figures 9 and 10 are results of the test case at LE pivot forK0.065. It is noted that either the direct force measurement or the PIV measurement was synchronized with the wing kinematics, not with the phase of flow shedding behaviors at wing initial angle of attack. As a result of phase averaging, only repetitive occurrences of dynamic flow structures associated with wing kinematics would be presented. The typical Kármán vortex street formed in the wake of the wing at an initial 0 deg angle of attack may not be captured clearly due to the effect similar to filtering by phase averaging.
[image:7.585.168.418.62.90.2]Figures 9 and 10 show that the increase of normal force is relative to the increasing size of the leading-edge vortex (LEV) and the shedding of the trailing-edge vortex (TEV). This is consistent with an increase of LEV suction associated with a lower pressure on the leeward side of the plate. As interpreted by Shih et al. [18], the formation of the LEV is due to unsteady separation by means of local thickening of the boundary layer on the airfoil leeward surface. The boundary layer near the leading edge forms a free shear layer and rolls up into an individual vortex in a mechanism resembling Kelvin– Helmholtz instability. The rest of the boundary layer toward the trailing edge forms shear-layer vortices. The following decrease of Table 2 Coefficients to estimate lift and induced drag forARe4a
ARe∕a0 A1∕μα A3∕μα A5∕μα A7∕μα a∕a0 ARe∕a κ δ
2∕π 0.816 0.076 0.013 0.002 0.641 0.99 0.12 0.027 aa
02π,μ0.25a0∕ARe0.125π.
Fig. 7 Comparison of measured forces at various pivot locations as a function of convective time.
[image:7.585.64.523.428.736.2]normal force is due to LEV splitting, as shown in a phase of6.7tcof Fig. 10, caused by the presence of strong tip vortex in the wake. The period of these oscillations is consistent with a transient vortex shedding process (i.e., intermittent formation and shedding of large-scale LEV and large-large-scale TEV), as shown in the last four phases F–I of Fig. 10. The significant spanwise variation between midspan and three-quarters span indicates that the transition flow behavior is associated with three-dimensional flow development.
B. Effects of Pivot Location
Figure 11 shows the preliminary study of pivot location effect on normal force coefficient CN and axial force coefficient CA at Re13;000. The time scale starts at the first transition cornert1as
shown in Fig. 3. The left panels of Fig. 11 give force course in original time scale. During the regions of constant pitch rate, LE pivot produces largerCN than MC pivot does, which in turn produces largerCNthan TE pivot does. The difference ofCN due to pivot location is proportional toKat a given phase. For lowerK0.022, CNsaturates during constant pitch rate at an angle of attack of about 17.3 deg and7.3tcand then remains slightly above a value of 1.3 for the rest of pitch time. AsKis increased to 0.065 or higher (τ<7.3tc), the slope of CN increases.CN reaches the maximum value at a maximum angle of attack.
Consider that the effect of pivot location causes the delay of time due to freestream convection from the leading edge to the pivot location. The time delay can be evaluated by dividing the length from the leading edge to the pivot location by the freestream velocity. Therefore, the force data for pivot location other than LE could be shifted temporally to compensate the time delay. Then, all force data could be compared using the same reference (i.e., the first transition time pointt1of the LE pivot case). This exercise is
inspired by the work of Granlund et al. [31,32]. The result is given in the right panels of Fig. 11. The case ofK0.022gives very similar force slope among three pivot locations. A slightly different force slope is observed forKhigher than 0.022 due to the impact of initial pitch acceleration. The in-phase oscillatory force behavior for a given K indicates that the transition flow is independent of pivot location effect. AllCNconverge to the same value of approximately 1.1 while approaching to a steady state. Both effects of pitch rate and pivot location are out of the scene at steady state.
Figure 12 presents the interaction of apparent mass effect and circulatory effect for LE, MC, and TE pivots. The apparent mass effect would occur expectably in the region of pitch acceleration shown as gray curves in Fig. 12. The solid, dashed, and dotted curves represent the pitch acceleration ofαm0 76.4, 37.5, and12.6 deg∕s, respectively. The constant-pitch-rate region is the region between the Fig. 8 Force measurement error with time.
a) Development of normal and axial force coefficients of a flat plate at leading edge pivot forK= 0.065
b) Development of lift and drag coefficients of a flat plate at leading edge pivot for K= 0.065
No rm al f o rce co ef fi ci en t, CN
0 1 2 3 4 5 6 7 8 9 10 11 12 13 14 15
0 0.5 1 1.5 2 2.5 3 A C E D I H G F B Ax ia l f o rce co ef fi ci en t, CA
0 1 2 3 4 5 6 7 8 9 10 11 12 13 14 15
-0.25 -0.2 -0.15 -0.1 -0.05 0 A B C D E F G H I
0 1 2 3 4 5 6 7 8 9 10 11 12 13 14 15
0 0.5 1 1.5 2 2.5 L if t co ef fi ci ent , CL
t/tc
t/tc t/tc
t/tc
A B C D E F G H I
0 1 2 3 4 5 6 7 8 9 10 11 12 13 14 15
0 0.5 1 1.5 2 D rag c o e ff icie n t, CD B A C D E F G H I
Fig. 9 Comparison of local force coefficients to global force coefficients.
[image:8.585.58.529.40.491.2] [image:8.585.56.529.46.214.2]Fig. 10 Vortical flow evolution of a flat plate at leading-edge pivot andK0.065.
Fig. 11 Effects of pivot locations on force coefficients as a function of convective time for a pitching rectangular wing.
Fig. 12 Effect of pivot location on force courses of a pitching rectangular flat plate at various reduced pitch rates.
time scalet∕tp0and 1 of Fig. 12, where the circulatory effect would dominate. The black, blue, green, and red curves represent the freestream atRe0, 4400, 8900, and 13,000, respectively.
The normal force spike for LE pivot atRe0, shown in Fig. 12, is positive at the start of the pitch-up phase and negative at the end of the pitch-up phase. The presence of the force spikes is consistent with the profile of pitch acceleration. The magnitude of the force spikes at the start of the pitch-up phase increases with the freestream velocity, which suggests that the apparent mass effect is enhanced by the circulatory effect. These force spikes have been documented by many researchers, for example, Granlund et al. [31,32,39], Eldredge et al. [35,36], Lian and Ol [45], and Ramesh et al. [46]. The impact of pitch rate on force generation is effective only when the wing is in the freestream atRe≠0. The normal force increases with angle of attack during the region of constant pitch rate. Also, the slope of normal force increases as reduced pitch rate decreases with increasing freestream velocity. Furthermore, the apparent mass force spikes occur only forK >0.065. Recall the kinematic parameters given in Table 1; the duration of pitch acceleration (2ta) forK >0.065is shorter than one convective time. And the dimensionless maximum pitch acceleration αm0 0c2∕U2∞ is close to or higher than 1. This correlation of measured force and kinematics suggests that the
apparent mass normal force spike has a strong dependence on the profile of pitch acceleration.
For MC pivot, the pitch acceleration from the pivot axis to the leading edge is equivalent to that from the pivot axis to trailing edge. However, the distributions of both pitch accelerations with respect to midchord pivot are on the opposite surface of the wing. Consequently, no normal force spikes are measured atRe0. As the freestream velocity is increased, only the circulatory effect increases the normal force with pitch rate. The increase of normal force at a given reduced pitch rate has a tendency similar to that for LE pivot.
[image:11.585.67.518.298.580.2]For TE pivot, the apparent mass normal force spikes are in the opposite direction of pitch acceleration, which is contrary to that for LE pivot. A negative normal force spike atRe0is produced at the start of pitch-up phase, and a positive spike is produced at the end of pitch-up phase. The magnitude of the first normal force spike decreases with increasing freestream velocity in contrast with the results by LE pivot. This observation suggests that apparent mass effects at the start of the pitch-up phase for TE pivot are reduced by the circulatory effect. However, the increase of normal force during the constant pitch rate shows the similar tendency of increasing slope withKas that for LE and MC pivots. The apparent mass normal force
[image:11.585.71.521.622.735.2]Fig. 13 Effects of pivot location on vortical structures of the plate atRe0(left panel) andRe4300(right panel), and for LE pivot (top row), MC pivot (middle row), and TE pivot (bottom row).
Fig. 14 Effect of freestream velocity on vortical structures of the plate at leading-edge pivot. The wing kinematics ofαm0 76.4 deg∕sis pitched at
Re0(left panel) andRe4300(right panel).
spikes are measured forK >0.065only. This result is similar to that by LE pivot.
Unlike normal force development, the axial force has independence on pitch acceleration, as shown in Fig. 12. The increase of freestream velocity results in the development of negative axial force with pitch rate, which supports the leading-edge suction argument mentioned in the previous section. Positive axial force is only observed for LE pivot atRe0andK0.39during the first transition of motion.
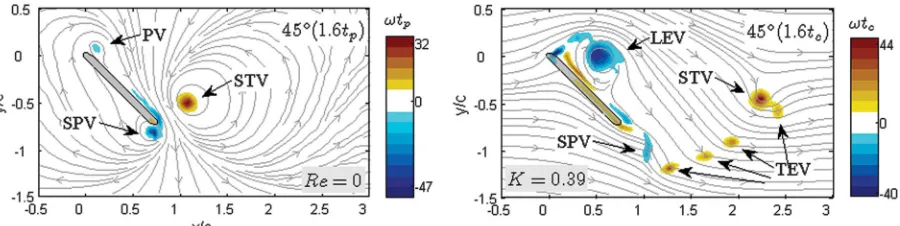
[image:12.585.85.505.45.625.2]Figure 13 shows vortical flow structures on a midspan plane at the phase when the wing just stopped at 45 deg; the flow is likely two-dimensional [37]. The left panels of Fig. 13 are measurements at Re0; the right panels of Fig. 13 are measurements atRe4300. The wing kinematics are the same (i.e., αm0 76.4 deg∕s). Correlating the force data atRe0in Fig. 12 with the corresponding flowfield in Fig. 13, the first force spike relates to the formation of starting vortex (STV) with positive vorticity. For LE pivot, the STV is formed at trailing edge and gives a positive force spike. For TE pivot, Fig. 15 Dynamic flow behavior for a rectangular wing pitched at leading edge.
the STV is formed at leading edge and gives a negative force spike. For MC pivot, one STV is formed at the leading edge, and the other is at the trailing edge, resulting in no force spike at the onset of the pitch-up phase. Both STVs by MC pivot have a maximum vorticity level smaller than that by the other two pivot locations. Conclusively, the formation of STV depends on the distance from end edges to pivot location. Moreover, the presence of STV changes not only the streamlines over the wing but also in the wake.
For LE pivot, as shown in Fig. 13, increasingU∞convects the STV at the trailing edge downstream and promotes the formation of a
[image:13.585.84.504.47.617.2]typical LEVand the shedding of the TEV. For MC and TE pivot at the same Reynolds number, the STVat the leading edge travels along the wing surface on the windward side and, therefore, delays the formation of LEV, which is consistent with results reported in [22,31,32].
Figure 13 reveals an vortical structure with negative vorticity about the pivot location at Re0. It is regarded as a “pivot vortex”(PV). The PV is bounded and has a maximum vorticity level smaller than STV. For LE pivot atRe >0, the PV is likely to encourage the formation of the LEV by an incoming freestream. Fig. 16 Dynamic flow behavior for a rectangular wing pitched at midchord.
The PV is formed at the same time as the STV. The maximum vorticity of the PV remains at a similar level during the region of constant pitch rate, coupling with the STV at the trailing edge to generate an initial force spike atRe0, as shown in Fig. 12. Very little forces are generated during constant pitch rate after both STV and PV are formed atRe0. For TE pivot, as shown in Fig. 13, the first vortex in the wake forK0.39has opposite magnitude of a typical STV, which is a PV shed from the trailing edge and is attributed to a reverse STV in [38]. Unlike STV, this PV has little impact on the flow downstream. For the pivot axis
other than LE and TE pivots, the PVof MC pivot is difficult to form or shed because there is no free end edge.
[image:14.585.85.504.46.618.2]Figure 14 shows the vortical structures when the pitching wing stops at a maximum angle of attack for LE pivot. The formation of stopping vortex (SPV) with negative vorticity atRe0is associated with the second force spike shown in Fig. 12. The SPV is paired with the STV at the same forming edge. This phenomenon is similar to an airfoil, photographed by Prandtl and Tietjens [47], undergoing impulsively start-and-stop upstream-rectilinear motion at a given angle of attack. The SPV by the TE pivot formed at the leading edge Fig. 17 Dynamic flow behavior for a rectangular wing pitched at trailing edge.
avails the wing to generate forces, similar to the effort of typical LEV. On the contrary, the LE pivot produces an SPV at the trailing edge, deteriorating the force generation. For MC pivot, the SPV is present at both leading and trailing edges, resulting in no force.
One should notice that the typical LEV would mingle with the PV produced by LE pivot or with the SPV produced by MC and TE pivots after the wing stops at given angle of attack; this cooperation of vortices at the leading edge from different generation mechanisms would confuse our estimation and justification on LEV in size and strength and requires to be cautiously distinguished in the future. C. Effects of Reduced Pitch Rate
Figures 15–17 show the vorticity field captured by the PIV system as well as the dependence of lift coefficientCLand drag coefficient CD on angle of attack (AOA) for LE, MC, and TE pivots, successively. The vorticity field of the wing at 13 deg AOA is presented due to its occurrence within the region of constant pitch rate and the absence of dynamic stall for reduced pitch rates of interest.
Comparing PIV results atRe0withK0.39in Figs. 15–17, the striking of a uniform freestream on a pitching wing at a given angle of attack produces a thicker shear layer (with a negative sign) attached on the wing suction surface than that (with a positive sign) on the wing pressure surface. Meanwhile, the significant normal force generated during the region of constant pitch rate contributes mostly toCLandCD. The amplitude of vorticity of the dominated vortex around the leading edge, such as LEV for LE pivot or STV for TE pivot, is enhanced by the freestream. The STV at the leading edge by the MC pivot has a smaller level of maximum vorticity than that by LE and TE pivot. The STV formed at leading edge breaks down along the wing pressure surface in the freestream.
For LE pivot, as shown in Fig. 15, the measuredCLatK0(steady state) follows the estimatedCLfrom potential flow theory before static stall occurs. The linear proportion ofCLto AOA indicates the proper assumption of attached flow over the wing and effective aspect ratio of 4. The static stall angle forK0is about 10 deg. AsKis increased to 0.022, the stall angle is increased to 17 deg, which is regarded as dynamic stall. The stall angle forK higher than 0.065 is hardly determined, mainly due to the nonlinear tendency ofCLwith AOA higher than 17 deg. The decrease ofCL by pitch deceleration and smoothing effect by the filter would also influence our determination of stall angle forK >0.065. Moreover,CLshifts upward at a given AOA asKis increased by either increasing constant pitch rate or reducing freestream velocity. As disclosed from the distribution of streamlines in Fig. 15, the increase ofCLwithKwould depend on the circulation around the leading edge due to the effective camber line change, unnecessarily depending on the size of LEV. The first normal force spike observed previously in Fig. 12 is insignificant for current CL andCD as a function of angle of attack in Fig. 15, except for K0.39. Recall from Table 1 that the pitch acceleration ofK0.39 has shortest pitch acceleration duration (2ta0.184tc) and largest maximum pitch acceleration (αm0 08.54U2∞∕c2). The kinematics of K0.39has the same smoothing angle of 6 deg as that ofK019, 0.13, and 0.065, which suggests that the smoothing angle is not a determinative factor of significant generation ofCLat the onset of the pitch-up phase. The measuredCDforK0(steady measurement)
follows the theoreticalCD. However, higher reduced pitch rate gives largerCD.
For MC pivot, theCLatK0.022shown in Fig. 16 would follow theoretical results to an AOA of 17 deg as the pivot axis effect is compensated convectively, as demonstrated in Fig. 11. Because of the presence of STV at both the leading edge and trailing edge, apparent mass effects are very small at the onset of wing motion in comparison with the other two pivot locations considered. Within the region of constant pitch rate, the lift coefficient curve shifts upward as Kincreases but may not with the equal amount as that for LE pivot. AllCDcourses for MC pivot have similar development to that for LE pivot but with smaller magnitude at a givenK.
For TE pivot, as shown in Fig. 17, the onset of pitching wing produces negativeCL, contributed mostly from the negative normal force. The STVat the leading edge forK0.39is still evident at the selected phase of 13 deg. However, the STV at the leading edge for lowerK breaks down into a shear layer with positive vorticity attached to the windward surface. Both STV and shear layer on the windward surface balance the pressure distribution between the windward surface and leeward surface. Hence, the effect of reduced pitch rate on force courses during constant pitch rate region is attenuated before the deceleration of wing motion. BothCLandCD courses are found to be insensitive to the change ofK. The vortical structures on the windward surface delayed the formation of the LEV on the leeward surface. The delay time of the LEV formation could be approximated by dividing the length from the leading edge to the pivot location by the freestream velocity, as revealed in Fig. 11.
Figure 18 shows the comparison of force coefficients as a function ofK to that reported in [38] at AOA13 deg, using different smoothing commands to operate the stepper motor for the same kinematics. The consistent results suggest the independence of kinematic implementation. The average values of two data sets are plotted as the solid curve for a given pivot location. The results show that the increase ofCLis linearly proportional toKforKhigher than 0.065. The slope ofCLK) is decreased with the pivot location positioned aft of the trailing edge. AsKis less than 0.065, theCLis likely convergent to an estimated value by the steady potential flow assumption. The increase ofCDis linearly proportional toKonly for LE and MC pivots atKhigher than 0.065. All measuredCD are higher than the estimated CD. For TE pivot, the CD is likely independent ofK.
V. Conclusions
In this paper, the interrelation of unsteady hydrodynamic forces and PIV velocity measurements was reported for a rectangular flat plate with an effective aspect ratio of 4, undergoing various pitch-up motions up to 45 deg. Changes in both pitch rate and freestream velocity were considered, resulting in a parameter space of reduced pitch rate in a range of 0–0.39. Also, the case of the pitching wing at Re0was documented to gain additional insight on the nature of apparent mass effect and the impact of freestream for circulatory force generation.
[image:15.585.83.503.44.169.2]This paper revealed that the pivot location determines where both the starting vortex and pivot vortex will be formed. The formation of Fig. 18 Effect of reduced pitch rate on a) lift coefficient, and b) drag coefficient of a pitching flat plate.
the starting vortex and pivot vortex also depends on initial pitch acceleration duration and amplitude with respect to freestream velocity. Reduced pitch rate affects the formation of the leading-edge vortex with angle of attack. The influence of reduced pitch rate becomes insignificant as the pivot location is moved downstream. For leading-edge pivot, hydrodynamic forces are boosted with respect to the increase of reduced pitch rate due to the formation of a starting vortex at the trailing edge and the coupling formation of a pivot vortex with the leading-edge vortex. Because vortices with opposite sign of vorticity are formed at separate locations, the principle of superposition of apparent mass effects on circulatory effects may apply. For a pivot location other than the leading edge, however, the starting vortex appears at the leading edge on the windward surface and interferes with the formation of the leading-edge vortex on the leeward surface. Followed by the freestream convection of starting vortex on the windward surface, the formation of the leading-edge vortex is delayed, and the generation of hydrodynamic force is inhibited. The thin airfoil theory by Glauert provides reasonable force prediction for a finite wing at steady state (zero reduced pitch rate) before static stall angle, which concerns only circulatory force as a function of angle of attack. The theoretical model to account for reduced pitch rate, pivot location, and transition flow behaviors (such as leading-edge vortex splitting and transient vortex shedding) requires further research.
Acknowledgments
The authors would like to thank Michael Ol from the U.S. Air Force Research Laboratory (AFRL) and Kenneth Granlund from North Carolina State University for many fruitful discussions. The work was sponsored in part by the U.S. Air Force Office of Scientific Research, Multidisciplinary University Research Initiative, under contract FA9550-07-1-0547, by the Michigan/AFRL Collaborative Center in Aeronautical Sciences, and the Ministry of Science and Technology, Taiwan, under contracts MOST 104-2218-E-606-003 and MOST 105-2221-E-606-007.
References
[1] Harper, P. W., and Flanigan, R. E.,“The Effect of Rate of Change of Angle of Attack on the Maximum Lift of a Small Model,”NACA TN 2061, March 1950.
[2] Daely, D. C., and Jumper, E. J.,“Experimental Investigation of Dynamic Stall for a Pitching Airfoil,”Journal of Aircraft, Vol. 21, No. 10, 1984, pp. 831–832.
doi:10.2514/3.45050
[3] Francis, M. S., and Keesee, J. E.,“Airfoil Dynamic Stall Performance with Large-Amplitude Motions,”AIAA Journal, Vol. 23, No. 11, 1985, pp. 1653–1659.
doi:10.2514/3.9146
[4] Helin, H. E., and Walker, J. M.,“Interrelated Effects of Pitch Rate and Pivot Point on Airfoil Dynamic Stall,” 23rd Aerospace Sciences Meeting, AIAA Paper 1985-0130, Jan. 1985.
doi:10.2514/6.1985-130
[5] Graham, G. M.,“An Experimental Investigation on an Airfoil Pitching at Moderate to High Rates to Large Angles of Attack,” Ph.D. Dissertation, Mechanical Engineering Dept., Texas Tech Univ., Lubbock, TX, 1985.
[6] Walker, J. M., Helin, H. E., and Strickland, J. H.,“An Experimental Investigation of an Airfoil Undergoing Large-Amplitude Pitching Motions,”AIAA Journal, Vol. 23, No. 8, 1985, pp. 1141–1142. doi:10.2514/3.9055
[7] Walker, J. M., Helin, H. E., and Chou, D. C.,“Unsteady Surface Pressure Measurements on a Pitching Airfoil,”Shear Flow Control Conference, AIAA Paper 1985-0532, March 1985.
doi:10.2514/6.1985-532
[8] Graham, G. M., and Strickland, J. H.,“An Experimental Investigation of an Airfoil Pitching at Moderate to High Rates to Large Angles of Attack,”24th Aerospace Sciences Meeting, AIAA Paper 1986-0008, Jan. 1986.
doi:10.2514/6.1986-8
[9] Strickland, J. H., and Graham, G. M., “Dynamic Stall Inception Correlation for Airfoils Undergoing Constant Pitch Rate Motions,”
AIAA Journal, Vol. 24, No. 4, 1986, pp. 678–680. doi:10.2514/3.9325
[10] Jumper, E. J., Schreck, S. J., and Dimmick, R. L., “Lift-Curve Characteristics for an Airfoil Pitching at Constant Rate,”Journal of Aircraft, Vol. 24, No. 10, 1987, pp. 680–687.
doi:10.2514/3.45507
[11] Strickland, J. H., and Graham, G. M.,“Force Coefficients for a NACA-0015 Airfoil Undergoing Constant Pitch Rate Motions,”AIAA Journal, Vol. 25, No. 4, 1987, pp. 622–624.
doi:10.2514/3.9673
[12] Walker, J. M., and Chou, D. C.,“Forced Unsteady Vortex Flows Driven by Pitching Airfoils,”19th AIAA, Fluid Dynamics, Plasma Dynamics, and Lasers Conference, AIAA Paper 1987-1331, June 1987. doi:10.2514/6.1987-1331
[13] Lorber, P. F., and Carta, F. O.,“Unsteady Stall Penetration Experiments at High Reynolds Number,”United Technologies Research Center Rept. R87-956939-3, East Hartford, CT, April 1987.
[14] Albertson, J. A., Troutt, T. R., and Kedzie, C. R., “Unsteady Aerodynamic Forces at Low Airfoil Pitching Rates,” 6th Applied Aerodynamics Conference, AIAA Paper 1988-2579, June 1988. doi:10.2514/6.1988-2579
[15] Lorber, P. F., and Carta, F. O.,“Airfoil Dynamic Stall at Constant Pitch Rate and High Reynolds Number,”Journal of Aircraft, Vol. 25, No. 6, 1988, pp. 548–556.
doi:10.2514/3.45621
[16] Jumper, E. J., Dimmick, R. L., and Allaire, A. J. S.,“The Effect of Pitch Location on Dynamic Stall,”Journal of Fluids Engineering, Vol. 111, No. 3, 1989, pp. 256–262.
doi:10.1115/1.3243639
[17] Acharya, M., and Metwally, M. H., “Unsteady Pressure Field and Vorticity Production over a Pitching Airfoil,”AIAA Journal, Vol. 30, No. 2, 1992, pp.403–411.
doi:10.2514/3.10931
[18] Shih, C., Lourenco, L., Dommelen, L. V., and KrotHapalli, A., “Unsteady Flow past an Airfoil Pitching at a Constant Rate,”AIAA Journal, Vol. 30, No. 5, 1992, pp. 1153–1161.
doi:10.2514/3.11045
[19] Oshima, H., and Ramaprian, B. R.,“Velocity Measurements over a Pitching Airfoil,”AIAA Journal, Vol. 35, No. 1, 1997, pp. 119–126. doi:10.2514/2.71
[20] Schreck, S. J., Faller, W. E., and Robinson, M. C.,“Unsteady Separation Processes and Leading Edge Vortex Precursors: Pitch Rate and Reynolds Number Influences,”Journal of Aircraft, Vol. 39, No. 5, 2002, pp. 868–875.
doi:10.2514/2.3007
[21] Leishman, J. G.,“Unsteady Airfoil Behavior,”Principles of Helicopter Aerodynamics, 2nd ed., Cambridge Univ. Press, New York, 2006, pp. 423–517.
[22] Ol, M. V., Eldredge, J. D., and Wang, C.,“High-Amplitude Pitch of a Flat Plate: An Abstraction of Perching and Flapping,”Internal Journal of Micro Air Vehicles, Vol. 1, No. 3, 2009, pp. 203–216.
doi:10.1260/175682909789996186
[23] Ol, M. V., Altman, A., Eldredge, J. D., Garmann, D. J., and Lian, Y., “Résumé of the AIAA FDTC Low Reynolds Number Discussion Group’s Canonical Cases,”48th AIAA Aerospace Sciences Meeting, AIAA Paper 2010-1085, Jan. 2010.
doi:10.2514/6.2010-1085
[24] Gopalakrishnan, P., and Tafti, D. K.,“Effect of Rotation Kinematics and Angle of Attack on Flapping Flight,”AIAA Journal, Vol. 47, No. 11, 2009, pp. 2505–2519.
doi:10.2514/1.37540
[25] Walker, J. A.,“Rotational Lift: Something Different or More of the Same?”Journal of Experimental Biology, Vol. 205, No. 24, Dec. 2002, pp. 3783–3792.
[26] Sane, S., and Dickinson, M. H.,“The Aerodynamic Effects of Wing Rotation and a Revised Quasi-Steady Model of Flapping Flight,”
Journal of Experimental Biology, Vol. 205, No. 8, 2002, pp. 1087– 1096.
[27] Sane, S.,“Review: The Aerodynamics of Insect Flight,”Journal of Experimental Biology, Vol. 206, No. 23, 2003, pp. 4191–4208. doi:10.1242/jeb.00663
[28] Kramer, M.,“Increase in the Maximum Lift of an Airplane Wing due to a Sudden Increase in Its Effective Angle of Attack Resulting from a Gust,” NACA TM 687, 1932.
[29] Theodorsen, T., “General Theory of Aerodynamic Instability and the Mechanism of Flutter,” NACA-TR-496, Langley Field, VA, Jan. 1949.
[30] Visbal, M. R., and Shang, J. S.,“Investigation of the Flow Structure Around a Rapidly Pitching Airfoil,”AIAA Journal, Vol. 27, No. 8, 1989, pp. 1044–1051.
doi:10.2514/3.10219
[31] Granlund, K. O., Ol, M. V., and Bernal, L. P.,“Experiments on Pitching Plates: Force and Flowfield Measurements at Low Reynolds Numbers,”
49th AIAA Aerospace Sciences Meeting, AIAA Paper 2011-0872, Jan. 2011.
doi:10.2514/6.2011-872
[32] Granlund, K. O., Ol, M. V., and Bernal, L. P.,“Flowfield Evolution vs. Lift Coefficient History for Rapidly-Pitching Low Aspect Ratio Plates,”
6th AIAA Theoretical Fluid Mechanics Conference, AIAA Paper 2011-3118, June 2011.
doi:10.2514/6.2011-3118
[33] Koochesfahani, M. M., and Smiljanovski, V., “Initial Acceleration Effects on Flow Evolution Around Airfoils Pitching to High Angles of Attack,”AIAA Journal, Vol. 31, No. 8, 1993, pp. 1529–1531.
doi:10.2514/3.11808
[34] Gendrich, C. P., Koochesfahani, M. M., and Visbal, M. R.,“Effects of Initial Acceleration on the Flow Field Development around Rapidly Pitching Airfoils,”Journal of Fluids Engineering, Vol. 117, No. 1, 1995, pp. 45–49.
doi:10.1115/1.2816817
[35] Eldredge, J. D., Wang, C., and Ol, M. V.,“A Computational Study of a Canonical Pitch-Up, Pitch-Down Wing Maneuver,”39th AIAA Fluid Dynamics Conference, AIAA Paper 2009-2387, June 2009. doi:10.2514/6.2009-3687
[36] Eldredge, J. D., and Wang, C.,“High-Fidelity Simulations and Low-Order Modeling of a Rapidly Pitching Plate,”40th Fluid Dynamics Conference and Exhibit, AIAA Paper 2010-4281, June–July 2010. doi:10.2514/6.2010-4281
[37] Yu, H.-T., and Bernal, L. P.,“Effect of Pivot Point on Aerodynamic Force and Vortical Structure of Pitching Flat Plate Wings,”51st AIAA Aerospace Sciences Meeting, AIAA Paper 2013-0792, Jan. 2013. doi:10.2514/6.2013-2992
[38] Yu, H.-T.,“Unsteady Aerodynamics of Pitching Flat Plate Wings,”Ph. D. Dissertation, Aerospace Engineering Dept., Univ. of Michigan, Ann Arbor, MI, 2014.
[39] Granlund, K., Ol, M. V., Garmann, D., Visbal, M., and Bernal, L. P., “Experiments and Computations on Abstraction of Perching,” 28th AIAA Applied Aerodynamics Conference, AIAA Paper 2010-4943, June–July 2010.
doi:10.2514/6.2010-4943
[40] Raffel, M., Willert, C. E., Wereley, S. T., and Kompenhans, J.,Particle Image Velocimetry: A Practice Guide, 2nd ed., Springer, New York, 2007, Chap. 5.
[41] Glauert, H.,The Elements of Aerofoil and Airscrew Theory, 2nd ed., Cambridge Univ. Press, London, 1947, Chap. 11.
[42] Anderson, J. D.,Fundamentals of Aerodynamics, 5th ed., McGraw– Hill, New York, 2011, Chap. 5.
[43] Yu, H.-T., Bernal, L. P., and Morrison, C.,“Experimental Investigation of Pitch Ramp-Hold-Return Motion of Flat Plates at Low Reynolds Number,”50th AIAA Aerospace Sciences Meeting, AIAA Paper 2012-0051, Jan. 2012.
doi:10.2514/6.2012-51
[44] Hoerner, S. F.,“Hydrodynamic Drag,”Fluid-Dynamic Drag, 2nd ed., S. F. Hoerner, New Jersey, 1965, pp. 13–16.
[45] Lian, Y., and Ol, M. V.,“Computation and Experiments on a Low Aspect Ratio Pitching Flat Plate,”48th AIAA Aerospace Sciences Meeting, AIAA Paper 2010-0385, Jan. 2010.
doi:10.2514/6.2010-385
[46] Ramesh, K., Gopalarathnam, A., Edwards, J. R., Ol, M. V., and Granlund, K.,“Theoretical, Computational and Experimental Studies of a Flat Plate Undergoing High-Amplitude Pitching Motion,”49th AIAA Aerospace Sciences Meeting, AIAA Paper 2011-0217, Jan. 2011. doi:10.2514/6.2011-217
[47] Prandtl, L., and Tietjens, O. G.,Applied Hydro- and Aeromechanics, McGraw–Hill, New York, 1934, p. 301.
F. N. Coton Associate Editor