2019 International Conference on Computer Intelligent Systems and Network Remote Control (CISNRC 2019) ISBN: 978-1-60595-651-0
Study on Holographic Image Recognition
Technology of Zooplankton
Zhengrui Shi, Kai Wang, Lujie Cao, Yu Ren, Yu Han and Shixin Ma
ABSTRACT
Marine zooplankton has important ecological and economic value. The observation and automatic image recognition technology of marine zooplankton is an important mean to acquire data such as species, quantity, spatial distribution and behavioral postures of zooplankton, and is an important support for marine scientific research. Digital holography has an innate advantage of refocusing and reconstruction, which is suitable for deep learning and living zooplankton recognition. In this study, a large number of holographic images was trained by using the improved YOLOv2 model, and after test, the study achieved satisfactory results: the models trained by the images with sharpness assessment score of 0.6 or higher, have precision rate above 94% and a recall rate above 88%. This study mainly discusses: (1) the detection method of moving targets to acquire the images of moving zooplankton; (2) the two factors that affect the holographic images recognition results, mean (pixel mean of images) subtraction operation and image sharpness, and the no-reference sharpness assessment based on structural similarity for holographic images; (3) the relationship between sharpness assessment index or mean subtraction and the recognition results.
KEYWORDS
Marine Zooplankton, Holographic Image, Sharpness Assessment, YOLOv2 Model, Image Recognition.
INTRODUCTION
Marine zooplankton, which has scientific and economic value in marine ecosystem, is both good indicators of the ecological status of the water body and the food source of some fish fry[1,2]. At present, species identification and quantitative statistics of marine zooplankton mainly rely on manual operation, which cannot meet the development of marine zooplankton science. Since 2012, with the tremendous progresses in the field of deep learning, digital image recognition technology has made a considerable progress. Deep learning network has been applied to image recognition fields such as species classification and medical diagnosis, and has made remarkable achievements[3,4]. Using deep learning network for species identification of living zooplankton images will greatly improve the recognition efficiency, speed and accuracy compared with manual recognition. ____________________________________________
Zhengrui Shi, Kai Wang, Lujie Cao, Yu Ren, Yu Han, Shixin Ma
However, the general photography methodology is difficult to meet the demand in the microscope field where zooplankton is located. For example, the common microphotography exists the phenomenon: the higher the required magnification, the lower the depth of focus[5], so that it is difficult to capture a clear image of a living zooplankton and apply to real-time identification of living zooplankton, which is often defocused due to the fluctuating imaging distance brought by moving zooplankton in 3D water body. But digital holography has advantages of refocusing capacity that are not available in general photography methodology for zooplankton[5,6], which is easy to acquire living zooplankton images of various postures and body sizes.
IMAGE ACQUISITION, PREPROCESSING AND DATABASE
In this section, we mainly discuss the marine zooplankton digital holographic image acquisition system and image preprocessing, and zooplankton image data set.
Coaxial Digital Holography Imaging System
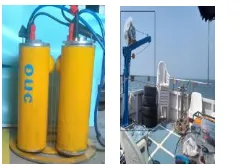
Zooplankton is often not in the depth of field when imaged in water, and digital holography can reconstruct an image in a defocused state as a focus image[5]. The digital holography imaging system records the light field data such as amplitude and phase by wavefront interference of light, and realizes the reconstruction and processing of the recorded object by computer simulation of the optical diffraction process, and then can refocus objects of different imaging distance to obtain a reconstructed image[7]. The holographic recording optical path can be divided into coaxial and off-axis according to the angle between the optical axis of the object light and the reference light[8,9], and the angle is 0 degree for the coaxial holography, and the angle is small for the off-axis. The coaxial holography optical path has a simple structure and is suitable for using in an environment with harsh conditions or long-distance operation. However, the disadvantage of coaxial is that the 0th-order diffracted light and the ±1th order diffracted light are not easily separated, and the twin image is easily formed, which requires subsequent image processing to eliminate the resulting effect[9]. The angle of off-axis between the optical axis and the reference light can separate the 0th-order diffracted light and the ±1th-order diffracted light from each other, but the optical path structure is complicated and is not suitable for a harsh environment[10]. For the image acquisition work, in addition to taking samples of zooplankton back to the laboratory and acquiring images and videos by digital holography, we also used underwater in-situ imaging method to acquire holographic images.
Recognized Species, Image Preprocessing and Database
Copepods, Sagitta, N.scientillans, Clytia hemisphaerica and other jellyfish species (Scyphozoa) in marine zooplankton were selected as species to be identified. They are common, easy to sample and have high scientific research value. Examples of images of five marine zooplankton species are shown in Figure 3. The pre-processing of brightness variation, geometry operation, smoothing filtering and subtraction on the acquired image, suppresses noise and irrelevant recognition elements, and improves the quality and quantity. All acquired and pro-processed zooplankton images are classified and stored according to image resolution (lens magnification), species, and holographic degree.
RECOGNITION ALGORITHMS
In this section, the paper will discuss the selection of algorithms.
Selection of Target Detection and Recognition Algorithms
For the recognition method of zooplankton, there are traditional object recognition algorithms[11] and deep learning algorithms[12], and the deep learning method is both fast and efficient. Among them, YOLOv2 algorithm is faster than
(a)Copepods (b) Sagitta (c) N.scientillans
[image:3.612.348.469.60.144.2]
(d) Clytia hemisphaerica (e) Scyphozoa Figure 3. Examples of zooplankton digital holograms.
Figure 2. The device and the scene of images sampling in deep sea. Figure 1. Optical path diagram of coaxial
[image:3.612.116.442.372.549.2]other deep neural networks and has higher accuracy[13]. In order to understand the YOLOv2 neural network, the YOLO network is briefly introduced. The YOLO network integrates candidate frame extraction, feature extraction, recognition classification and target location into a network structure, directly inputting images, and outputting location information and category information of the target. The whole target detection process is simpler and the speed is inevitably improved, which is advantageous for real-time detection[13,14,15]. YOLOv2 makes many improvements based on the YOLO model, including the use of anchoring box strategies as described below.
Since the detection and recognition task of YOLOv2 is directed to a very large number of objects in daily life, the training set is ImageNet. However, for the zooplankton images acquired in the coaxial holography optical path, the recognition task has changed. Therefore, correspondingly, this paper also proposes an improvement to the original model.
K-MEANS CLUSTERING ALGORITHM
The K-means (K-means clustering algorithm) is a distance-based clustering algorithm, the distance is used as an evaluation reference for the distribution similarity. If the distance between the two distributions is closer, the similarity is greater.
The algorithm process is: pre-given a value k, iteratively calculates the minimum distance of k cluster centers, and assigns all sample points to different categories, then, after clustering each k value, calculates the sum of the squares of the distances of all current sample points to the cluster centers, calculate SSE (Sum Squared Error), draws the curve of SSE-K, and the k value at the inflection point is the best value.
CANDIDATE FRAME DIMENSION CLUSTERING
An improvement (anchoring box strategies) of YOLOv2 is to remove the last pooling layer, adjust the input layer image size to 416*416, remove the last fully connected layer of the network, and each grid center can predict multiple candidate boxes, and the anchor box predicts the category and location at the same time. The size and number of candidate frames in the anchor strategy are mentioned is the result of the author's K-means clustering on the VOC2007 and COCO data sets, although it is generally applicable to most objects. However, for a specific detection and recognition task, it is necessary to re-dimension clustering on the zooplankton holographic image data set to determine the parameters of the candidate frame.
time-consuming and average overlap ratio. The improved has achieved better results, overlap ratio 0.80, and time-consuming 300min (the original overlap ratio 0.79, and time-consuming 320min ).
Figure 4. The curve chart of d-k value.
Experimental Conditions of Network Training
Hardware configuration: Nvidia Geforce GTX1080 graphics card; Inter Xeon CPU E5-1620 V3.5 GHz; 64GB hard disk. Running environment: Operating system for Windows 7 Professional Edition, 64 bits; Framework: Darknet.
IMPACTS OF MEAN SUBTRACTION PROCESSING ON RECOGNITION
Experiment of Mean Subtraction on Recognition
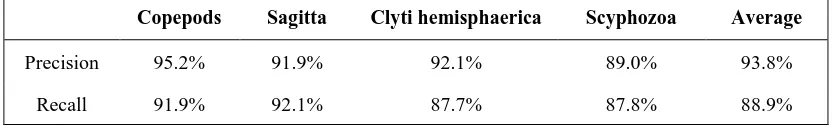
[image:5.612.94.490.632.694.2]The mean (pixel mean of images) subtraction of the raw images processing can eliminate static background noise[16]. Meanwhile, for the reconstructed image, the raw holographic images and the focus images, there are a large number of mean subtraction processing[17]. Therefore, the effect of the mean subtraction processing on the image detection and recognition results needs to be experimentally demonstrated. In this study, the images are divided into three types: clear focus images, slight defocused images and hologram images according to holographic degree. After the experiment, the recognition results of the images will be compared. Four categories were selected in the experiment, including Copepods, Sagitta, Clytia hemisphaerica and Scyphozoa. A total of 4000 clear focus images. Among them, 3500 were used for training and 500 were tested. The results are shown in Table I.
TABLE I. RECOGNITION RESULTS OF ORIGINAL IMAGES.
Copepods Sagitta Clytia hemisphaerica Scyphozoa Average
Precision 94.3% 95.1% 89.4% 88.4% 91.8%
The 4000 focus clear images of previous experiment for mean subtraction processing, 3500 images of these four categories were selected for training and 500 for test. When calculating the image mean, we should only calculate for the training set, instead of using the test set, validation set and other data sets for calculation, otherwise it will violate the principle of deep learning: the model training process can only get information from the training model. The results are shown in Table II.
TABLE II. RECOGNITION RESULTS OF MEAN SUBTRACTION IMAGES.
Copepods Sagitta Clyti hemisphaerica Scyphozoa Average
Precision 95.2% 91.9% 92.1% 89.0% 93.8%
Recall 91.9% 92.1% 87.7% 87.8% 88.9%
Result Analysis of the Experiment of Mean Subtraction
Comparing the recognition results before and after the mean subtraction processing, the same images, and after subtracting the mean, the recognition result of each category is slightly improved. Based on this phenomenon we can draw conclusions: the subtraction processing can improve the detection and recognition results of the zooplankton images, mainly because the data dimensions of natural images obey the same distribution, subtracting the public part, highlighting individual differences and features, and weakening background element, which can speed up convergence and improve accuracy[18].
IMPACTS OF HOLOGRAPHIC IMAGE SHARPNESS ON RECOGNITION
Sharpness Assessment of Holograms
The assessment methods of image sharpness are divided into three types: full reference type, semi-reference type and reference type[19,20,21]. The non-reference sharpness assessment method is to assess an indicator of an image to be evaluated, such as the degree of blurring, without using the original image as a reference[21]. Due to the digital holography recording process of zooplankton[17], the problem of holographic image sharpness is brought about by the holography recording process itself, and there is no original image to compare with the images to be assessed. Therefore, for the holographic image sharpness assessment, a non-reference sharpness assessment method must be used.
Figure 5. Flow chart of no-reference sharpness assessment based on structural similarity.
REFERENCE IMAGE
According to the foregoing analysis, a reference image needs to be obtained by low-pass filtering. The type of filter used is a Gaussian smoothing filter, because the Gaussian function is a single-valued function and does not affect local features such as edges. The two-dimensional Gaussian function has rotational symmetry, so its smoothness in different directions is the same. It is easy to balance the smoothing effect and the amount of noise abrupt by adjusting the parameter σ. From the perspective of computational complexity, the time complexity of the Gaussian filter is O(ksize2), ksize is the size of Gaussian filter, and the calculation efficiency is high[22]. Its formula is as follows:
2 2
2 ) (
2
1
)
(
zG
z
e
P
(1)
GRADIENT FEATURE EXTRACTION
The Sobel gradient operator is used to extract the gradient features of the image in both x and y directions, which are used to describe the edge and contour information in the image, which is an important representation of image sharpness[23].
BLOCK COMPUTING
The image after calculating the gradient feature is divided into blocks, and the gray variance of each block is calculated separately, and the block images are arranged in descending order of gray scale variance[24]. The first N block images of the image to be assessed and the reference image are taken at the same time, waiting for the next calculation of structural similarity.
STRUCTURAL SIMILARITY
assessed and the reference image. Specifically, for digital images, the average gray scale is used to estimate the brightness, and the standard deviation is used to estimate the contrast, the structural information will be calculated and these formulas are as follows[25]: 1 2 2 1 2 ) , ( C C y x L y x y x (2) 2 2 2 2 2 ) , ( C C y x C y x y x (3) 3 3 ) , ( C C y x S y x xy (4) SHARPNESS ASSESSMENT
After the three modules are integrated together, the structural similarity and sharpness index are obtained.
)] , ( [ )] , ( [ )] , (
[L x y C x y S x y
SSIM (5)
1
(6)
N y x
SSIM i i
( , )(7)
According to the subjective image assessment, a total of 60 images were selected, and 20 images of each of the three types were selected manually: The focus image, the details were rich, the edges were clear. The slight defocused, the edges were blurred, but the overall identifiable species; Holograms, the holography stripes are obvious and the species are unrecognizable. Examples of different holographic images as shown Figure 6.
By calculating the sharpness assessment scores of these images, the average and standard deviation of the three types of images are obtained as shown Table III.
TABLE III. THE AVERAGE AND STANDARD DEVIATION OF THE THREE TYPES OF IMAGES.
In-focus image Slightly defocused Holograms
Average 6.98 4.30 3.15
Standard deviation 0.51 0.74 0.22
The large difference between the above average and the small standard deviation of each type show that the non-referenced sharpness assessment based on structural similarity can be used as an indicator of the difference in sharpness.
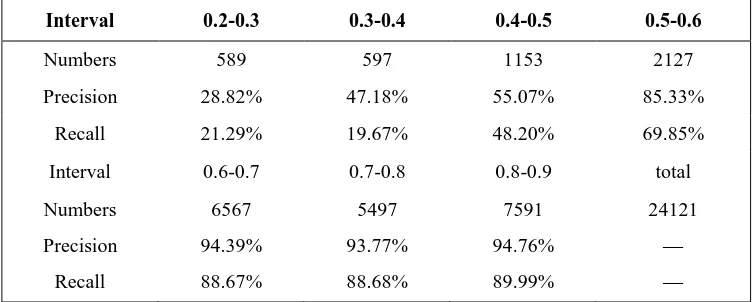
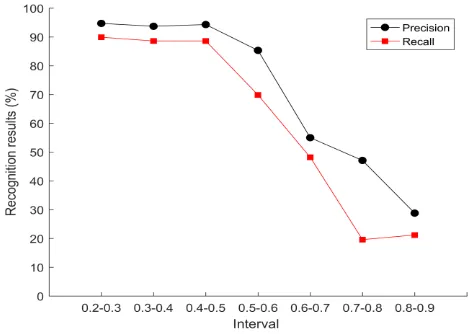
TABLE IV.RECOGNITION RESULTS FOR EACH SHARPNESS INTERVAL OF TRAINING SET.
Interval 0.2-0.3 0.3-0.4 0.4-0.5 0.5-0.6
Numbers 589 597 1153 2127
Precision 28.82% 47.18% 55.07% 85.33%
Recall 21.29% 19.67% 48.20% 69.85%
Interval 0.6-0.7 0.7-0.8 0.8-0.9 total
Numbers 6567 5497 7591 24121
Precision 94.39% 93.77% 94.76% —
Recall 88.67% 88.68% 89.99% —
Experiment of Sharpness and Recognition
For the existing acquired images, the sharpness assessment index is calculated, and the YOLOv2 algorithm is used to obtain the images precision rate and the recall rate, and then the relationship between the images sharpness and the recognition results can be explored. According to the structural similarity obtained by the sharpness assessment algorithm in Section 3.4.1, the value is between 0-1, the more sharp image, the larger the value. The line chart between the assessment index and the recognition results can be established to show the relationship between the two.
Based on the data in Table IV, the following Figure 7 can be drawn. As can be seen from Figure 7, for each individual equal interval, the precision rate and the recall rate keep steady and consistent change in the range of (0.8-0.9), (0.7-0.9), (0.6-0.7), but in in the interval of (0.5-0.6), (0.4-0.5), (0.3-0.4), and (0.2-0.3), the state cannot be maintained and the recognition results appear severe decline. On the one hand, it is because there is less training image data in these intervals and has the tendency: the lower the image sharpness, the lower the recognition results. On the other hand, in the state where the overall performance of the model does not change much and the data sample discrimination is not very high, such as from 0.6 down, the precision rate is usually opposite to the change tendency in recall rate.
[image:10.612.173.407.380.547.2]Based on the data in Table V, the following Figure 8 can be drawn. As can be seen from Figure 8, the sharpness interval of the training set is not completely coincident with the sharpness interval of the image detected in the test set. For example, in the (0.7, 0.8) interval of training set, in its test set, the sharpness assessment index of the detected and recognized images are widely distributed in the range of (0.5-0.6), (0.6-0.7), and (0.7-0.8). It can be found that there is such a tendency that the image with lower image sharpness index is used as the training set, and the narrower the range of image sharpness that can be detected. In addition, for the images that satisfactorily satisfies the condition that can be manually recognized (the images sharpness assessment score range is gathered between (0.6, 0.9)), and it can detect and recognize a wider sharpness assessment score range of images.
0.2-0.3 0.3-0.4
0.4-0.5 0.5-0.6
0.6-0.7 0.7-0.8
[image:11.612.124.497.58.681.2]0.8-0.9
TABLEV.THE PARTITIONS OF IMAGES SHARPNESS DETECTED BY EACH SHARPNESS INTERVAL OF TRAINING SET.
Train
Test
0.2-0.3 0.3-0.4 0.4-0.5 0.5-0.6 0.6-0.7 0.7-0.8 0.8-0.9
0.2-0.3 100% 95.22% 2.82% 0% 0.19% 0% 0.03%
0.3-0.4 0% 4.78% 28.92% 10.90% 0.33% 0.06% 0%
0.4-0.5 0% 0% 65.26% 9.56% 8.68% 0% 0.23%
0.5-0.6 0% 0% 3.00% 9.45% 5.15% 15.48% 2.82%
0.6-0.7 0% 0% 0% 0% 62.46% 37.19% 32.36%
0.7-0.8 0% 0% 0% 0% 22.01% 46.32% 54.06%
0.8-0.9 0% 0% 0% 0.09% 0.70% 0.95% 10.50%
Total 100% 100% 100% 100% 100% 100% 100%
Result Analysis of the Experiment of Sharpness
The experimental results show that using the method of zooplankton detection and recognition based on the improved YOLOv2 model, the holographic image with a sharpness of 0.6 or more maintains a high recognition results, and the sharpness and recognition results are positively correlated. Meanwhile, the higher image sharpness of the training set means the greater range of images with different sharpness assessment. The main reason for these phenomena is that the edge regions of the images with low sharpness have wide spacing, low gradient, and blurred edges, so some image features (texture, shape, etc.) are not obvious, and even disappear after pre-processing such as noise filtering. For edge extraction of a set of slightly defocused images with lower sharpness and focus image with higher sharpness(Prewitt operator), as shown in Figure 9.
[image:12.612.97.527.80.286.2]
(a)Focus image (b)Slight defocused image
[image:12.612.196.421.516.680.2]The images with low sharpness not only have redundant false contours but also lose some true edges, the main reason is high-frequency portion of low sharpness images are less in proportion, and high-frequency portion are important detail features such as edges. When the sample is trained, the difference in details between the images with low sharpness is less than that between the images after the refocusing (high sharpness). To illustrate this fact, we respectively draw gray histogram of a slightly defocused holographic image with low sharpness and the refocused image as shown in Figure 10. It is found that the gray scale distribution with low sharpness not as uniform as high, the contrast is poor, and more pixels are biased towards the brightness of the background (the background is white), the dim pixels are less reflecting the zooplankton itself. Due to the particularity of marine zooplankton images sampling (often acquire thousands of target image samples in the similar background), the background has less difference in brightness, contrast, structure, etc, which also means the differences in details about the zooplankton of low sharpness images cannot be reflected fully, but the high sharpness images are the opposite, and these differences can help to make the neural network learn more features, and also help the network to correct errors and enhance network robustness. The above reasons are combined to cause the above two phenomena.
(a) Clear refocused holograms (b) Slightly defocused hologram
Figure 10. Examples histogram of images with different sharpness assessment scores.
CONCLUSIONS
Digital holography and YOLO model can be successfully competent for zooplankton image recognition in the deep learning, mean subtraction is an important mean to improve recognition results. Refer to holographic images sharpness, it is suggested that when constructing zooplankton holographic image data set, try to absorb more images with sharpness assessment score of 0.6 or higher, and the more than 0.6 are directly used for training recognition, and the less than 0.6 are reconstructed firstly.
ACKNOWLEDGMENTS
Corresponding author: Lujie Cao.
REFERENCES
1. E.G. Krupa, S.S. Barinova, K.B. Isbekov, S. Z. Assylbekova, The use of zooplankton distribution maps for assessment of ecological status of the Shardara reservoir (Southern Kazakhstan), Ecohydrology & Hydrobiology, Vol. 18, pp. 52-65, January 2018.
2. C. C. Mischke, J. E. Filbrun, M. H. Li, N. Chatakondi, Quantifying the contribution of zooplankton to channel catfish and hybrid catfish growth in nursery ponds, Aquaculture, Vol. 510, pp. 51-55, August 2019.
3. N. Elkhani, M. R Chandren, Membrane computing inspired feature selection model for microarray cancer data, Intelligent Data Analysis, Vol. 21, S137-S157, October 2017.
4. A.U. Rajendra, F. Hamido, O. S. Lih, Deep convolutional neural network for the automated diagnosis of congestive heart failure using ECG signals, Applied Intelligence, Vol. 49, pp. 16-27, January 2019.
5. M. Paturzo, V. Pagliarulo, V. Bianco, P. Memmolo, L. Miccio, F. Merola, P. Ferraro, Digital Holography, a metrological tool for quantitative analysis: Trends and future applications, Optics and Lasers in Engineering, Vol. 104, pp. 32-47, 2018.
6. P. Xia, Q. Wang, S. Ri, H. Tsuda, Calibrated phase-shifting digital holography based on space-division multiplexing, Optics and Lasers in Engineering, Vol. 123, pp. 8-13, December 2019. 7. H. Zhang, F. A. M Ramírez, A. Lizana, C. Iemmi, J. Campos, Wavefront imaging by using an
inline holographic microscopy system based on a double-sideband filter, Optics and Lasers in Engineering, Vol. 113, pp. 71-76, February 2019.
8. M. R. McCartney, R. E. D. Borkowski, D. J. Smith, Quantitative measurement of nanoscale electrostatic potentials and charges using off-axis electron holography: Developments and opportunities, Ultramicroscopy, Vol. 203, pp. 105-118, August 2019.
9. P. R. Hobson, J. Watson, The principles and practice of holographic recording of plankton, Journal of Optics A-Pure and Applied Optics, Vol. 4, S34-S49, July 2002.
10. J. Watson, Holography, Applications | High-Resolution Holographic Imaging and Subsea Holography, Encyclopedia of Modern Optics, pp. 37-47, 2005.
11. Q. Hu, C. Davis Automatic plankton image recognition with co-occurrence matrices and Support Vector Machine. Marine Ecology Process Series, Vol. 295, pp. 21-31, 2005.
12. J. S. Ellen, C. A. Graff, M. D. Ohman, Improving plankton image classification using context metadata, Limnology and Oceanography-Methods, Vol. 17, pp. 439-461, August 2019.
13. D. T. Nguyen, T. N. Nguyen, H. Kim, H. J. Lee, A High-Throughput and Power-Efficient FP-GA Implementation of YOLO CNN for Object Detection, IEEE Transactions on Very Large Scale Integration (VLSI) Systems, Vol. 27, pp. 1861-1873, August 2019.
14. K. Chiman, C. Bryan, Y. Jonathan, Deep Learning-Based Target Tracking and Classification for Low Quality Videos Using Coded Aperture Cameras, Sensors (Basel, Switzerland),Vol. 19, August 2019.
15. J. Redmon, A. Farhadi, YOLO 9000: Better, Faster, Stronger. Available online: https://arxiv.org/abs/1612.08242. 2016.
16. C. Alard , R. H. Lupton, A method for optimal image subtraction. Astrophysical Journal Vol. 503, pp. 325-331, 1998.
17. J. Watson, High-Resolution Underwater Holographic Imaging. Encyclopedia of Modern Optics (Second Edition) Vol. 4, pp. 106-112, 2018.
18. F. Berrimi, K. Benmahammed, R. Hedli, Denoising of degraded face images sequence in PCA domain for recognition. Journal of King Saud University - Computer and Information Sciences, in press. https://doi.org/10.1016/j.jksuci. April 2019.
19. Y. Zhang, T. D. Phan, D. M. Chandler, Reduced-reference image quality assessment based on distortion families of local perceived sharpness, Signal Processing: Image Communication, Vol. 55, pp. 130-145, July 2017.
20. J. E. Ospina-Borras, H. B Restrepo, Non-reference assessment of sharpness in blur/noise degraded images, Journal of Visual Communication and Image Representation, Vol.39, pp. 142-151, August 2016.
21. D. Kanjar ,V. Masilamani , Image Sharpness Measure for Blurred Images in Frequency Domain, Procedia Engineering Vol. 64, pp. 149-158, 2013.
23. S. Chen, X. Yang, Z. You, M. Wang, Innovation of aggregate angularity characterization using gradient approach based upon the traditional and modified Sobel operation, Construction and Building Materials, Volume 120, pp. 442-449, September 2016.
24. J. Wen, Z. Zhou, Z. Liu, M. Lai, X Tang, Sharp sufficient conditions for stable recovery of block sparse signals by block orthogonal matching pursuit, Applied and Computational Harmonic Analysis, Vol. 47, pp. 948-974, November 2019.