© 2016, IRJET | Impact Factor value: 4.45 | ISO 9001:2008 Certified Journal
| Page 1101
K MEAN AND FUZZY CLUSTERING ALGORITHM
PREDICATED BRAIN TUMOR SEGMENTATION
AND AREA ESTIMATION
Yashwanti Sahu
1, Suresh Gawande
21
M.Tech. Scholar, Electronics & Communication Engineering, BERI Bhopal, M.P., India
2Assistant Professor, Electronics & Communication Engineering, BERI Bhopal, M.P., India
Abstract: Tumors are of various sorts and they have distinctive characteristics and diverse treatment. As it is known, brain tumor is characteristically serious and life-debilitating in light of its character in the constrained space of the intracranial cavity (space shaped inside the skull). Most Research in created nations demonstrates that the quantity of individuals who have brain tumors were died because of the reality of mistaken location. This paper manages near investigation for discovery of extent and state of tumor in brain MR pictures.
Key words: MRI, Threshold based, Frequency based, Denoising.
I.
INTRODUCTION
Regularly the life structures of the Brain can be seen by the MRI sweep or CT scan. In this venture the MRI examined picture is taken for the whole process. The MRI output is more agreeable than CT check for analysis. It is not influence the human body .Because it doesn't utilize any radiation. It depends on the attractive field and radio waves. There are distinctive sorts of calculation were produced for brain tumor recognition. Be that as it may, they might have some disadvantage in recognition and extraction. Tumor is because of the uncontrolled development of the tissues in any part of the body. The tumor might be essential or auxiliary. On the off chance that it is a birthplace, then it is known as essential. In the event that the part of the tumor is spread to somewhere else and developed as its own particular then it is known as auxiliary. Typically mind tumor influences CSF (Cerebral Spinal Fluid). The doctor gives the treatment for the strokes as opposed to the treatment for tumor. So recognition of tumor is imperative for that treatment. The lifetime of the individual who influenced by the mind tumor will increment in the event that it is recognized at current stage. That will build the lifetime around 1 to 2 years. Regularly tumor cells are of two sorts. They are Mass and Malignant. The discovery of the threatening tumor is fairly hard to mass tumor. For the exact discovery of the dangerous tumor that needs a 3-D representation of mind and 3-D analyzer apparatus.
II
RELATED
WORK
In Classification of Brain Cancer Using Artificial Neural Network [3] A Brain Cancer Detection and Classification
System has been designed and developed. The system uses computer based procedures to detect tumor blocks or lesions and classify the type of tumor using Artificial Neural Network in MRI images of different patients with Astrocytoma type of brain tumors.
In Diagnosis of Brain Tumours from Magnetic Resonance Spectroscopy using Wavelets and Neural Networks [4] The diagnosis of human brain tumors from noninvasive signal measurements is a sensitive task that requires specialized expertise. In this task, radiology experts are likely to benefit from the support of computer-based systems built around robust classification processes. In this brief paper, a method that combines data pre-processing using wavelets with classification using Artificial Neural Networks is shown to yield high diagnostic classification accuracy for a broad range of brain tumour pathologies.
© 2016, IRJET | Impact Factor value: 4.45 | ISO 9001:2008 Certified Journal
| Page 1102
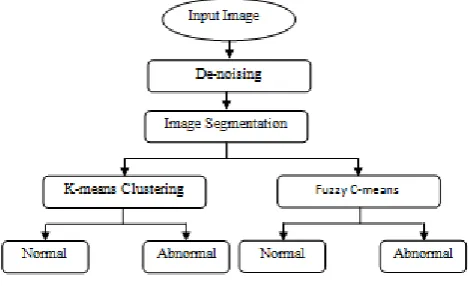
In next sections architecture of proposed method isexplained. In IV section algorithm is explained and then result and conclusion using K mean and clustering algorithm is presented.
III.
PROPOSED
FLOW
Proposed algorithm basically deals with K-means algorithm.
3.1 Division utilizing K means Algorithm
K-Means is the one of the unsupervised learning calculation for clusters. Clustering the picture is gathering the pixels as indicated by the a few attributes. In the k-implies calculation at first we need to characterize the quantity of clusters k. Then k-cluster center are chosen randomly. The distance between the each pixel to each cluster centers are calculated. The distance may be of simple Euclidean function. Single pixel is compared to all cluster centers using the distance formula. The pixel is moved to particular cluster which has shortest distance among all. Then the centroid is re-estimated. Again each pixel is compared to all centroids. The process continuous until the center converges. The K-means algorithm implements a divisive clustering and was first discussed by Duda and Har. The algorithm uses a similarity metric to assign all documents to one of k clusters. The clusters are
represented as an average of all documents contained
within the cluster. This average can be thought of as the centroid of the cluster.
A simple two dimensional case for K-means clustering is shown The K-means algorithm set with k = 4 results in four clusters represented by A, B, C, and D. The K-means algorithm operates as follows:
1. Assign document vectors, di 2 D, to a cluster using an initial seed.
2. Initialize cluster centroids, C, from initial document assignments.
3. For each document d 2 D
(a) Recalculate distances from document di to centroids (C1,C2,...,Ck), and find the closest centroid Cmin.
(b) Move document d from current cluster Ck into new cluster Cmin and re-calculate the centroid for Ck and Cmin.
4. Repeat step 3 until either the maximum epoch limit is reached or an epoch passes in which no changes in document assignments are made. An epoch is a complete pass through all documents.
The initial seed clusters can be either assigned or generated by randomly assigning documents to clusters. K-means has been used in the clustering of images.
A: Mathematical representation
For a given image, compute the cluster means m
Calculate the distance between the cluster centers to each pixel
Repeat the above two steps until mean value convergence. The K-means algorithm is an iterative technique that is used to partition an image into K clusters. The basic algorithm is: 1. Pick K group focuses, either arbitrarily or taking into account some heuristic.
2. Allot every pixel in the picture to the bunch that minimizes the change between the pixel and the group focus.
[image:2.595.307.542.446.589.2]3. Re-process the bunch focuses by averaging the majority of the pixels in the group.
Figure 3.1 Proposed flow of detection
4. Repeat steps 2 and 3 until meeting is achieved (e.g. no pixels change groups)
In this case, variance is the squared or absolute difference between a pixel and a cluster center. The difference is typically based on pixel color, intensity, texture, and location, or a weighted combination of these factors. K can be selected manually, randomly, or by a heuristic. This algorithm is guaranteed to converge, but it may not return the optimal solution.
© 2016, IRJET | Impact Factor value: 4.45 | ISO 9001:2008 Certified Journal
| Page 1103
statistical hierarchical aglomerative clusterization
technique for identification of images regions by the color similarity. This method uses a binary mask and ranks the color components of the clusters’ central components. The basic algorithm is:
1. Each pixel is the separate cluster
2. The clusters with the same masks joins into new clusters 3. New clusters are set up by the cluster integration with minimum distance. The stage may occur until the condition for clusters’ comparability is being obeyed. This is condition
based on the binary mask of correlation and ranks
.
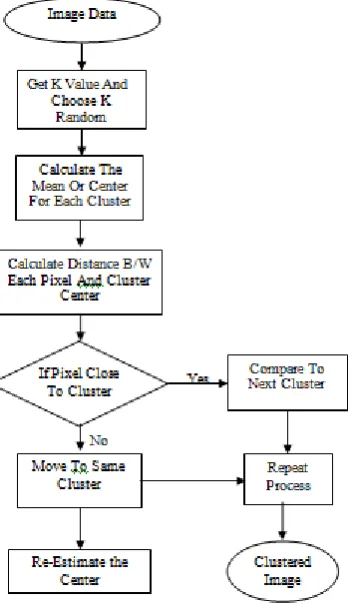
B: Algorithm
1. Give the no of bunch quality as k. 2. Arbitrarily pick the k bunch focuses 3. Ascertain mean or focal point of the group
4. Ascertain the separation b/w every pixel to every bunch focus
5. on the off chance that the separation is close to the center then move to that group.
6. Generally move to next bunch. 7. Re-gauge the center.
[image:3.595.54.233.394.701.2]8. Repeat the procedure until the inside doesn't move
Figure 3.2: Flowchart of k-means algorithm
3.2 Segmentation using Fuzzy C-means
Algorithm
A Fuzzy Clustering:
The fuzzy logic is an approach to giving so as to handle the information the fractional participation worth to every pixel in the picture. The enrollment estimation of the fuzzy set is extents from 0 to 1. Fuzzy grouping is essentially a multi esteemed rationale that permits transitional qualities i.e., member of one Fuzzy set can also be member of other fuzzy sets in the same image. There is no abrupt transition between full membership and non membership. The membership function defines the fuzziness of an image and also to define the information contained in the image. These are three main basic features involved in characterized by membership function. They are support, Boundary. The core is a fully member of the fuzzy set. The support is non membership value of the set and boundary is the intermediate or partial membership with value between 0 and 1. Fuzzy C-Means algorithm has several advantages like
a) It is unsupervised
b) It disseminates the participation values in a standardized manner.
However in unsupervised method it is not possible to predict ahead of time what type of cluster will emerge from the Fuzzy C-Means.
B: Mathematical representation
Fuzzy c-means (FCM) is the clustering algorithm which
allows one piece of data may be member of more than one clusters. It is based on reducing the following function
Where
m- Any real number greater than 1,
Mij- degree of membership of X; in the cluster j, x- Data measured in d-dimensional,
Rj - d-dimension center of the cluster,
© 2016, IRJET | Impact Factor value: 4.45 | ISO 9001:2008 Certified Journal
| Page 1104
The above process ends when,C Fuzzy C-mean algorithm
The algorithm contain following steps: 1. Initialize M= [Mij] matrix, M(0)
2. At k-step: calculate the centers vectors R (k) = [Rj] with M (k)
3. Update U (k), U (k+l)
4. If || M (k+1)) - M (k) || < δ then STOP, otherwise return to step 2.
The algorithmic steps involved for brain tumor shape
detection is as follows,
1. Begin the procedure.
2. Get the MRI examines picture data in JPEG position. 3. Check whether the info picture is in required configuration and move to step 4 if not show blunder message.
4. On the off chance that picture is in RGB format change over it into gray scale else move to next step.
5. Discover the edge of the grayscale picture.
6. Ascertain the quantity of white focuses in the picture. 7. Ascertain the extent of the tumor utilizing the equation. 8. Show the size and phase of tumor.
9. Stop the project.
This algorithm scans the RGB or grayscale image, converts the image into binary image by binarization
technique and detects the edge of tumor pixels in thebinary
image. Also it calculates the size of tumor bycalculating the
number of white pixels (digit 0) in binaryimage.
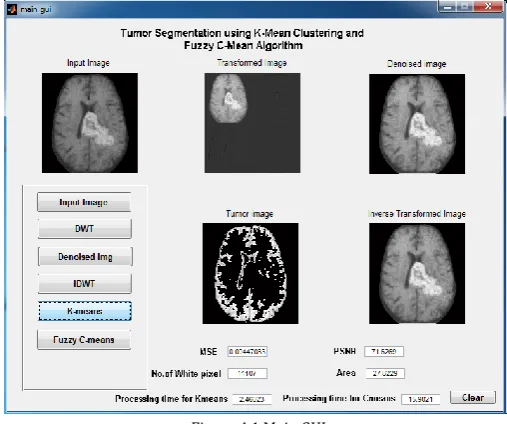
IV.RESULTS
[image:4.595.301.555.236.448.2]After applying the algorithm discussed above the results has been obtained using MATLAB.
Figure 4.1 Main GUI.
TABLE4.1:- RESULTS FOR K MEAN ALGORITHM
Parameters Image
Processing time 1.6855
Area in mm^2 13.1921
MSE 0.0045
PSNR 71.6269
No. of White pixels 2497
TABLE4.2:- RESULTS FOR CLUSTERING ALGORITHM
Parameters Image 1
Processing time 10.1898
Area in mm^2 18.9952
MSE 0.00447083
PSNR 71.6269
© 2016, IRJET | Impact Factor value: 4.45 | ISO 9001:2008 Certified Journal
| Page 1105
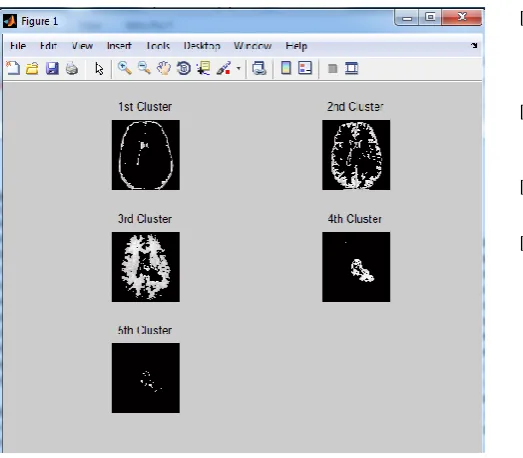
Figure 4.2 Clustered Image.
V.CONCLUSION
There are diverse sorts of tumors are accessible. They might be as mass in cerebrum or harmful over the brain. Assume on the off chance that it is a mass then K-means calculation is sufficient to concentrate it from the brain cells. On the off chance that there is any noise are available in the MR picture it is evacuated before the K means process. The noise free picture is given as an input to the k-means and tumor is extricated from the MRI picture. And after that division utilizing Fuzzy C means for precise tumor shape extraction of threatening tumor and thresholding of yield in highlight extraction. At long last surmised thinking for ascertaining tumor shape and position estimation. The test results are contrasted and different calculations. The phase of tumor depends on the range of tumor. We considered that, if the zone is more noteworthy than 6 mm"2 it will be the basic position.
REFERENCES:
[1] Vijay J., Shubhasini J, “An Efficient Brain Tumor Detection Methodology Using K-Means Clustering Algorithm”, International Conference on Communication & signal processing 2013, pp-653-657.
[2] Dipali M. Joshi, Dr. N. K. Rana and V. M. Mishra, “Classification of Brain Cancer Using Artificial Neural Network”, International Conference on Electronic Computer Technology 2010, pp-112-116 [3] Carlos Arizmendi, Juan Hernández-Tamames, Enrique Romero,
Alfredo Vellido, Francisco del Pozo, “Diagnosis of Brain Tumors from Magnetic Resonance Spectroscopy using Wavelets and Neural Networks”, Annual International Conference of the IEEE EMBS 2010, pp-6074-6077
[4] Dipali M. Joshi, Dr. N. K. Rana and V. M. Mishra, “Classification of Brain Cancer Using Artificial Neural Network”, International Conference on Electronic Computer Technology 2010, pp-112-116
[5] Carlos Arizmendi, Juan Hernández-Tamames, Enrique Romero, Alfredo Vellido, Francisco del Pozo, “Diagnosis of Brain Tumors from Magnetic Resonance Spectroscopy using Wavelets and Neural Networks”, Annual International Conference of the IEEE EMBS 2010, pp-6074-6077
[6] Arpita Das, Mahua Bhattacharya, “A Study on Prognosis of Brain Tumors Using Fuzzy Logic and Genetic Algorithm Based Techniques”, International Joint Conference on Bioinformatics, Systems Biology and Intelligent Computing 2009, pp-348-351
[7] Ahmed Kharrat, Mohamed Ben Messaoud, “Detection of Brain Tumor in Medical Images”, International Conference on Signals, Circuits and Systems 2009, pp-1-6