Inactivation of fatty acid transport protein 1
prevents fat-induced insulin resistance in
skeletal muscle
Jason K. Kim, … , Harvey F. Lodish, Gerald I. Shulman
J Clin Invest.
2004;
113(5)
:756-763.
https://doi.org/10.1172/JCI18917
.
Insulin resistance in skeletal muscle plays a major role in the development of type 2
diabetes and may be causally associated with increases in intramuscular fatty acid
metabolites. Fatty acid transport protein 1 (FATP1) is an acyl-CoA synthetase highly
expressed in skeletal muscle and modulates fatty acid uptake and metabolism by
converting fatty acids into fatty acyl-CoA. To investigate the role of FATP1 in glucose
homeostasis and in the pathogenesis of insulin resistance, we examined the effect of acute
lipid infusion or chronic high-fat feeding on insulin action in FATP1 KO mice. Whole-body
adiposity, adipose tissue expression of adiponectin, intramuscular fatty acid metabolites,
and insulin sensitivity were not altered in FATP1 KO mice fed a regular chow diet. In
contrast, FATP1 deletion protected the KO mice from fat-induced insulin resistance and
intramuscular accumulation of fatty acyl-CoA without alteration in whole-body adiposity.
These findings demonstrate an important role of intramuscular fatty acid metabolites in
causing insulin resistance and suggest that FATP1 may be a novel therapeutic target for the
treatment of insulin resistance and type 2 diabetes.
Article
Metabolism
Find the latest version:
Nonstandard abbreviations used: 2-[14C]DG-6-phosphate (2-DG-6-P); 2-deoxy-D-[1-14C]glucose (2-[14C]DG); fatty acid–binding protein (FABP); fatty acid transport protein-1 (FATP1); hepatic glucose production (HGP); IκB kinase-β(IKK-β); insulin receptor substrate-1 (IRS-1).
Conflict of interest:R.E. Gimeno, S. Punreddy, R.L. Mozell, G. Tan, and A. Stricker-Krongrad were employees at Millennium at the time the work was done and had stock options in Millennium. None of these authors is currently employed by Millennium.
Citation for this article: J. Clin. Invest.113:756–763 (2004). doi:10.1172/JCI200418917.
Introduction
Type 2 diabetes mellitus associated with obesity is reaching epi-demic proportions in the world (1). Insulin resistance in skeletal muscle plays a primary role in its pathogenesis, yet the underlying factors causing insulin resistance remain unknown (2–4). Numer-ous factors have been implicated in this process, including circulat-ing adipocyte-derived factors (i.e., resistin, adiponectin, leptin, TNF-α) (5–9) and fatty acids (10–15). Previous studies have demonstrated increased expression of resistin and TNF-αor reduced expression of adiponectin and leptin to promote insulin resistance (5–9). Other studies have shown a strong inverse relationship between intra-muscular fat content and insulin sensitivity in both animal models and humans (16–19). Increasing fatty acid delivery into skeletal muscle by overexpressing lipoprotein lipase caused insulin resis-tance (17), while decreasing fatty acid uptake into skeletal muscle with CD36 deletion improved insulin sensitivity (20). While the mechanism by which increased fatty acid levels cause insulin resis-tance remains inconclusive, our recent study suggested that intra-cellular accumulation of fatty acid–derived metabolites (i.e., fatty acyl-CoA, diacylglycerol) blunted insulin signaling activities and may be causally involved in the pathogenesis of fat-induced insulin resistance in skeletal muscle (21).
Fatty acid transport protein 1 (FATP1) is a 646-amino acid inte-gral plasma membrane protein that is expressed in cells and tissues with high levels of fatty acid uptake for metabolism or storage, such as skeletal muscle, adipose tissue, and the heart (22–24). Overex-pression of mouse FATP1 in cultured fibroblasts resulted in a marked increase in long-chain fatty acid uptake (22), whereas dis-ruption of the yeast Saccharomyces cerevisiae FATP1homologue fat1
resulted in impaired long-chain fatty acid uptake (25). Since puri-fied FATP1 has acyl-CoA synthetase activity (26), increased fatty acid uptake mediated by FATP1 overexpression is likely driven by increased conversion of fatty acids to fatty acyl-CoA. Consistent with this notion, mutation of a key residue that is predicted to abol-ish catalytic activity results in a loss of FATP1-mediated fatty acid uptake (27). Fatty acids taken up through FATP1 are preferentially channeled into triglyceride synthesis, suggesting a functional link between FATP1-mediated fatty acid uptake and lipid storage (28). In mammals, FATPs form a family of six related proteins. FATP4 is most closely related to FATP1 and is highly expressed in skeletal muscle, adipose tissue, and the heart (29). Deletion of FATP4 resulted in early embryonic (30) or neonatal lethality with a phe-notype reminiscent of lethal restrictive dermopathy (31). Since both FATP1 and FATP4 are upregulated during adipocyte differ-entiation, and FATP1, but not FATP4, translocates to the plasma membrane in response to insulin, FATP1 may be involved in the hormonal regulation of fatty acid uptake, while FATP4 may medi-ate basal fatty acid uptake (32). FATP2, FATP3, FATP5, and FATP6 are more distally related to FATP1 and show little or no expression in adipose tissue and muscle (29, 33). FATP6 is specifically expressed in the heart and is the predominant FATP family mem-ber in this organ (33). While FATP3 is broadly expressed, FATP2
Inactivation of fatty acid transport protein 1
prevents fat-induced insulin resistance
in skeletal muscle
Jason K. Kim,1Ruth E. Gimeno,2Takamasa Higashimori,1Hyo-Jeong Kim,1Hyejeong Choi,1
Sandhya Punreddy,2Robin L. Mozell,2Guo Tan,2Alain Stricker-Krongrad,2David J. Hirsch,3,4
Jonathan J. Fillmore,1Zhen-Xiang Liu,1Jianying Dong,1Gary Cline,1Andreas Stahl,5
Harvey F. Lodish,3,4and Gerald I. Shulman1,6,7
1Department of Internal Medicine, Yale University School of Medicine, New Haven, Connecticut, USA. 2Millennium Pharmaceuticals Inc., Cambridge,
Massachusetts, USA. 3Whitehead Institute for Biomedical Research, Cambridge, Massachusetts, USA. 4Department of Biology, Massachusetts Institute
of Technology, Cambridge, Massachusetts, USA. 5Research Institute, Palo Alto Medical Foundation, Palo Alto, California, USA. 6Department of Cellular and
Molecular Physiology and 7The Howard Hughes Medical Institute, Yale University School of Medicine, New Haven, Connecticut, USA.
research article
and FATP5 show highly restricted tissue distribution in the liver (FATP2, FATP5) and kidney (FATP2) (29).
In addition to the FATPs, other proteins, such as long-chain acyl-CoA synthases (e.g., ACS1), the scavenger receptor family member fatty acid translocase/CD36, and members of the fatty acid–binding protein (FABP) family have also been implicated in playing a role in fatty acid uptake into cells (22, 23, 34, 35). Studies in yeast and mam-malian cells suggest that FATPs and ACS1 can partly substitute for one another and form a multiprotein complex on the plasma mem-brane (22, 36). CD36 has been proposed to mediate fatty acid uptake by binding and thus increasing the local concentration of fatty acids at the plasma membrane (29). The importance of CD36 in fatty acid metabolism has been demonstrated in previous studies demonstrat-ing that transgenic mice overexpressdemonstrat-ing CD36 have increased fatty acid uptake and oxidation (20, 37, 38). Additionally, Hajri et al. have shown that CD36-null mice had reduced fatty acid uptake and enhanced insulin sensitivity, which implicates an important role of fatty acid transport proteins in whole-body glucose homeostasis (20). In light of these findings, we have generated FATP1 KO mice to determine the role of FATP1 in fatty acid metabolism and glucose homeostasis in vivo. Furthermore, the effect of acute lipid infusion or chronic high-fat feeding on insulin action and signaling in the skele-tal muscle of FATP1 KO mice was examined to determine the role of intramuscular accumulation of fatty acid–derived metabolites in the pathogenesis of fat-induced insulin resistance in skeletal muscle.
Methods
Generation of FATP1 KO mice. Genomic DNA containing the FATP1
locus was obtained by screening a 129/Sv genomic bacterial artificial chromosome library (Research Genetics, Huntsville, Alabama, USA) with a fragment containing the 5′end of the FATP1coding sequence. A targeting construct was generated by PCR amplifying 2.3 kb and 2 kb of genomic DNA immediately upstream and downstream of the first coding exon (see GenBank accession numbers AF023256-8 for the genomic structure of FATP1) and inserting these fragments into a targeting vector containing a neomycin resistance marker under control of the phosphoglycerate kinase-promoter (PGK-neo) and a lacz
gene with a nuclear localization sequence (nls-lacz) located immedi-ately downstream of the 5′arm, thus placing laczunder the tran-scriptional control of the FATP1promoter. To allow confirmation of recombination events, probes were generated by PCR from genomic DNA immediately adjacent to the 5′and 3′arms. FATP1KO mice were generated by transfecting 129SvEv ES cells with the targeting construct, and ES cell clones that had undergone homologous recombination were injected into blastocysts that were then trans-ferred to pseudopregnant female mice to generate chimeric offspring. Male chimeras were mated with C57Bl/6J females to obtain germline transmission of the disrupted FATP1gene. The resulting heterozy-gotes were interbred to generate mice homozygous for the FATP1
mutation, along with wild-type littermates. Genotyping of offspring was performed using a PCR assay with primers designed against the 5′ untranslated region of FATP1 (5′ -GGCGGGCAATGTTAAG-TAAACTGG-3′), sequences in the first coding exon (5′ -CTCACAC-CACCCTGCAAGACTCT-3′) to detect the WT allele, and sequences in the inserted cassette (5′ -GTAATGGGATAGGTCACGTTGGTG-3′) to detect the KO allele.
Examination of gene expression. The mRNA expression of FATP fam-ily members, adiponectin and resistin, was performed using real-time quantitative PCR with an ABI Prism 7700 sequence detector (Perkin-Elmer Applied Biosystems Inc., Foster City, California, USA)
accord-ing to the manufacturer’s recommendations. RNA was prepared from homogenized tissues using TRIzol, treated with DNase A, and then converted to cDNA using reverse transcriptase with random hexamer and oligo-dT primers. To normalize the expression level of target genes 18S was used as an endogenous control. Primers and probes were designed using Primer Express software (Perkin-Elmer Applied Biosystems Inc.). Values are expressed as relative levels. To determine gene expression changes at the genome level, Affymetrix GeneChip technology was used (Affymetrix Inc., Santa Clara, Cali-fornia, USA). Samples were labeled and hybridized to the GeneChip Mouse Expression Set 430 following the manufacturer’s protocols. The arrays were scanned on an Affymetrix GeneArray scanner. Data analysis was performed using MAS 5.0 software.
Metabolic phenotyping of FATP1 KO mice. Fourteen-week-old age- and sex-matched FATP1 KO and WT littermates were placed on a standard lab chow or a high-fat diet (58% fat by calories, diet D12330; Research Diets Inc., New Brunswick, New Jersey, USA). Body weight was assessed weekly. Fat and lean masses were determined after 11 weeks on the diet by dual-energy x-ray absorptiometry using a PIXImus mouse densito-meter (Lunar Corp., Madison, Wisconsin, USA). Fourteen weeks after initiation of the diet, animals were fasted overnight, glucose was mea-sured using a Glucometer (Bayer Corp., Elkhard, Indiana, USA), and plasma and tissues were collected. Commercially available kits were used to determine plasma insulin, (Crystal Chem Inc., Downers Grove, Illinois, USA), free fatty acids, and triglycerides (both from Sigma-Aldrich, St. Louis, Missouri, USA). All procedures were approved by the Millennium Institutional Animal Care and Use Committee.
Hyperinsulinemic-euglycemic clamps to assess insulin action and signaling in vivo. Male FATP1 KO and WT littermates weighing approximate-ly 25 g (approximateapproximate-ly 16 weeks of age) were studied to examine the effect of acute lipid infusion or chronic high-fat feeding on insulin action and signaling. For the chronic high-fat feeding study, WT (n
= 6) and FATP1 KO (n= 5) mice were fed ad libitum with a high-fat diet (55% fat, no. 93075; Harlan Teklad, Madison, Wisconsin, USA) for 3 weeks prior to the in vivo experiments. At least 4 days before hyperinsulinemic-euglycemic clamp experiments, an indwelling catheter was inserted in the right internal jugular vein of mice as pre-viously described (17). All procedures were approved by the Yale Uni-versity Animal Care and Use Committee.
After an overnight fast, HPLC-purified [3-3H]glucose (0.05
µCi/min; Amersham Biosciences, Piscataway, New Jersey, USA) was infused for 2 hours (basal period) to estimate the rate of basal glucose turnover. Following the basal period, a 2-hour hyperinsulinemic-eug-lycemic clamp experiment was conducted with a primed, continuous infusion of human insulin (15 pmol/kg/min) (Humulin; Eli Lilly and Co., Indianapolis, Indiana, USA) to raise plasma insulin levels, while plasma glucose was maintained at basal concentrations with variable rates of 20% glucose infusion. Insulin-stimulated whole-body glucose metabolism rates were estimated with a continuous infusion of [3-3H]glucose (0.1 µCi/min) during the clamp procedure, and
2-deoxy-D-[1-14C]glucose (2-[14C]DG; Amersham Biosciences) was
Biochemical assays and calculation. Plasma glucose, insulin, and fatty acid concentrations during the clamp procedure were analyzed as previously described (17). Plasma concentrations of [3-3H]glucose,
2-[14C]DG, and 3H
2O were determined following deproteinization
of plasma samples as previously described (17). The radioactivity of
3H in tissue glycogen was determined by digesting tissue samples in
KOH and precipitating glycogen with ethanol. For the determina-tion of tissue 2-[14C]DG-6-phosphate (2-DG-6-P) content, tissue
samples were homogenized, and the supernatants were subjected to an ion-exchange column to separate 2-[14C]DG-6-P from 2-[14C]DG.
Rates of basal and insulin-stimulated whole-body glucose turnover were determined as the ratio of the [3H]glucose infusion rate
(disin-tegrations per minute) to the specific activity of plasma glucose (dis-integrations per minute per micromole) at the end of basal period and during the final 30 minutes of the clamp procedure, respective-ly. Hepatic glucose production during the hyperinsulinemic-eug-lycemic clamps was determined by subtracting the glucose infusion rate from the whole-body glucose uptake. Whole-body glycolysis and glycogen plus lipid synthesis from glucose were calculated as previ-ously described (17). Glucose uptake in individual tissues was calcu-lated from a plasma 2-[14C]DG profile, which was fitted with a
dou-ble exponential or linear curve using MLAB (Civilized Software Inc., Silver Springs, Maryland, USA) and tissue 2-[14C]DG-6-P content.
Skeletal muscle glycolysis and glycogen synthesis were calculated as previously described (17).
Insulin signaling analysis. Skeletal muscle samples (gastrocnemius) were obtained at the end of the clamp procedure to measure in vivo activities of insulin receptor substrate-1 (IRS-1) tyrosine phospho-rylation and IRS-1–associated PI3K. The activities were assessed by immunoprecipitating IRS-1 using antibodies to IRS-1 (Upstate Biotechnology Inc., Lake Placid, New York, USA) and assessing the incorporation of 32P into PI to yield
phosphatidylinositol-3-monophosphate as previously described (17).
Measurement of fatty acid–derived metabolites in skeletal muscle and liver. Skeletal muscle (quadriceps) and livers of WT and FATP1 KO mice were studied to determine the concentrations of intracellular fatty acid–derived metabolites (i.e., fatty acyl-CoA, diacylglycerol, and ceramide) using an API 3000 LC/MS/MS (PE Sciex, Foster City, Cal-ifornia, USA) interfaced with TurboIonSpray ionization source and using the modified method of Bligh and colleagues (40).
Statistical analysis. Data are expressed as means plus or minus SE. The significance of the difference in mean values of WT mice fed normal chow diet (control) versus WT mice fed a high-fat diet, WT mice with lipid infusion, FATP1 KO mice fed normal chow diet, FATP1 KO mice fed a high-fat diet, and FATP1 KO mice with lipid infusion was evaluated using the Duncan multiple range test.
Results
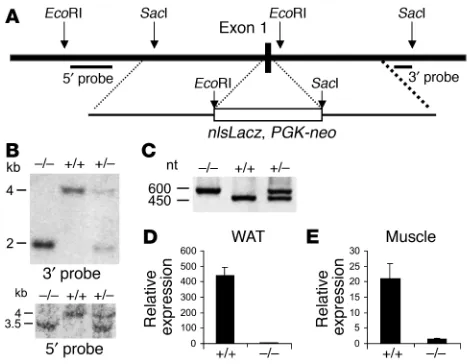
Generation of FATP1 KO mice. FATP1 KO mice were generated by replacing the first coding exon of FATP1, which encodes the amino acids 1–56, with a targeting cassette using homologous recombina-tion (Figure 1A). FATP1-delerecombina-tion mice were obtained at Mendelian ratios from heterozygous mating pairs and appeared to be indistin-guishable from WT animals. Southern blot analysis of tail DNA from F2-generation mice using 5′and 3′diagnostic probes, as well as PCR
genotyping analysis, confirmed the correct recombination event (Fig-ure 1, B and C). Analysis of FATP1 mRNA using real-time RT-PCR with a probe directed to the 3′untranslated region of FATP1 showed that FATP1 mRNA was greatly reduced in the skeletal muscle and white adipose tissue of FATP1 KO mice (Figure 1D). We also
com-pared gene expression in muscle and white adipose tissue of the WT and FATP1 KO mice using Affymetrix GeneChip analysis. Expression of FATP1 was markedly reduced in the skeletal muscle and white adi-pose tissue of FATP1 KO mice as compared with the WT mice, where-as expression of other FATPs (i.e., FATP2, FATP3, FATP4, and FATP5) did not differ among groups (data not shown). This demonstrates that the targeted disruption resulted in deletion of the functional FATP1 gene with no compensatory upregulation of other FATP fam-ily members. Moreover, expression of other genes associated with fatty acid uptake and metabolism (i.e., FATPs, CD36, ACS1) and de novo lipogenesis (i.e., fatty acid synthase) did not differ among groups, whereas FABP3 expression was slightly but significantly ele-vated in the FATP1 KO mice (5,306 ± 240 versus 3,479 ± 215 arbitrary units in skeletal muscle of WT mice). Expression of fatty acid oxida-tion–associated genes (i.e., acyl-CoA oxidase, carnitine palmitoyl-transferase family members, long-chain acyl-CoA dehydrogenase) also did not differ among groups. Taken together, these findings sug-gest that little or no compensatory upregulation of lipid metabolic pathways occurred in the FATP1 KO mice.
[image:4.595.309.544.446.628.2]Metabolic phenotypes of FATP1 KO mice. To evaluate the effect of FATP1 deletion on whole-body physiology, we determined body and organ weights as well as plasma parameters from WT and FATP1 KO mice fed a normal chow diet or a high-fat diet. Body weights, fat pad weights, and other tissue weights were similar in the male FATP1 KO and WT mice fed a normal chow diet or high-fat diet. Circulating levels of glucose, insulin, fatty acids, and triglycerides did not sig-nificantly differ among groups, while none of these parameters dif-fered between male and female mice (data not shown). Furthermore, whole-body lean and fat mass did not differ between WT and FATP1 KO mice on a normal chow diet, and high-fat feeding similarly increased whole-body fat mass in the WT and FATP1 KO mice. We
Figure 1
Generation of FATP1 KO mice. (A) Map of the FATP1 genomic locus and the targeting constructs. The 5′and 3′probes that were used to verify the homologous recombination event are indicated. (B) Southern blot using genomic DNA from the tail of F2animals digested with EcoRI and SacI
and hybridized with the 5′and 3′probes, respectively. The size of KO and WT alleles is indicated. (C) DNA products obtained by PCR amplification using the genotyping primers described in Methods and genomic DNA from the tail of F2animals as a template. nt, nucleotide. (D and E) FATP1
research article
also did not observe any differences in muscle and heart histology using samples from 8-week-old and 15-month-old male mice main-tained on a chow diet. Since adipose tissue–derived hormones have been shown to alter glucose homeostasis, we measured expression of adiponectin and resistin in the white adipose tissue of mice using real-time RT-PCR. While adiponectin expression did not differ among groups, the expression of resistin was significantly lower in the FATP1 KO mice on a normal chow diet (2.5 ± 0.4 versus 8.0 ± 2.0 arbitrary units in the WT mice), but not on the high-fat diet. Fur-thermore, fatty acid uptake in skeletal muscle was measured in vitro using 3H-laurate incubation with isolated soleus muscles from
chow-fed mice and found to be unaltered in the FATP1 KO mice as compared with the WT mice (data not shown). The in vitro assay conditions used may not have been suitable to detect the contribu-tion of FATP1 to muscle fatty acid uptake; alternatively, FATP1 may be required for uptake only under certain physiological conditions.
Hyperinsulinemic-euglycemic clamp experiments in FATP1 KO mice. Insulin action on glucose uptake and metabolism was examined during a 2-hour hyperinsulinemic-euglycemic clamp procedure in awake, age-matched, male WT and FATP1 KO mice following a 5-hour lipid infusion or a 3-week feeding of a high-fat diet. Overnight-fasted plasma glucose concentrations did not differ between WT and FATP1 KO mice fed a regular chow diet, but showed a tendency to increase in the WT mice following the high-fat diet (Table 1). During the clamp procedures, plasma insulin con-centration was raised to approximately 450 pM, while the plasma glucose concentration was maintained at approximately 7 mM in all groups (Table 1). Plasma fatty acid concentrations were elevated approximately twofold to threefold following a 5-hour lipid infusion or 3 weeks of high-fat feeding in the WT and FATP1 KO mice (Table 1). Plasma fatty acid concentrations were completely suppressed during clamp procedures in both groups, but remained elevated dur-ing clamp procedures in the lipid-infused groups.
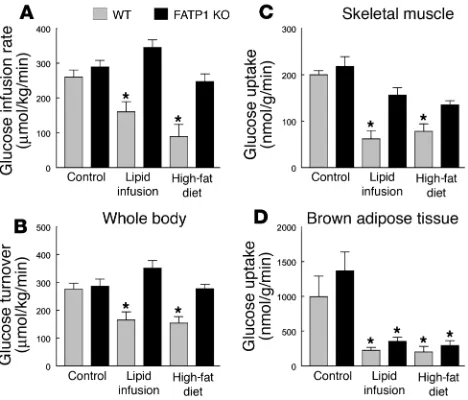
The glucose infusion rate required to maintain euglycemia increased rapidly in the WT and FATP1 KO mice fed a normal chow diet and reached a steady state within 90 minutes. In con-trast, there was a markedly blunted insulin response during the hyperinsulinemic-euglycemic clamp studies in the WT mice after lipid infusion or high-fat feeding, as reflected by a much lower steady-state glucose infusion rate (Figure 2A). In contrast, lipid infusion or a high-fat diet did not affect the steady-state glucose infusion rate in the FATP1 KO mice (Figure 2A). Insulin-stimulat-ed whole-body glucose turnover was decreasInsulin-stimulat-ed by approximately 40% in the WT mice following lipid infusion or high-fat diet,
whereas it remained normal in the FATP1 KO mice (Figure 2B). Tissue-specific insulin-stimulated glucose uptake in vivo was esti-mated using administration of 2-[14C]DG, a nonmetabolizable
[image:5.595.70.541.120.228.2]glu-cose analogue, during clamp procedures in awake mice. Lipid infu-sion or high-fat feeding decreased insulin-stimulated glucose uptake in skeletal muscle (gastrocnemius) of the WT mice by approximately 70%. In contrast, FATP1 KO mice were protected from fat-induced decreases in insulin-stimulated glucose uptake in skeletal muscle (Figure 2C). In contrast to the protective effects of FATP1 deletion on fat-induced insulin resistance in skeletal muscle, insulin-stimulated glucose uptake in brown adipose tissue was significantly reduced following lipid infusion or high-fat feed-ing in both groups (Figure 2D). Insulin-stimulated glucose uptake in white adipose tissue was neither affected by fat challenge nor FATP1 deletion (data not shown).
Figure 2
Whole-body and tissue-specific glucose uptake in WT (gray bars) and FATP1 KO (black bars) mice with lipid infusion or high-fat feeding. (A) Steady-state glucose infusion rate, obtained from averaged rates of 90 to 120 minutes of hyperinsulinemic-euglycemic clamps. (B) Insulin-stim-ulated whole-body glucose turnover in vivo. (C) Insulin-stimInsulin-stim-ulated skele-tal muscle glucose uptake in vivo. (D) Insulin-stimulated glucose uptake in brown adipose tissue in vivo. Values are means ± SE for 5–6 experi-ments. *P < 0.05 versus WT (control) mice.
Table 1
Metabolic parameters during basal (overnight-fasted) and hyperinsulinemic-euglycemic clamp periods in the WT and FATP1 KO mice with or without lipid infusion or high-fat feeding
Basal period Clamp period
n Body wt Plasma Plasma Plasma fatty Plasma Plasma Plasma fatty
(g) glucose (mM) insulin (pM) acids (mM) glucose (mM) insulin (pM) acids (mM)
WT 6 30 ± 1 7.9 ± 0.7 130 ± 15 0.3 ± 0.1 6.6 ± 0.6 409 ± 22 0.03 ± 0.01 FATP1 KO 6 28 ± 1 7.2 ± 0.4 105 ± 14 0.2 ± 0.1 6.6 ± 0.5 455 ± 36 0.07 ± 0.02 WT lipid infused 5 30 ± 2 7.1 ± 0.6 119 ± 29 1.6 ± 0.2A 6.6 ± 0.7 432 ± 52 1.77 ± 0.26A
FATP1 KO lipid infused 5 27 ± 2 6.2 ± 0.4 86 ± 10 1.7 ± 0.1A 7.1 ± 0.9 420 ± 16 1.88 ± 0.11A
WT high-fat diet 5 37 ± 1A 10.2 ± 1.6 110 ± 18 1.2 ± 0.1A 6.9 ± 1.2 427 ± 56 ND
[image:5.595.307.541.445.645.2]research article
Insulin-stimulated whole-body and skeletal muscle glucose metabolic flux were measured using systemic appearance of 3H
2O
as a by-product of [3H]glucose metabolism and [3H]glucose
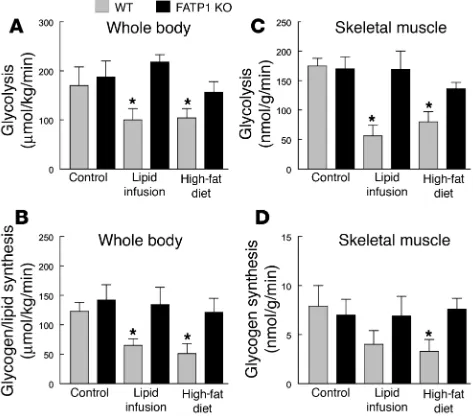
incor-poration into muscle glycogen, respectively. Whole-body glycolysis and glycogen plus lipid synthesis from glucose were decreased by approximately 50% in the WT mice following lipid infusion or fat feeding (Figure 3, A and B). In contrast, lipid infusion or high-fat feeding did not affect insulin-stimulated whole-body glucose metabolism in the FATP1 KO mice. Furthermore, insulin-stimu-lated glycolysis and glycogen synthesis in skeletal muscle (gastroc-nemius) were decreased by approximately 80% in the WT mice fol-lowing lipid infusion or high-fat feeding (Figure 3, C and D). In contrast, FATP1 KO mice were protected from fat-induced decreas-es in insulin-stimulated muscle glucose metabolism. Thdecreas-ese rdecreas-esults indicate an important role of FATP1 and fatty acid uptake in skele-tal muscle in the development of fat-induced insulin resistance. In contrast to the effects on peripheral glucose metabolism, neither fat challenge nor FATP1 deletion affected basal hepatic glucose pro-duction (HGP; Figure 4C). Additionally, insulin’s ability to suppress basal HGP was similarly reduced following high-fat feeding in the WT and FATP1 KO mice, as demonstrated by significantly elevated HGP during an insulin-stimulated state (i.e., clamps) in the WT mice as well as an increasing tendency for elevated HGP in the FATP1 KO mice (Figure 4D).
Skeletal muscle insulin signaling in FATP1 KO mice. Recent studies in IRS-1 gene-disrupted mice have suggested that IRS-1 is important in insulin activation of glucose transport and glycogen synthase activity in skeletal muscle (2, 41). Insulin-stimulated IRS-1 tyro-sine phosphorylation in skeletal muscle (gastrocnemius) was decreased by approximately 60% in the WT mice following lipid
infusion or high-fat feeding (Figure 4A). Similarly, insulin-stimu-lated IRS-1–associated PI3K activity in skeletal muscle (gastrocne-mius) was decreased by 40% and 75% in the WT mice following lipid infusion and high-fat feeding, respectively (Figure 4B). In con-trast, FATP1 KO mice were protected from fat-induced defects in insulin-stimulated IRS-1 tyrosine phosphorylation and IRS-1– associated PI3K activity in skeletal muscle (Figure 4, A and B).
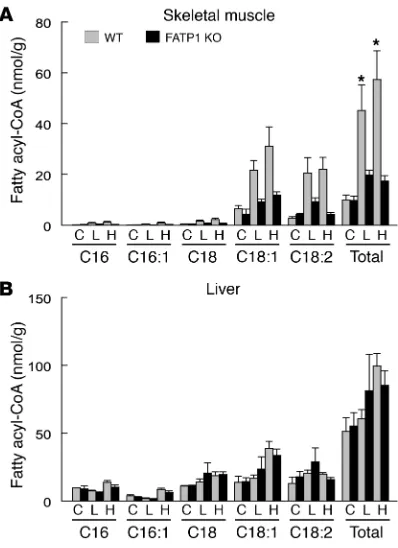
Intramuscular fat metabolite contents in FATP1 KO mice. Defects in skeletal muscle insulin action following lipid infusion or a high-fat diet may be due to increases in intramuscular fatty acid–derived metabolites. Previous studies have shown a strong inverse relation-ship between intramuscular fat content and insulin sensitivity in humans and animals (15–19). To examine whether the fat-induced changes in skeletal muscle insulin action were associated with changes in intramuscular fat contents, intramuscular concentrations of triglyceride and fatty acid–derived metabolites (i.e., fatty acyl-CoA, diacylglycerol, ceramide) were measured in skeletal muscle and liver using liquid chromatography tandem spectrometry. Fatty acid com-position of lipid emulsion and high-fat diet was also determined, and the results indicated that C16, C18:1, and C18:2 were the more abun-dant fatty acyl-CoAs in the lipid emulsion and high-fat diet (Figure 5A). Intramuscular (quadriceps) triglyceride concentration was increased in the WT mice following a high-fat diet but remained nor-mal in the FATP1 KO mice (Figure 5B). Similarly, intramuscular total fatty acyl-CoA concentrations were significantly elevated in the WT mice following lipid infusion or a high-fat diet, whereas FATP1 KO mice were completely protected from fat-induced increases in intra-muscular fatty acyl-CoA levels (Figure 6A). Fatty acid composition of muscle fatty acyl-CoA further indicates that increases in C18:1 and C18:2 were most dramatic following acute lipid infusion and high-fat feeding, and these levels were markedly lower in the FATP1 KO mice. These findings also indicate the role of FATP1 as acyl-CoA
syn-Figure 3
Insulin-stimulated whole-body and skeletal muscle (gastrocnemius) glu-cose metabolic flux in WT (gray bars) and FATP1 KO (black bars) mice with lipid infusion or high-fat feeding. (A) Insulin-stimulated whole-body glycolysis in vivo. (B) Insulin-stimulated whole-body glycogen plus lipid synthesis from glucose in vivo. (C) Insulin-stimulated skeletal muscle
glycolysis in vivo. (D) Insulin-stimulated skeletal muscle glycogen
[image:6.595.45.283.84.292.2]syn-thesis in vivo. Values are means ± SE for 5–6 experiments. *P < 0.05 versus WT (control) mice.
Figure 4
[image:6.595.307.547.454.658.2]research article
thetase for long chain and very long chain fatty acids. Although intra-muscular diacylglycerol and ceramide concentrations showed a sim-ilar pattern of changes following lipid infusion or a high-fat diet, the changes were not as significant or apparent as those of fatty acyl-CoA levels (Figure 5, C and D). In contrast, intrahepatic total fatty acyl-CoA levels were not significantly altered among groups (Figure 6B).
Discussion
The mechanism by which increased levels of fatty acid–derived metabolites cause skeletal muscle insulin resistance involves activa-tion of a serine kinase cascade, of which PKC-θand/or IκB kinase-β (IKK-β) may play a role, leading to the serine phosphorylation of IRS-1 (39, 42–44). Recent studies have shown that serine phospho-rylation of IRS-1 prevents tyrosine phosphophospho-rylation of IRS-1 and interferes with its ability to activate PI3K, leading to insulin resis-tance, as occurs upon treatment with TNF-αand okadaic acid (45, 46). In support of this hypothesis, we have recently demonstrated that skeletal muscle insulin resistance induced by 5-hour lipid infu-sion was due to increases in intramuscular fatty acyl-CoA and dia-cylglycerol levels, activation of PKC-θ, and subsequent defects in insulin signaling activities (21). In this regard, fatty acyl-CoA and diacylglycerol are potent activators of PKC-θ(47, 48), while Itani and colleagues have shown increased activity of PKC in obese insulin resistant subjects (42). Additionally, Yuan and colleagues have demonstrated that activation of IKK-βresulted in defects in skeletal muscle insulin signaling (43), while our previous study has shown that mice with heterozygous deletion of IKK-βwere protected from fat-induced insulin resistance in skeletal muscle (39).
Since FATP1 is an acyl-CoA synthetase that can mediate fatty acid uptake in vitro, we examined whether FATP1 deletion could protect mice from fat-induced insulin resistance. Our findings demonstrat-ed that FATP1 KO mice were protectdemonstrat-ed from chronic diet-inducdemonstrat-ed
[image:7.595.44.291.82.276.2]or acute lipid infusion–induced increases in intramuscular fatty acid metabolites, and this was associated with protection from fat-induced defects in insulin signaling activities and insulin action in skeletal muscle. These results support the notion that FATP1 plays an important role in fatty acid uptake and acyl-CoA synthesis in skeletal muscle, and they are the first demonstration of a role of FATP1 on fatty acid metabolism and glucose homeostasis in vivo. Our findings further support the hypothesis that fat-induced insulin resistance in skeletal muscle involves intracellular accumu-lation of fatty acid–derived metabolites and subsequent defects in IRS-1–associated PI3K activity and glucose transport activity. Since recent studies have implicated circulating factors released by adipocytes, in particular resistin and adiponectin, in playing a role in skeletal muscle insulin resistance (49–54), we examined this alter-native mechanism of insulin resistance. Adipose tissue expression of resistin and adiponectin was not significantly altered following high-fat feeding in the FATP1 KO mice as compared with the WT mice, suggesting that dysregulation of these factors did not play a major role in the observed changes in insulin sensitivity. While we cannot exclude the possibility that other adipose-derived factors are involved in the FATP1 phenotype, the lack of an overt effect of FATP1 deletion on adipose tissue mass and gene regulation make an indirect effect less likely. Thus, our present findings that FATP1 KO mice were protected from fat-induced increases in intramuscular fatty acyl-CoA and insulin resistance demonstrate an important role for intramuscular fatty acid metabolites as causative agents in the development of insulin resistance in skeletal muscle.
Figure 5
Fatty acid composition and intramuscular (quadriceps) fat contents in WT (gray bars) and FATP1 KO (black bars) mice with lipid infusion or high-fat feeding. (A) Fatty acid composition of high-fat diet and lipid emulsion
administered in in vivo experiments. (B) Intramuscular triglyceride con-centrations. (C) Intramuscular diacylglycerol concentrations. (D)
[image:7.595.334.533.402.676.2]Intra-muscular ceramide concentrations. Values are mean ± SE for 5–6 exper-iments. *P < 0.05 versus WT (control) mice.
Figure 6
research article
While the protection from fat-induced insulin resistance in skeletal muscle of FATP1 KO mice is consistent with the in vitro data on FATP1 function and the proposed mechanisms of fat-induced insulin resistance, there were several interesting aspects of the FATP1 KO phe-notype. First, FATP1 KO mice were phenotypically indistinguishable from the WT mice when both groups were fed a regular chow diet. In particular, intramuscular fatty acid metabolite levels and skeletal mus-cle insulin action were similar in the WT and FATP1 KO mice fed a regular chow diet. This finding is in marked contrast to the observa-tion of enhanced insulin sensitivity in the CD36 KO mice, which showed increased glucose utilization and fasting hypoglycemia (20). Additionally, circulating levels of fatty acids and triglyceride were sim-ilar in the WT and FATP1 KO mice fed either a regular chow diet or a high-fat diet, and this observation was also in contrast to increased plasma fatty acids levels, due to reduced fatty acid clearance, in the CD36-null mice (20). Moreover, despite complete ablation of FATP1 in adipose tissue, FATP1 KO mice gained similar adiposity on a regu-lar chow or a high-fat diet as compared with the WT mice. FATP1 dele-tion also did not affect glucose metabolism in the heart (795 ± 100 ver-sus 840 ± 181 nmol/g/min in the WT mice). Taken together, these observations indicate that FATP1 may mediate the uptake of fatty acids under particular physiological conditions (e.g., increased lipid supply) and/or uptake of a subset of fatty acids, possibly channeling them to a particular metabolic fate.
Overall, our findings show that FATP1 KO mice are protected from fat-induced accumulation of intramuscular fatty acyl-CoA and insulin resistance in skeletal muscle. These results support the notion that intramuscular fatty acid–derived metabolites are the major causative factor responsible for insulin resistance in skeletal muscle. Our data also show an important role for FATP1 in the con-version of plasma free fatty acids to intramuscular acyl-CoA,
demon-strating that FATP1 is required for uptake of fatty acids under par-ticular conditions. FATP1 may play an important role in the patho-physiology of type 2 diabetes and may constitute a novel therapeu-tic target for its treatment.
Acknowledgments
Part of this study was conducted at the Yale Mouse Metabolic Pheno-typing Center and was supported by grants from the U.S. Public Health Service: U24 DK-59635 (to G.I. Shulman and J.K. Kim); R01 DK-40936 and P30 DK-45735 (to G.I. Shulman); and P01 HL66105-01 and R37 DK47618-13 (to H.F. Lodish). This study was also sup-ported by a grant from the American Diabetes Association (7-01-JF-05 to J.K. Kim). Gerald I. Shulman is an Investigator of the Howard Hughes Medical Institute. We are grateful to Anthony Romanelli and Aida Groszmann for technical assistance, Ann Strauss and Victoria Fairchild-Huntress for help with generating the KO animals, and Den-nis Huszar for advice and discussion.
Received for publication May 14, 2003, and accepted in revised form January 6, 2004.
Address correspondence to: Jason K. Kim, Yale University School of Medicine, Department of Internal Medicine, Section of Endocrinol-ogy and Metabolism, The Anlyan Center, South 269C, PO Box 208020, New Haven, Connecticut 06520-8020, USA. Phone: (203) 785-6716; Fax: (203) 785-6753; E-mail: jason.k.kim@yale.edu. Jason K. Kim and Ruth E. Gimeno contributed equally to this work. Ruth E. Gimeno’s present address is: Wyeth Research, Cambridge, Massachusetts, USA.
1. Shaw, J.E., Zimmet, P.Z., McCarty, D, and de Courten, M. 2000. Type 2 diabetes worldwide according to the new classification and criteria. Dia-betes Care.23(Suppl. 2):B5–B10.
2. Kahn, C.R. 1994. Insulin action, diabetogenes, and the cause of type II diabetes. Diabetes.43:1066–1084. 3. DeFronzo, R.A. 1988. The triumvirate: beta-cell, muscle, liver. A collusion responsible for NIDDM.
Diabetes.37:667–687.
4. Cline, G.W., et al. 1999. Impaired glucose transport as a cause of decreased insulin-stimulated muscle glycogen synthesis in type 2 diabetes.N. Engl. J. Med. 341:240–246.
5. Hotamisligil, G.S., Shargill, N.S., and Spiegelman, B.M. 1993. Adipose expression of tumor necrosis factor-alpha: direct role in obesity-linked insulin resistance. Science.259:87–91.
6. Steppan, C.M., et al. 2001. The hormone resistin links obesity to diabetes. Nature.409:307–312. 7. Yamauchi, T., et al. 2001. The fat-derived hormone
adiponectin reverses insulin resistance associated with both lipoatrophy and obesity. Nat. Med. 7:941–946.
8. Hotta, K., et al. 2000. Plasma concentrations of a novel, adipose-specific protein, adiponectin, in type 2 diabetic patients. Arterioscler. Thromb. Vasc. Biol. 20:1595–1599.
9. Kahn, C.R., Chen, L., and Cohen, S.E. 2000. Unrav-eling the mechanism of action of thiazolidine-diones. J. Clin. Invest.106:1305–1307.
10. Randle, P.J., Garland, P.B., Hales, C.N., and New-sholme, E.A. 1963. The glucose fatty acid cycle: its role in insulin sensitivity and the metabolic distur-bances of diabetes mellitus. Lancet.1:785–789. 11. McGarry, J.D. 1992. What if Minkowski had been
ageusic? An alternative angle on diabetes. Science. 258:766–770.
12. Reaven, G.M. 1988. Role of insulin resistance in human disease. Diabetes.37:1595–1607.
13. Boden, G. 2001. Obesity, free fatty acids, and insulin resistance. Current Opinion in Endocrinology & Dia-betes.8:235–239.
14. Shulman, G.I. 2000. Cellular mechanisms of insulin resistance. J. Clin. Invest.106:171–176.
15. Kraegen, E.W., Cooney, G.J., Ye, J., and Thompson, A.L. 2001. Triglycerides, fatty acids and insulin resis-tance — hyperinsulinemia. Exp. Clin. Endocrinol. Dia-betes.109(Suppl.):S516–S526.
16. Boden, G., Lebed, B., Schatz, M., Homko, C., and Lemieux, S. 2001. Effects of acute changes of plas-ma free fatty acids on intramyocellular fat content and insulin resistance in healthy subjects. Diabetes. 50:1612–1617.
17. Kim, J.K., et al. 2001. Tissue-specific overexpression of lipoprotein lipase causes tissue-specific insulin resistance. Proc. Natl. Acad. Sci. U. S. A.98:7522–7527. 18. Krssak, M., et al. 1999. Intramyocellular lipid con-centrations are correlated with insulin sensitivity in humans: a 1H NMR spectroscopy study. Diabetologia.
42:113–116.
19. Perseghin, G., et al. 1999. Intramyocellular triglyc-eride content is a determinant of in vivo insulin resistance in humans. A 1H-13C nuclear magnetic resonance spectroscopy assessment in offspring of type 2 diabetic patients. Diabetes.48:1600–1606. 20. Hajri, T., Han, X.X., Bonen, A., and Abumrad, N.A.
2002. Defective fatty acid uptake modulates insulin responsiveness and metabolic responses to diet in CD36-null mice. J. Clin. Invest. 109:1381–1389. doi:10.1172/JCI200214596.
21. Yu, C., et al. 2002. Mechanism by which fatty acids inhibit insulin activation of insulin receptor sub-strate-1 (IRS-1)-associated phosphatidylinositol 3-kinase activity in muscle. J. Biol. Chem.
277:50230–50236.
22. Schaffer, J.E., and Lodish H.F. 1994. Expression cloning and characterization of a novel adipocyte long chain fatty acid transport protein. Cell. 79:427–436.
23. Abumrad, N., Coburn, C., and Ibrahimi, A. 1999. Membrane proteins implicated in long-chain fatty acid uptake by mammalian cells: CD36, FATP and FABPm. Biochim. Biophys. Acta.1441:4–13. 24. Bonen, A., Miskovic, D., and Kiens, B. 1999. Fatty
acid transporters (FABPpm, FAT, FATP) in human muscle. Can. J. Appl. Physiol.24:515–523. 25. Faergeman, N.J., DiRusso, C.C., Elberger, A.,
Knud-sen, J., and Black, P.N. 1997. Disruption of the Sac-charomyces cerevisiae homologue to the murine fatty acid transport protein impairs uptake and growth on long-chain fatty acids. J. Biol. Chem. 272:8531–8538.
26. Hall, A.M., Smith, A.J., and Bernlohr, D.A. 2003. Characterization of the acyl CoA synthetase activity of purified murine fatty acid transport protein 1.
J. Biol. Chem.278:43008–43013.
27. Stuhlsatz-Krouper, S.M., Bennett, N.E., and Schaf-fer, J.E. 1998. Substitution of alanine for serine 250 in the murine fatty acid transport protein inhibits long chain fatty acid transport. J. Biol. Chem. 273:28642–28650.
28. Hatch, G.M., Smith, A.J., Xu, F.Y., Hall, A.M., and Bernlohr, D.A. 2002. FATP1 channels exogenous FA into 1,2,3-triacyl-sn-glycerol and downregulates sphingomyelin and cholesterol metabolism in grow-ing 293 cells. J. Lipid Res.43:1380–1389.
29. Stahl, A., Gimeno, R.E., Tartaglia, L.A., and Lodish, H.F. 2001. Fatty acid transport proteins: a current view of a growing family. Trends Endocrinol. Metab. 12:266–273.
research article
acid transport protein-4 results in early embryonic lethality. J. Biol. Chem. 278:49512–49516. 31. Herrmann, T., et al. 2003. Mice with targeted
dis-ruption of the fatty acid transport protein 4 (FATP4, Slc27a4) gene show features of lethal restrictive der-mopathy. J. Cell Biol.161:1105–1115.
32. Stahl, A., Evans, J.G., Pattel, S., Hirsch, D., and Lodish, H.F. 2002. Insulin causes fatty acid trans-port protein translocation and enhanced fatty acid uptake in adipocytes. Dev. Cell.2:477–488. 33. Gimeno, R.E., et al. 2003. Characterization of a
heart-specific fatty acid transport protein. J. Biol. Chem.278:16039–16044.
34. Coburn, C.T., et al. 2000. Defective uptake and uti-lization of long-chain fatty acids in muscle and adi-pose tissue of CD36 knockout mice. J. Biol. Chem. 275:32523–32529.
35. Binas, B., Danneberg, H., McWhir, J., Mullins, L., and Clark, A.J. 1999. Requirement for the heart-type fatty acid binding protein in cardiac fatty acid uti-lization. FASEB J.13:805–812.
36. Zou, Z., et al. 2003. Vectorial acylation in Saccha-romyces cerevisiae. J. Biol. Chem.278:16414–16422. 37. Ibrahimi, A., et al. 1999. Muscle-specific overexpres-sion of FAT/CD36 enhances fatty acid oxidation by contracting muscle, reduces plasma triglycerides and fatty acids, and increases plasma glucose and insulin. J. Biol. Chem.274:26761–26766.
38. Coburn, C.T., Hajri, T., Ibrahimi, A., and Abumrad, N.A. 2001. Role of CD36 in membrane transport and utilization of long-chain fatty acids by different
tissues. J. Mol. Neurosci.16:117–121.
39. Kim, J.K., et al. 2001. Prevention of fat-induced insulin resistance by salicylate. J. Clin. Invest. 108:437–446. doi:10.1172/JCI200111559. 40. Bligh, E.G., and Dyer, W.J. 1959. A rapid method of
total lipid extraction and purification. Can. J. Biochem. Physiol.37:911–917.
41. Previs, S.F., Withers, D.J., Ren, J.-M., White, M.F., and Shulman, G.I. 2000. Contrasting effects of IRS-1 versus IRS-2 gene disruption on carbohydrate and lipid metabolism in vivo. J. Biol. Chem. 275:38990–38994.
42. Itani, S.I., Zhou, Q., Pories, W.J., MacDonald, K.G., and Dohm, G.L. 2000. Involvement of protein kinase C in human skeletal muscle insulin resis-tance and obesity. Diabetes.49:1353–1358. 43. Yuan, M., et al. 2001. Reversal of obesity- and
diet-induced insulin resistance with salicylates or target-ed disruption of IKK-beta. Science. 293:1673–1677. 44. Schmitz-Peiffer, C., et al. 1997. Alterations in the expression and cellular localization of protein kinase C isozymes epsilon and theta are associated with insulin resistance in skeletal muscle of the high-fat-fed rats. Diabetes.46:169–178.
45. Rui, L., et al. 2001. Insulin/IGF-1 and TNF-α stim-ulate phosphorylation of IRS-1 at inhibitory Ser307 via distinct pathways. J. Clin. Invest.107:181–189. 46. Pederson, T.M., Kramer, D.L., and Rondinone, C.M. 2001. Serine/threonine phosphorylation of IRS-1 triggers its degradation. Possible regulation by tyro-sine phosphorylation. Diabetes.50:24–31.
47. Griffin, M.E., et al. 1999. Free fatty acid-induced insulin resistance is associated with activation of protein kinase C θand alterations in the insulin sig-naling cascade. Diabetes.48:1270–1274.
48. Chalkley, S.M., Hettiarachchi, M., Chisholm, D.J., and Kraegen, E.W. 1998. Five-hour fatty acid eleva-tion increases muscle lipids and impairs glycogen synthesis in the rat. Metabolism.47:1121–1126. 49. Hofmann, C., et al. 1994. Altered gene expression for
tumor necrosis factor-αand its receptors during drug and dietary modulation of insulin resistance.
Endocrinology.134:264–270.
50. Hotamisligil, G.S., et al. 1996. IRS-1-mediated inhi-bition of insulin receptor tyrosine kinase activity in TNF-α- and obesity-induced insulin resistance.
Science.271:665–668.
51. Nagaev, I., and Smith, U. 2001. Insulin resistance and type 2 diabetes are not related to resistin expres-sion in human fat cells or skeletal muscle. Biochem. Biophys. Res. Comm.285:561–564.
52. Sentinelli, F., et al. 2002. Human resistin gene, obe-sity, and type 2 diabetes. Mutation analysis and pop-ulation study. Diabetes.51:860–862.
53. Arita, Y., et al. 1999. Paradoxical decrease of an adi-pose-specific protein, adiponectin, in obesity.
Biochem. Biophys. Res. Commun.257:79–83. 54. Hotta, K., et al. 2001. Circulating concentrations of