Value Chain Analysis in Domestic Aquaculture: Case
Study of Swamp Eel (Monopterus Albus) Culture in An
Giang Province, Vietnam
Nguyen Thi Kim Quyen*, Huynh Van Hien*, Nguyen Hoang Huy**
* College of Aquaculture and Fisheries, Can Tho University, Vietnam ** Department of Fisheries, An Giang Province, Vietnam
DOI: 10.29322/IJSRP.9.01.2019.p8577
http://dx.doi.org/10.29322/IJSRP.9.01.2019.p8577
Abstract- Unbalance income distribution among actors of value chain has been concerned in a recent year. This study was carried out to map the distribution channels, and to clarify cost-benefit distribution among nodes of value chain of swamp eel in An Giang province. A total 302 stakeholders who are involved in value chain were interviewed in dominant areas of swamp eel culture in An Giang province. The survey results show that eel products are consumed via 5 marketing channels, of which, the traders distribute 84.4% of eel products but farmers create low profitable margin ratio. Eel farmers purchase products to wholesalers could get the highest price ($6/kg). Channel of export generates the highest net added value at $4.1/kg. The highest profitable margin ratio of farmers is found in the channel of farmer wholesaler
supermarket/wholesale market (107.7%/cycle). In conclusion, there is requirement in sharing risks and net profits throughout the chain throughout development the linkage model in production chain from input to output to improve efficiency and sustainable production.
Index Terms- Added value, value chain, swamp eel, An Giang.
I. INTRODUCTION
he Vietnam’s aquaculture has increased sharply in a recent year, producing 3.86 million tons over 1.1 million ha, and perceiving $6.7 billion export value in the year of 2017 [1]. This important role is due primary to freshwater aquaculture, especially Pangasius catfish in the Mekong Delta. Since growing in food safety and quality of the international customers, aquaculture certification has emerged as one of governance tools. However, current certification are not appropriate for small producer level because criteria are not viable at this scale [2]. Small-scale producers are trying to diversify production by variety of species which more appropriate to their capacity, relying primarily on their own land. The similar situation happen in An Giang province where locates in the Mekong Delta. The province ranks 4th in area (3,406 km2) and the most crowded population (2.2
million people). Apart from Pangasius catfish, the industry turned to industrial and highly intensive production. Swamp Eel
(Monopterus Albus) is one of species that has been growing strongly in recent years. Eel farming area in 2015 was 21.03 ha, producing 1,067 tones [3, 4]. Eels have a stable consumption
market as tasted and rich of nutritious (protein accounts for 18.4%) [5]. However, the current model of eel farming in An Giang province is still facing many difficulties, such as lack of breeds, feeding by trash fish, and diseases [6]. The challenges come from distribution channels as they resulted in significant difference between the actors participating in the chain. There are many intermediaries participating in the chain and incurred additional costs in production and business. Some previous studies on the value chain in the fisheries sector identified that the high gap in selling price from farmers to consumers is due to lack of linkages among actors in the product value chain [7, 8, 9]. Therefore, research on eel value chain in An Giang province is necessary. At the national/local level, as the dominant participation of the poor in the value chain, the low amount and value of products that the poor sell in the value chain, and unbalance distribution of income in compare to other actors are presented clearly [10]. The objective of this study is to analyze the current status of the eel value chain by mapping the marketing channels and clarifying profit distribution among actors, thereby proposing solutions for improving efficiency of entire value chain of eels in An Giang province.
II. MATERIALANDMETHOD
A. Study Sites and Field Survey
participate in the research. Initially, the authorities gave a list of eel farmers who are currently culture such species. The authors and staff work together to pick out potential stakeholders for interview. In additionally, respondents were asked to identify other potential respondents whenever possible. By following this
“snow-ball” sampling method, a total 302 holders involved in eel value chain were interviewed over the province, including 30 feed and drug suppliers, 32 breeding and nursing sites, 180 culture farms, 58 traders and wholesalers, 2 Supermarkets (Table 1).
B. Data Processing Method and Analysis
The collected primary data were cross checked through multi-informal conversation to observe participants’ behaviors before entering and coding in the computer. Descriptive statistical methods are used to calculate the mean, standard deviation, variance, maximum, minimum, frequency, and percentage values. These number and figures are very important to represent for the overall. Analyse value chain is reasonable complex and vary points of views. Mapping the value chain using tool 2 provided by Berg et al (2003) in “Making Value Chains Work Better for the Poor: A toolbook for Practitioners of Value Chain Analysis” [10]. Tool of mapping the value chain was created to comply with three golds: 1) Better understanding connections between actors, 2) Demonstrate interdependency, and 3) Look beyond people involvement in the value chain. To analyse costs and margins distribution among actors mapped in the value chain, tool 3 in this toolbook was referred together with other guidelines and toolbooks, such as Becker, Tram, and Tu (2009); Kaplinsky and Morris (2003) [12, 13]. Loc and Son (2016) adapted from these guidelines and toolbook, and giving suggestions for the costs and profits analysis in the value chain as follow [14]:
+ Added value = selling price - buying price/total cost
+ Net added value (or profit) = added value - additional costs
+ Intermediate costs of eel culture farmers include costs of breeding, feeds and fuel (electricity, water and petrol); pond improvement; perishable materials and items, prevention and treatment and loan interest payments.
+ Additional costs of collectors, traders, wholesalers, and supermarkets include transportation cost, family and hiring labors, asset depreciation, and fuel costs.
Exploratory study for qualitative data through SWOT analysis was conducted to analyze strengths (Strengths), weaknesses (Weakness), opportunities (Opportunities) and challenges (threats) on the linkages among actors in the value chain.
III. RESULTSANDDISCUSSION
A. Description and Function of Actors Involved in Swamp Eel Value Chain
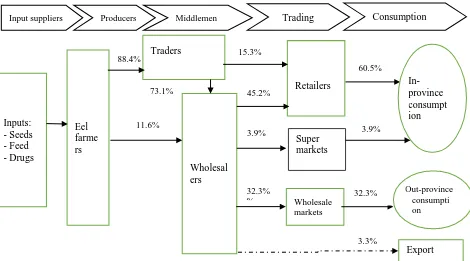
In the first objective of the study, we identified stakeholders involved in the value chain and their functions in the whole chain. The results show that eel aquaculture industry is a combination of functions and services by 5 actors like eel growing farmers, local traders, eel wholesalers, product retailers, super markets and wholesale markets (Fig. 2) in order to distribute products from farm-gate to the ready ultimate customers both domestic and
export. Beside activities involved to transfer of goods through buying and selling functions, feed and drug suppliers, and breeding and nursing sites are functional agents of input suppliers for aquaculture.
Traders of feed and drugs for eel culture is functional agent of input providers for production. Survey results show that each trader yearly provides 3.5 tons for eel culture. Currently, dedicated feed for eel farming has not yet produced in Vietnam, therefore, feed of Pangasius catfish (protein content of 30-35%) is used alternatively. The average revenue of feed and drug trader is around $11,2725/year, corresponding to the profit of $2,941/year and the profit margin rate is 19.8%.
Eel breeding and nursing sites play an important role in providing eel breeds to commercial eel farmers. Breeding production in An Giang province is operated small-scale with averaged 5 pairs of eel brookstocks/production cycle, equivalent to 25-30 pairs of broodstocks/year. The productivity of eel breeds is about 144.6 heads/m2/cycle with the average size being 362 heads/kg.
Breeding and nursing sites need production cost of roughly $22.3/m2/cycle, corresponding to the production cost per breeding
head being $0.15. Selling price of eel breed is $0.28/head. Hence, average income of breeding and nursing site is $41.3/m2, and net
profit is $19.3/m2.
Eel farming households are key plyer in the value chain as they are primary production. Furthermore, since then, completed products are transferred, and added value is created [14]. The average farming area is 150 m2/household. The farmers practice
relatively appropriate stocking density of 61.8 heads/m2. The
farming period is 256 days/crop, and production could reach 7.8 kg/m2, equivalent to 1.4 tons/household/year. Over 63% of eels
can survive after stocking. At the point of harvest, commercial eels of type 1 (>200 grams/head) accounted for 70.6% of total harvested eel production. The total cost is a combination of operational cost and fixed cost [15], which is $24/m2/cycle,
equivalent to the production price of $3.1/kg, which are comprised of feed cost. The farmers sell their products at $6.1-7.6/kg, and generate a total added value, i.e. net profit of $3.0-4.5/kg.
Traders have intermediary roles of buying eels from farmers and selling products to wholesalers, and/or to retailers at the local market. This sub-sector works efficiently with the average purchase and sale volume being 12-14 tons/year. They purchase at the price of $6.1/kg. The additional costs include transportation, ice, labor, transaction fee, etc., being about $0.15/kg. As they do not take ownership of products, the additional costs exclude purchase price. The added value or net profit is $0.38/kg.
wholesaler is 300 tons/year. The average purchasing price is $6.64-6.67/kg. Additional costs per kg are $0.15-0.24, so value added per kg is $0.68-0.8, which generate profitable margin ration being 3.4-4.4 times.
Small-scale retailers who sell eels at local markets have the function of direct sales to local consumers. Their sales are taking place from retail stall hired at the local market. The average operation volume is small it just 0.3-0.8 tons/year as the household-run business, with the input price of $6.67-7.59/kg, and selling price is $0.5-1.5 higher than buying price. After reducing the additional cost (at only $0.05-0.06/kg), the retailers earn $0.45-1.45/kg, and the profitable margin ratio is 7-22 times.
Availability of eel products in the supermarkets in the province is an emerging new phenomenon of aquaculture value chain. The majority of eel products in the supermarket system in An Giang province come from wholesalers at the price of $7.6/kg, and after that reselling to final consumers in the province at a high price of $9.86/kg. This difference in selling price as the aquatic product in the supermarkets are frequently better quality and more freshness [16]. An average purchase volume is 32 tons/year of each supermarket. The additional costs are $0.43/kg, and earn net added value of $1.88/kg, which create profitable margin being 4.4 times..
B. Mapping Marketing Channels of Eel Products
Mapping marketing channels were taken into account after recognition key players in the chain. Marketing channels are various routes of product flows from raw material to final product [17]. The flows that goods, services or information go through make mapping channels be complex and difficult. Of which, mapping the volume of products passes on number of actors can be quantified [10]. We mapped and quantify the eel products in the value chain in the study site as follow (Fig. 2).
The information in the Fig shows that eel products go through many channels and five dominant channels are displayed in the Table 2. More than 88% of eel harvested is sold to traders before passing on other actors. Because a typical characteristic of freshwater aquaculture is small-scale and year-round, traders are very functional in collecting products from fragmented farms and low quantity [16]. From this node, 73% is passed on wholesalers and subsequently purchased by retailers, wholesale markets in Ho Chi Minh city. Only a small portion at 15.3% is sold to retailers before be consumed by local consumers. The wholesalers buy fresh eel products directly from large-scale farms at 11.6% of input amount. It is better for them to buy products from traders as this intermediary gather product and classify to what extent. After that, 49% goes to domestic customers via retailers and supermarkets. Only 3.3% of eel product is exported and this channel is the shortest channel. Farmers, traders, wholesalers, retailers and wholesale market in Ho Chi Minh city are the vital intermediaries and operate the value chain because they generate and constitute the major net profit of the chain.
C. Economic Analysis among Different Actors in Major Marketing Channels
Channel 1: Eel Farmer Trader Retailer In-province consumption
According to channel 1, eel products are passed on three players before being consumed by local customers within the province. The actors generate the total value added of $4.03 per kg, of which farmers could create the highest value, at $3.05/kg (accounting for 75.8% of the total added value of the whole chain). It is followed by traders, at $0.53/kg (accounting for 13.2%), and retailers make the lowest added value of $0.38/kg (accounting for 11.0%). As regard the net profit or net added value, the actors involved in the chain earn $4.25/kg. Of which farmers receive the highest net profit, while retailers earn net profit amount at approximately $0.38 per. As the highest additional costs that traders spent for products, they earn the lowest profit/kg. From the analytical results in the Table 3, the highest profitable margin ratio per production cycle belongs to eel culture farmers (92.0%), followed by traders (6.0%), and retailers (5.7%). Because raising eels requires a long production cycle, at 9-10 months, the cycle of capital flow is long, and it carries high risk. While traders and retailers have short cycle of capital turnover (1-2 days), and less risk in production. This proves that the net profitable margin ratio of eel farmers is lower than other actors in channel 1 if considering a whole production cycle.
Channel 2: Eel Farmer Trader Wholesaler Retailer In-province consumption.
This is the longest chain of eel products with five actors involved in the whole chain. Therefore, the total value added of channel 2 is high as selling price be jumped gradually in each node of the chain. Of which farmers generate the greatest added value, accounting for 50.8% of whole chain. It is followed by retailers who contribute 25% of added value. Wholesalers and traders create added value of 15.4% and 8.9% of the whole chain, respectively. Similarly, the net added value of the whole chain and profitable margin ratio are shared un-equivalently among actors at proportions being like added value.
Channel 3: Eel Farmer Wholesaler Supermarket In-province consumption
Only 11.6% of original products is consumed via this channel. Such channel generate the greatest net added value at $6.09/kg, of which the highest net value is received by farmers (56.5%), followed by supermarkets (30.4) and the owner receives the lowest net value in the channel this (13.1%). According to this channel, eel farmers have the highest rate of profit (107.7%). As the participation of supermarket in retail market, the value added is much increased. Such player shows their function in packaging and displaying products [16], hence, additional cost of supermarket is the highest at $0.42/kg.
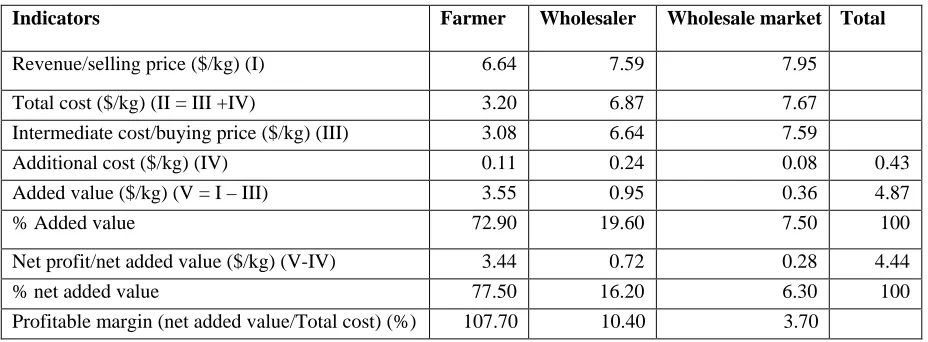
Channel 4: Eel Farmer Wholesaler Wholesale market In-province consumption
added value per kg is generated by wholesale market, accounting for 19.6%. The net added value of the whole chain is $4.44/kg, of which the highest net added value is received by the farmers (77.5%), followed by the wholesalers (16.2%), and the lowest is wholesale market (6.3%). In terms of profitable margin, eel farmers have the highest ratio (107.7%).
Channel 5: Eel Farmer Wholesaler Export
This is the shortest channel of the value chain with two actors, i.e. eel farmer and wholesaler before going to be consumed globally. The total net value-added of the whole chain is $4.10/kg, of which farmers receive 73.7%. For this channel, eel farmers have the highest rate of profitable margin (103.4%), and the wholesalers have a profit margin of 11.8%.
In summary, eel farmers who sale their products to wholesalers receive the highest profitable margin ratio than selling to traders. Considering to net added value, consuming through supermarket generates the highest value up to $6.09 per kg. The majority of value chain analysis focuses to improve profit of farmers, and be onward upgrading efficiency of whole chain [10]. The study shows that this figure ranges from 54 to 80% of whole chain, the very high sharing of farmers in net added value in comparison to other value chains of freshwater species such as snakehead fish (30%) [18], black tiger shrimp (70-80%) [8], white leg shrimp (30-40%) of net value [19].
D. Vertical and Horizontal Linkages among Actors in the Eel Value Chain in An Giang Province
Collaboration in breeding and supplying: 65.6% of eel breeding producers has collaborates in producing and consuming of eel seeds. Among them, 71.4% of eel producers have been associated with the seed traders who collect eel seeds for nursing before selling directly to farmers. Meanwhile, 19.0% of breeding producers has linked to commercial eel farming households to sell eel fry. Especially, 4.8% of breeding producers collaborate to scientists in research and improving breeding process. In addition, there are 4.8% of them is in collaboration to relevant authorities in order to transfer technique and train farmers in application of VietGAP certification in eel breeding.
Primary production, eel farmers, is key node in linkage network of the value chain via input – output dimension [12]. Around one third of farmers has collaborated to input suppliers such as feed and drug suppliers, seed providers. More than 24% of them has good relationship to intermediaries in order to pass products to final consumers. In which 5% of the linkages is formalized via signing contracts of selling to traders. Farmer organization is one of good arrangement to link small-scale farmers and on behalf the interests of farmers [20]. There are 31% of commercial eel farming households who are cross-linked together (horizontal linkages) in information sharing, and application of VietGAP standards through cooperatives and farmer clusters.
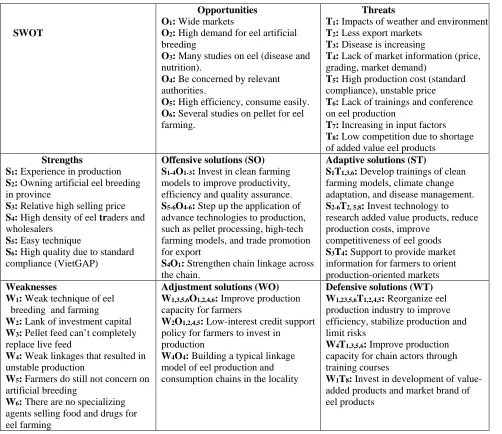
E. Advantages and Disadvantages of Eel value Chain
The value chain of eel products depicted several constraints and opportunities. The field study, therefore, organized several structured SWOT analyses, gathering different stakeholders together in different functions. Analysis of SWOT matrix and propose solutions for developing linkages of commercial eel farmers with the actors in the value chain are presented in Table 8.
These are in generalized forms like threats and weaknesses in eel value chain with key actors, e.g. farmers and other intermediaries in former case, and infrastructure development, increased input supplies and value addition in the later. However, value chain study alone can’t dissect the entire industry to understand all sorts of constraints and opportunities under holistic approach [21]. The table of SWOT matrix above show several suggestions for the better eel production in order to stabilize and enhance linkages between commercial farms and other actors. These solutions focus on major problems as below:
-It is necessary to have policies to encourage the consumption of commercial eel through consumption contracts between commercial eel farmers and wholesalers or supermarkets. Especially, such contracts must be associated with safe and clean production models, non-residues of antibiotics, ensuring food safety and hygiene (e.g. VietGAP). Besides, it is necessary to orient to processing or preliminary processing to export commercial eel to some international markets
-It is necessary to have a policy to support development of vertical links between input providers such as feed, aquatic medicine and seed supply in the commercial eel farming. This policy should focus to control the quality of input components in the process of eel farming according to clean production standards such as explicit origin of feed and drug, and be included in the approved list of the authorities. Breeders must be quarantined to ensure quality and strict disease control.
-Encourage to implicate advanced science and technique in production such as clean eel farming model that manage environment better.
-Allocation credit policies as well as investment funds in order to support production capital with preferential interest rate for eel farmers, and implication of programs and projects of linkage formation in production chains from input to export processing.
-The State needs a stage of trade promotion to increase the export of eel products to the international market.
IV CONCLUSIONS AND RECOMMENDATIONS
A. Conclusions
Direct selling to wholesalers brings farmers higher financial efficiency (profitable margin ratio of 103.4-107.7%) than selling to traders (92.2%).
Distribution of net profit among actors in the value chain is uneven and unreasonable. The shortcomings in the current value chain are: (i) Low capacity to link among actors in the chain (vertical links), as well as among the actors involved in the value chain (horizontal links); (ii) High production costs and unstable markets; (iii) Low diversified value added products, and export markes has not been focused.
B. Recommendations
The Government and related authorities need to consider to build typical link model across the chain to improve production capacity and stabilize eel production for actors throughout the whole chain. It is necessary to invest in science and technology for processing value-added products of eels as well as to pay attention on trade promoting to expand export markets including fresh and processing value added eel products.
ACKNOWLEDGMENT
The authors would like to express sincere thanks to the enthusiastic support of Department of Fisheries in An Giang province, and An Giang Fisheries Breeding Center through the Provincial Science and Technology Research with code No. 373.2017.16 . The grateful thank goes to the students of the Class of Fisheries Economics, Grade 40, College of Aquaculture and Fisheries for their support in collecting data for this study.
REFERENCES
[1] General Statistics Organization, Statistical Data of Agriculture, Forestry and Fisheries for Year 2016, 2017, Ha Noi: General Statistics Organization. (in Vietnamese).
[2] M. Marschke, A. Wilkings, ‘’Is certification a viable option for small producer fish farmers in the global south? Insights from Vietnam.’’ Journal of Marine Policy. Vol 50 (Part A), 2014, pp. 197-206
[3] An Giang Department of Statistic, Statistical data of An Giang Province in 2015 and plan, mission for aquaculture 2016. Report of An Giang Department of Fisheries, 2015. (in Vietnamese).
[4] T. T. Nhan, Tan Chau town: Consideration on comercial culture of swamp eel. Accessed from http://thuysanvietnam.com.vn/thi-xa-tan-chau-an-giang-quan-tam-phat-trien-mo-hinh-nuoi-luon-thuong-pham-article-10909.tsvn, 2018 (in Vietnamese).
[5] V. Chuong, N. V. Thai, Farming tachnique of swamp eels. Publisher: Thanh Hoa, 2015, 94 pp. (in Vietnamese).
[6] N. T. Long, N. T., ‘’Technical and financial aspects of eel (Monopterus albus) farming model in An Giang model.’’ Journal of Agriculture and Rural Development. Vol. 1, 2015, pp. 89-95. (in Vietnamese).
[7] L. X. Sinh, ‘’Value chain of Pangasius catfish (Pangasianodon hypophthalmus) in the Mekong delta.’’ Journal of agriculture and Rural Development. Vol. 7, 2011, pp. 67-73. (in Vietnamese).
[8] L. V. G. Nho, N. P. Son, N. V. An, ‘’Current situation of catffish value chain in the Mekong Delta.’’ Journal of agriculture and Rural Development. Vol. 1, 2012, pp. 51-57. (in Vietnamese).
[9] N. T. T. Vinh, T. H. Cuong, D. V. Hieu, ‘’Some theoretical issues about seafood value chain analysis.’’ Journal of Science and Development. Vol. 1, 2013, pp. 125-132. (in Vietnamese).
[10] V. D. M. Berg, et al., Making Value chains work better for the poor: A toolbook for practitioners of Value Chain Analysis. Publications of Making Markets Work Better for the Poor (N4P) and Asian Development Bank, 2013, 85 pp.
[11] People Committee of An Giang, An Giang web portal. Accessed from http://www.angiang.gov.vn/wps/portal/, 2018. (in Vietnamese).
[12] P. Kaplinsky, M. Morris, A handbook for value chain research. A handbook prepared for the IDRC, 2003.
[13] D. Becker, P. N. Tram, H. D. Tu, Development of value chain: tool for increasing value for agriculture. Report for GTZ, 2009.
[14] V. T. T. Loc, N. P. Son, Analysis value chains (application for agiculture).
Textbook: 1st editor. Can Tho city, Vietnam. Publisher of Can Tho University, 2016, 150 pp. (in Vietnamese).
[15] G. Macfadyen, et al., Value chain analysis of Egyptian aquaculture. Project report 2011-54. The WorldFish Center. Penang, Malaysia, 2011, 84 pp. [16] M. F. Alam, et al., Marketing of major fish species in Bangladesh: A value
chain analysis. Report for project entitled “a value chain analysis of international fish trade and food security with an impact assessment of small-scale sector”. Food and Agriculture Organization, 2012, 56 pp.
[17] R. L. Kohls, J. N. Uhl, Marketing of agricultural products. 9th ed. Macmillan publishing co., Inc., New York, 2005.
[18] D. M. Chung, L. X. Sinh, Analysis of snakehead fish (Channa sp.) culture in the Mekong Delta. Conference proceeding of aquaculture and fisheries science No. 4. Ho Chi Minh city: Publisher: Ho Chi Minh Agriculture, 2011, pp. 512-523. (in Vietnamese).
[19] N. P. Son, H. V. Hien, L. V. De, L. B. M Quan, Report of shrimp value chain in Tra Vinh province. Final report the research of climate change adaptation project at the Mekong delta in Tra Vinh province (AMD Tra Vinh), formed by the International Fund for Agricultural Development (IFAD), 2016, 48 pp. (in Vietnamese).
[20] M. Zhang, M., ‘’Vertical and horizontal linkages with small-scale farmers in developing countries: evidence fromn China.’’ The Ritsumeikan Economic Review. Vol. 60 (3), 2015, pp. 438-449.
[21] A. K. M. Nowsad, Supply and Value Chain of Fish in Super-shop Outlets in Dhaka City. BAU Department of Fisheries Technology, 2016, 49 pp
AUTHORS
First Author – Nguyen Thi Kim Quyen, Msc. College of Aquaculture and Fisheries, Canto University, Vietnam, [email protected]
Second Author – Huynh Van Hien, Msc. College of Aquaculture and Fisheries, Canto University, Vietnam, [email protected]
Third Author – Nguyen Hoang Huy, Msc. Department of Fisheries, An Giang province, Vietnam, [email protected]
Correspondence Author – Nguyen Thi Kim Quyen,
www.ijsrp.org
[image:6.612.36.517.441.573.2]Fig. 1. Map of An Giang Province Shows Location of Field Survey (Source: People Committee of An Giang, 2018) [11]
Table 1. Study Sites and Distribution of Respondents
(Source: Field survey, 2018)
Stakeholders Feed &drug suppliers
Breeding& nursing sites
Culture Farmers
Traders & wholesalers
Super market
Total
Long Xuyen city 7 2 30 10 2 51
Chau Thanh 5 15 30 10 - 60
Thoai Son 5 30 10 - 45
An Phu 5 15 40 10 - 70
Chau Phu 3 - 20 10 - 33
Tan Chau 5 - 30 8 - 43
www.ijsrp.org
Fig. 2. Mapping the Distribution Channels of Eel Value Chain in An Giang Province
(Source: Developed by authors, 2018)
Table 2: Marketing Channels of Eel Products Crossed Key Actors
(Source: Developed by authors, 2018)
Table 3: Cost-profit Distribution in Channel 1
(Source: Developed by authors, 2018)
Channel – 1 Eel Farmer Trader Retailer In-province consumption
Channel - 2 Eel Farmer Trader Wholesaler Retailer In-province consumption
Channel – 3 Eel Farmer Wholesaler Supper market In-province consumption
Channel – 4 Eel Farmer Wholesaler Wholesale market Out-province consumption
Channel – 5 Eel Farmer Wholesaler Export
Indicators Farmer Trader Retailer Total
Revenue/selling price ($/kg) (I) 6.14 6.67 7.11
Total cost ($/kg) (II = III +IV) 3.20 6.29 6.73
Intermediate cost/buying price ($/kg) (III) 3.08 6.14 6.67
Additional cost ($/kg) (IV) 0.11 0.15 0.06 0.33
Added value ($/kg) (V = I – III) 3.05 0.53 0.45 4.03
% Added value 75.80 13.20 11.00 100
Net profit/net added value ($/kg) (V-IV) 2.94 0.38 0.38 3.70
% net added value 79.50 10.20 10.30 100
Profitable margin (net added value/Total cost) (%) 92.00 6.00 5.70
Inputs: - Seeds - Feed - Drugs
Eel farme rs
Traders
Wholesal ers
Wholesale markets
Super markets Retailers
3.3%
Export
73.1%
88.4% 15.3%
45.2%
3.9%
32.3% %
60.5%
3.9% 11.6%
32.3%
In-province consumpt ion
Input suppliers Producers Middlemen
Trading Consumption [image:7.612.40.509.553.705.2]
www.ijsrp.org
Table 4: Cost-profit Distribution in Channel 2
Indicators Farmer Trader Wholesaler Retailer Total
Revenue/selling price ($/kg) (I) 6.14 6.67 7.59 9.09
Total cost ($/kg) (II = III +IV) 3.20 6.29 6.90 7.65
Intermediate cost/buying price ($/kg) (III) 3.08 6.14 6.67 7.59
Additional cost ($/kg) (IV) 0.11 0.15 0.24 0.05
Added value ($/kg) (V = I – III) 3.05 0.53 0.92 1.50 6.01
% Added value 50.80 8.90 15.40 25.0 100.0
Net profit/net added value ($/kg) (V-IV) 2.94 0.38 0.69 1.44 5.45
% net added value 54.00 6.90 12.60 26.50 100
Profitable margin (net added value/Total cost) (%) 92.00 6.00 9.90 18.90
[image:8.612.36.501.275.453.2](Source: Developed by authors, 2018)
Table 5: Cost-profit Distribution in Channel 3
(Source: Developed by authors, 2018)
Table 6: Cost-profit Distribution in Channel 4
Indicators Farmer Wholesaler Wholesale market Total
Revenue/selling price ($/kg) (I) 6.64 7.59 7.95
Total cost ($/kg) (II = III +IV) 3.20 6.87 7.67
Intermediate cost/buying price ($/kg) (III) 3.08 6.64 7.59
Additional cost ($/kg) (IV) 0.11 0.24 0.08 0.43
Added value ($/kg) (V = I – III) 3.55 0.95 0.36 4.87
% Added value 72.90 19.60 7.50 100
Net profit/net added value ($/kg) (V-IV) 3.44 0.72 0.28 4.44
% net added value 77.50 16.20 6.30 100
Profitable margin (net added value/Total cost) (%) 107.70 10.40 3.70
(Source: Developed by authors, 2018)
Indicators Farmer Wholesaler Supermarket Total
Revenue/selling price ($/kg) (I) 6.64 7.59 9.86
Total cost ($/kg) (II = III +IV) 3.20 6.79 8.01
Intermediate cost/buying price ($/kg) (III) 3.08 6.64 7.59
Additional cost ($/kg) (IV) 0.12 0.15 0.42
Added value ($/kg) (V = I – III) 3.56 0.95 2.27 6.78
% Added value 52.40 14.10 33.50 100
Net profit/net added value ($/kg) (V-IV) 3.44 0.8 1.85 6.09
% net added value 56.50 13.10 30.40 100
[image:8.612.41.505.501.672.2]www.ijsrp.org
Table 7: Cost-profit Distribution in Channel 5
(Source: Developed by authors, 2018)
Table 8: SWOT matrix of eel industry in An Giang province
SWOT
Opportunities O1: Wide markets
O2: High demand for eel artificial
breeding
O3: Many studies on eel (disease and
nutrition).
O4: Be concerned by relevant
authorities.
O5: High efficiency, consume easily.
O6: Several studies on pellet for eel
farming.
Threats
T1: Impacts of weather and environment
T2: Less export markets
T3: Disease is increasing
T4: Lack of market information (price,
grading, market demand)
T5: High production cost (standard
compliance), unstable price
T6: Lack of trainings and conference
on eel production
T7: Increasing in input factors
T8: Low competition due to shortage
of added value eel products
Strengths
S1: Experience in production
S2: Owning artificial eel breeding
in province
S3: Relative high selling price
S4: High density of eel traders and
wholesalers
S5: Easy technique
S6: High quality due to standard
compliance (VietGAP)
Offensive solutions (SO) S1-4O1-3: Invest in clean farming
models to improve productivity, efficiency and quality assurance.
S5-6O4-6: Step up the application of
advance technologies to production, such as pellet processing, high-tech farming models, and trade promotion for export
S4O1: Strengthen chain linkage across
the chain.
Adaptive solutions (ST)
S1T1,3,6: Develop trainings of clean
farming models, climate change adaptation, and disease management.
S2-6T2, 5,8: Invest technology to
research added value products, reduce production costs, improve
competitiveness of eel goods
S3T4: Support to provide market
information for farmers to orient production-oriented markets
Weaknesses
W1: Weak technique of eel
breeding and farming
W2: Lank of investment capital
W3: Pellet feed can’t completely
replace live feed
W4: Weak linkages that resulted in
unstable production
W5: Farmers do still not concern on
artificial breeding
W6: There are no specializing
agents selling food and drugs for eel farming
Adjustment solutions (WO) W1,3,5,6O1,2,4,6: Improve production
capacity for farmers
W2O1,2,4,5: Low-interest credit support
policy for farmers to invest in production
W4O4: Building a typical linkage
model of eel production and consumption chains in the locality
Defensive solutions (WT) W1,23,5,6T1,2,4,5: Reorganize eel
production industry to improve efficiency, stabilize production and limit risks
W4T1,3,5,6: Improve production
capacity for chain actors through training courses
W1T8: Invest in development of
value-added products and market brand of eel products
(Source: Developed by authors, 2018)
Indicators Farmer Wholesaler Total
Revenue/selling price ($/kg) (I) 6.50 7.59
Total cost ($/kg) (II = III +IV) 3.20 6.79
Intermediate cost/buying price ($/kg) (III) 3.08 6.64
Additional cost ($/kg) (IV) 0.11 0.15 0.26
Added value ($/kg) (V = I – III) 3.42 0.95 4.37
% Added value 71.60 28.40 100
Net profit/net added value ($/kg) (V-IV) 3.30 0.8 4.10
% net added value 73.70 26.30 100
[image:9.612.36.538.284.718.2]![Fig. 1. Map of An Giang Province Shows Location of Field Survey (Source: People Committee of An Giang, 2018) [11]](https://thumb-us.123doks.com/thumbv2/123dok_us/9061682.977896/6.612.148.483.56.368/giang-province-shows-location-survey-source-people-committee.webp)