Classification of Motor Imagery Right and Left Hand
Movement EEG Signals for BCI Application Based on
Statistical Analysis
Htin Lin Kyaw*, La Pyae Lynn**, HninThidar Aye**
* Mechatronic Department, Yangon Technological University
Yangon, Myanmar
**Mechatronic Department, Yangon Technological University
Yangon, Myanmar
DOI: 10.29322/IJSRP.9.10.2019.p9441 http://dx.doi.org/10.29322/IJSRP.9.10.2019.p9441
Abstract-EEGaccepted a device to analyze the action of the brain when it is completing any task. EEG signals are appropriated for BCI application andhelp humans to understand concerning the brain functions and its activities and hence are helpful in the diagnosis of the neurobiological disorders in it. It has the three main steps to complete classification process. Firstly, the artifacts are eliminated from the EEG signals to obtain the accurate results by using Elliptical filter. Secondly, the specific signal features are extracted from the artifacts free signals by using DWT method. Finally, the t-distribution test statistic is used for classification with the level of significance (α),0.05. The classification accuracy is 95% within the 100 trained data and 25 test data right and left-hand motor imagery movement, respectively.
Index Terms- BCI, DWT, EEG, Elliptical, t-distribution
I. INTRODUCTION
n modern society, brain-computer interfaces (BCIs) are one of the suitable methods that connect between the human brain and the external life of the world. BCIs described as “a new non-muscular communication and control channel, a direct brain”. All over the world, many researchers have proposed some BCIs applications, such as speller, wheelchair control, robot arm control, etc. So, the disabled individual’s life and normal people have been improved because of BCIs applications in the world. At not only applications but also sources of biometric information, Electroencephalogram (EEG) signals are used.
Brain electric signals are produced by the assault of neurons within the brain. Electroencephalography (EEG), magneto electroencephalography (MEG), and functional magnetic resonance imaging (fMRI) are used for the brain signals recording. But, EEG is the most widely used method to record brain activities. As it is non-invasive, it does not require surgical intervention, and it is less expensive than the other alternative. The brain electric signals are recorded by setting multiple electrodes of EEG over the scalp. EEG is most commonly used for recording brain activities in BCI other than recording methods. The recorded EEG pattern is very helpful to the physician for various diagnostics such as the finding of an epileptic seizure, tumor, and other medical disorders [1]. It has been seen by the study that every individual has a different EEG pattern, i.e., EEG pattern is person dependent and contrasts from individual to individual also can be applied as an origin of biometric information[2]-[3].
The researchers have observed that these signals show the brain function and situation of the whole body. Accordingly, EEG signals help provide reliable information regarding the brain functions and neurobiological disorders to provide an optical display of the recorded waveform and allow computer-aided signal processing techniques to classify them. This operates as a prime motivation to implement the advanced digital signal processing techniques for their investigation[4]. Real-time automated EEG signal analysis in clinical settings provides excellent assistance to clinicians in identifying neurobiological diseases and prevention of the possibility of missing (or misreading) data. To develop advanced BCI technology, signal processing, and classification methods are vital tools. Nevertheless, the automatic classification of EEG signals is a challenging obstacle as the morphological and temporal characteristics of EEG signals show significant changes for different patients and under different temporal and physical conditions. These factors motivate to apply the advanced digital signal processing techniques on the EEG signals.
Most of EEG range is from 0.5 to 500Hz, but some important rhythms are the alpha rhythm, in the frequency range of 8 to 12 Hz, related to a relaxing state and recording the occipital area of the brain; the beta rhythm (12-25 Hz), correlated to an attention state; the theta rhythm (4-8Hz), related to attention and information uptake, processing, and learning or recalling memory; the mu rhythm (8-12 Hz), recorded over the sensor motor area of the brain and relevant to motor movement and imagery. The mu rhythm is the most important for the identification and classification of motor movement and imagery because it recorded next to the brain area responsible for movement [5].
This paper is organized into five sections: section I is about a brief introduction to EEG signal, section II describes the data collection and description of the system, section III is about methodology, section IV presents the results obtained from our study. Finally section V includes the conclusions of the paper.
II. DATA COLLECTION AND DESCRIPTION
[image:2.612.226.389.230.384.2]In this paper, the motor imagery hand movement EEG signal is applied to classify left-hand and right hand movement. The developers of the BCI2000 instrumentation system designated the data used in this paper in the PhysioNet [6], which they used in making these recordings. The motor imagery hand movement dataset is publicly available at https:/www.physionet.org/pn4/eegmmidb/, and also the introduction of the BCI2000 system can be reviewed at www.bci2000.org. The international 10-10 system employing 64 electrodes is used for the recording of this data with 160 Hz sampling frequency. Figure 1 shows the electrodes placement of 64 channels EEG. Over 1500 data one-minute and two-minute EEG recordings have consisted of the whole database, and also they obtained from 109 volunteers. Each subject performed 14 experimental runs (1 -14 tasks) with 6 different tasks. Among the 14 experimental runs (1-14), 4, 8 and 12 runs are used for this paper because these runs used Task 2(imagine opening and closing left or right fist/ left and right motor imagery hand movement).
Figure 1. Electrodes placement of 64 channels EEG [5]
Figure 2 shows the experimental runs in task 2. In this research, only subject S001 to S020 (20 volunteers) selected to be analyzed. In one experimental run of Task 2, 3 events performed one by one, such as ''rest'', ''imagine opening left fist'', and ''imagine opening right fist''. Each event had duration with an approximate 4.1 or 4.2 seconds. Therefore, about 7events for each left and right-hand motor imagery movement are available in a run, and 42 events ( 21 for each left and right-right-hand motor imagery movement) obtained in a subject in the total.Motor imagery movement can notice at the channels C1-C6, CZ, FC1-FC6, FCZ, and CPZ because of the differences in spectrogram amplitudes [7]. Besides, left and right-hand movements have a higher influence on the channels C3 and C4. Accordingly, motor imagery hand movement signals mainly take from the C3 and C4 electrodes, instead of the 64 channels.
rest imagine opening left fist rest imagine opening right fist
[image:2.612.158.459.513.576.2]t=-4.2s t=0s t=4.1s t=8.3s t=12.4s
Figure 2. experimental run in Task 2
III. METHODOLOGY
Creating a BCI system requires the three main steps: signal acquisition, signal processing, and data manipulation. Figure 3 shows the basic block diagram of a BCI system. In the signal acquisition process, the brain electric signals are recorded from the human brain using EEG. Then, they require digitizing to be practiced by a computer application. During signal processing, collected signals are analyzed to prepare the control signals. But, offline data use in this study. The raw data getting from the offline data are pdf file, so, they need to change to the mat file because all the computation have made in Matlab 2014a, in this study. The system procedures show in figure 4.
can easily influence the brain signals because of physiological artifacts and external sources of artifacts. Thus, that noise called artifacts signals to need to eliminate since it may lead to bias the analysis of the EEG signals and may lead to an improper conclusion. It requires the artifacts free signals to extract the left hand and right-hand motor imagery movement features before the classification process. During this process, some filters were used to eliminate the artifacts in the past such as Butterworth filter, Chebyshev filter, etc. However, in this paper, Elliptical bandpass filter with the 4Hz and 30 Hz cut off frequency is used for the artifacts cancellation process as the recommended filter.
The second part of signal processing is feature extraction. Feature extraction means extracting specific signal features. In this work, the Discrete Wavelet Transform (DWT) is used to get the required signal features by decomposing.The last signal processing process is classification, the interpretation algorithm, in which it translates the extracted signal features into device commands orders to carry out the user’s intent. The signals classify on both frequencies and shapes. In this paper, test statistics of statistical analysis are used to complete the classification process. In data manipulation, once the signals are classified, the output is managed to accommodate the output devices (e.g. computer screen or wheelchair).
Pre-processing Feature Extraction Classification
Signal Acquisition BCI Application
Signal Processing
z Classificaction
[image:3.612.180.431.213.288.2]Human Brain
Figure 3. Basic block diagram of a BCI application
Raw Data (.edf)
Channel Selection (C3,C4) Raw Data (.mat)
Feature Extraction
Classification Extracted Signal
Feature
Motor Imagery Right Hand Movement
Motor Imagery Left Hand Movement START
END Channel Selection
(C3,c4) Artifacts Cancellation
Data Segmentation
Artifacts Free Signal
Figure 4. System flowchart
IV. RESULTS
It has the main three parts to complete the classification process for this study: artifacts cancellation, feature extraction, and classification. All the computations have made in Matlab 2024a.
[image:3.612.213.395.329.662.2]This paper uses Elliptical filter with the 4 Hz and 30 Hz cut off frequency to eliminate the artifacts from the motor imagery left and right-hand movement EEG. Artifacts generally accepted below 4 Hz and above 30 Hz signal, so, the required frequency range is between 4 Hz and 30 Hz. Elliptical bandpass filter has some passband ripples and stopband ripples but the steepest roll-off rate, so, it has the highest response. Therefore, it can almost reach the ideal (4 Hz and 30 Hz cut off frequency).
(a) (b)
(c) (d)
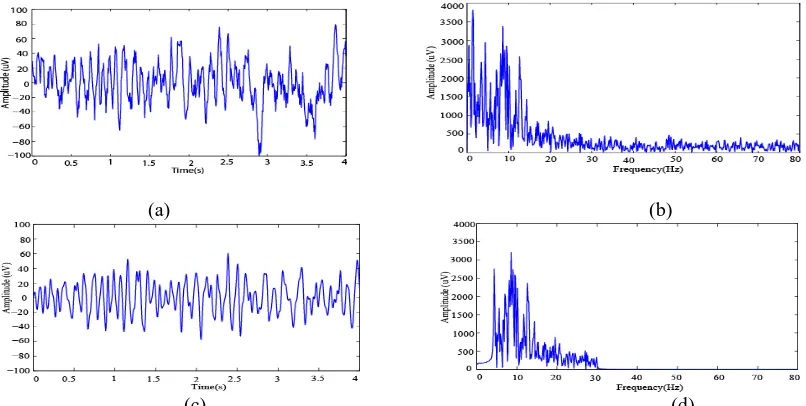
Figure 5. (a) Time domain of motor imagery right hand movement signal , (b) Frequency domain of motor imagery right hand movement signal (c) Time domain of filtered signal (d) Frequency domain of filtered signal
(a) (b)
(c) (d)
Figure 6. (a) Time domain of motor imagery left hand movement signal, (b) Frequency domain of motor imagery left hand movement signal (c) Time domain of filtered signal (d) Frequency domain of filtered signal
Figure 5 and figure 6 (a) shows the time domain of the motor imagery left-hand and right-hand movement EEG raw signal. They need to convert the frequency domain signal to clear what frequency ranges are included in the motor imagery hand movement signal. Figure 5 and figure 6 (b) show the frequency domain of the raw EEG signal, they have some frequencies range. Among them, below 4 Hz and above 30 Hz frequencies need to eliminate. The required artifacts free signal (between 4Hz and 30Hz) is smoothly obtained, after filtering with the Elliptical bandpass filters shown in figure 5 and figure 6 (c), respectively. Figure 5 and 6 (d) shows the frequency domain of the filtered signal using the Elliptical filter. They have no artifacts signal (below 4Hz and above 30 Hz) but, have some ripple causing due to the frequency changes in both sides of cut off frequency.
B. Feature Extraction
[image:4.612.107.505.104.308.2] [image:4.612.106.509.344.547.2]version of the low-pass filter. DWT decomposes a provided signal into increasingly more accurate detail depending on two sets of fundamental roles, the wavelets and the scaling functions of a signal S (t) as follows:
Where, 𝜑(t) and 𝜓(𝑡)are the basic scaling and mother wavelet function respectively.
2 2
2 2
2 2
2 2
S(n) Signal(0-160Hz)
g(n) h(n)
D1
D2
D3
D4 A1
A2
A3
A4 (80-160Hz)
(40-80Hz)
(20-40Hz)
(10-20Hz) (0-10Hz) (0-80Hz)
(0-40Hz)
[image:5.612.227.388.122.293.2](0-20Hz)
[image:5.612.71.548.331.716.2]Figure 7. Decomposition of the signal in four levels
Figure 8. Decomposition of motor imagery right- hand movement signal
Figure 9. Decomposition of motor imagery left- hand movement signal S (t) = ∑ 2𝑗0/2
First-level of approximation, A1 and detail, D1 is called the sampled output signals from the first filters of the original signal. Approximations and details are the high-scale, low-frequency components and the low-scale, high-frequency components of the signal respectively. The two filters are related to each other and they are defined as a quadrature mirror filter. Approximation and detail coefficients of the subsequent level can estimate by using the approximation coefficient of the earlier level. The required decomposition level depends on the commanding frequency components of the signals. After decomposition significant, fivefeatures are collected to make a feature vector for further processing to classify the imagery left hand and right-hand movement. Figure 8 and 9 are showed fourth level decomposition results of motor imagery right and left movement. After decomposition with the fourth level of DWT, the decomposed signal, D4 of the two hand movement signals are used for classification.
C. Classification
In this paper, five features collected after the fourth level decomposition of DWT such as average power, mean, standard deviation, variances, and range. Among them, only average power feature used for classification shown in equation 2. 100 trained data (population) and 25 test data (sample) of average power features are respectively used for right and left-hand movement classification. The classification used in this research is test statistics of statistical analysis called t-distribution. It is also known as ‘‘student’s t-test ’’. It can use below 30 data samples. So, the t-distribution test statistic is used for this work. The following procedure is used to classify motor imagery hand movement by using statistical analysis:
1. Checking the sample (test) data are normal distribution or not. 2. From the problem context, identify the parameter of interest. 3. Choose a significance level, α
4. Determine an appropriate test statistic. 5. State the rejection region for the test statistic.
6. Compute any necessary sample statistic, substitute these into the equation for the test statistic, and compute that value.
7. Hypothesis testing and decision making.
Figure 10 shows the normal distribution checking of the test data with normal probability plot. All the data located at the straight line approximately. Therefore, these test data can use for the study. The plotting position is calculated by using equation 3.Table 1 shows the calculation results for t-distribution. The value of T is calculated by the following equation 4 and also critical region value, t 0.05,24 is taken from the table IV of [8]. According to the results, the value of t-distribution for motor imagery right and left –hand movement is less than t 0.05,24 value of the critical region, so, the mean value of test data is located in the acceptance region. Figure 11 shows the acceptance region and critical region. This means that the mean value of test data are approximately equal the mean value of the trained data with the significance level (α),0.05(5%) and also 95% confidence,95% accuracy.
(2)
(3)
(4)
Where, AP = Average power, Xj = Signal, m = seniority of the data, n = number of sample (test data),
x̄ = sample (test) data mean, μ = population (trained) data mean, S = Standard deviation of sample (test) data, t = t-distribution,
AP = 1𝐿 ∑𝐿 /𝑋𝑗/2
𝑗=0
Plotting Position= m−0.5
n
t = 𝑋−𝜇̅̅̅̅̅̅
[image:7.612.80.571.58.351.2]
(a) (b)
Figure 10. Normal Probability Plot of (a) the test data of motor imagery hand movement (b) the test data of motor imagery right-hand movement
Table 1. Calculation Results
45% 50%
0 Acceptance region
t 0.05,24
[image:7.612.39.258.409.527.2]Critical/Rejected region 5%
Figure 11. The acceptance region and critical region
V. CONCLUSION
In this study, test statistics of statistical analysis called t-distribution is used as classifier, although the related works used machine learning techniques. It approved that statistical analysis can be used to classify two imagery hands movement with standard accuracy and also it has 95% classification accuracy. But, population and sample are assumed as trained and test data respectively, in this study.
ACKNOWLEDGMENT
Special thanks are due to supervision of Dr. LaPyae Lynn and Dr. HninThidar Aye, Department of Mechatronic Engineering (Yangon Technological University) for his kindness and guidelines for this paper. The author really appreciates all the teachers from the Department of Mechatronic Engineering (Yangon Technological University) for their support, encouragement, motivation and invaluable guidance in preparation of this research. The authors would like to express their thanks to all who participated.
MI Right Hand Moment
MI Left Hand Moment Trained Test Trained Test
Sample
Statistics mean mean mean mean
μ 43.6 - 30.1 -
x̄ - 43.7 - 30.5
σ 10 - 6.8 -
s - 10.1 - 6.7
t 0.05, 24 2.79 2.79
REFERENCES
[1] Teplan, M. (2002). Fundamentals of EEG measurement. Measurement Science Review, 2 (2), 1-11.
[2] Eischen, S.E., Luckeritz, J.Y., Polish, J. (1995). Spectral analysis ofEEGfrom families.BiologicalPsychology, 41, 61-68.
[3] Poulos, M., Rangoussi, M., Hrissikopoulos, V., Evangelou, A. (1999). Person identification based on parametric processing of the EEG. In Proceedings ofthe IEEE International Conference on Electronics,Circuits, and Systems, 5-8 September 1999. IEEE, 283- 286. B. Smith, “An approach to graphs of linear forms (Unpublished work style),” unpublished.
[4] GiuseppinaInuso ,”Wavelet-ICA methodology for efficient artifact removal from Electroencephalographic recordings”, Proceedings of International Joint Conference on Neural Networks, Orlando, Florida, USA, August 12-17, 2007.
[5] H. Mizuhara, “Cortical dynamics of humanscalp eeg origins in a usually guided motor execution,” NeuroImage, vol.62, no. 3, pp. 1884-1895, 2012.
[6] A. L.Goldberger, L. A. N. Amaral, L. Glass, J. M. Hausdorff, P. C. Ivanov, R. G. Mark, J. E. Mietus, G. B. Moody, C-K. Peng, and H. E. Stanley, “Physio Bank, PhysioToolkit, and PhysioNet: Components of a New Research Resource for Complex Physiological Signals”, Circulation, vol. 101,pp,e215-e220,2000. [7] Gert Pfurtscheller and Christa Neuper, “Mortor Imagery and Direct Brain-Computer Communication,” Procedings of the IEEE, vol. 89, no. 7, Joly 2001 [8] Douglas C. Montgomery, George C. Runger, ‘‘Applied Statisticsand Probability for Engineering ’’, Third Edition.
AUTHORS
First Author – Htin Lin Kyaw, Ph.D Candidateand htinnlinnkyaw@gmail.com.
Second Author – La Pyae Lynn, Professor, Yangon Technological University and mglapyae81@gmail.com.
![Figure 1. Electrodes placement of 64 channels EEG [5]](https://thumb-us.123doks.com/thumbv2/123dok_us/9045944.975916/2.612.226.389.230.384/figure-electrodes-placement-channels-eeg.webp)