ISSN 2250-3153
Physiological responses of chickpea genotypes for
drought tolerance under induced moisture stress
V. M. Dharanguttikar, R. W. Bharud, V.H.Borkar
Department of Botany, Mahatma Phule Krishi Vidyapeeth, Rahuri-413 722, Dist.: Ahmednagar (M.S.), India
Abstract- Thirty chickpea genotypes were evaluated for moisture
stress tolerance imposing by PEG-6000 in growth chamber, at Phytotron facility, Department of Botany, MPKV, Rahuri during
Rabi-2013. The germination test and seedling growth under control and moisture stress were recorded to study the genotypic variation for moisture stress tolerance. Ten seeds were sown in germination paper and water stress treatments (0, -0.4 and -0.6 bar solution) create by Polyethylene glycol (6000). PEG-6000 (Distilled water, 178 and 223 mg) dissolving in 1 L of half strength Hoagland's nutrient solution separately to create water stress treatments of control , -0.4 and -0.6 bar, respectively. The experiment was laid out in a completely randomized design with two replications for each experimental unit. The observations on germination count at every 2 days interval upto 8 days and seedling length and dry matter after 8 days were taken. The genotypic variation was statistically significant for all the parameters. On the basis of stress parameters, the genotypes, NBeG 47-1, PBC-161 and BBG-2 for germination, GJG-1010 and PBC-161 for seedling growth and NBeG 47-1 and PBC-161 for higher dry matter production were found to be moisture stress tolerance.
Index Terms- Chickpea, moisture stress, PEG solution,
germination, seedling growth, dry matter and vigour index.
I. INTRODUCTION
ater, the most important component of life, is rapidly becoming a critically short commodity for humans and their crops. Shortage of water limits plant growth and crop productivity in arid regions more than any other single environmental factor (Boyer, 1982). Chickpea (Cicer arietinum
L.) is a staple food of the world. It is one of the most important pulse crops which provide more calories in the form of starch and proteins; besides vitamins and diet than any other food crop. Water stress reduces crop yield regardless of the growth stage at which it occurs in chickpea. Arid and semi arid environment besides other factors may induce water stress during crop growth and development, results a reduction in crop yield (Ashraf et al., 1995). In spite water stress is recognized as an important factor that affects chickpea growth and yield, differences among cultivars were found in response to soil moisture restrictions. Turgor maintenance plays an important role in drought tolerance of plants which may be due to its involvement in stomatal
regulation and hence photosynthesis (Ludlow et al., 1985). Water is essential at every stage of plant growth from seed germination to plant maturation. Water stress reduces crop yield regardless of the growth stage at which it occurs the adverse effect of water stress on crop yield may be more pronounced at some particular growth stage (El-Far and Allan, 1995) depending upon the nature of crop species and even genotypes within the species. To cope with drought stress to have handsome crop growth and yield, breeding for drought tolerance can best be accomplished by selecting for grain yield under field conditions (Richards, 1978), but such procedures require full season field data. It is not always an efficient approach, especially in mesic locations. An alternative may be to screen material under laboratory or greenhouse conditions using seedlings as test material. Several physiological characteristics have been reported as being reliable indicators for the selection of germplasm possessing drought tolerance. These characteristics include seed germination and seedling growth in nutrient solutions with low osmotic potential (Ashraf et at, 1992; Blum, 1980; Richards, 1978), the degree of electrolyte leakage (cell membrane stability, CMS) from drought-damaged leaf cells and the water relations of plants (Dedio, 1975; Ashraf et al., 1992). Screening of different crop plants to abiotic stresses is used to find out most resistant variety (Zafar-ul-Hye et al., 2007). While screening genotypes for most drought sensitive and most drought tolerance it was considered that the success of these approaches under green house and lab conditions depends on their same behavior under field condition also.
II. MATERIALS AND METHODS
1.1 Seed treatment and preparation of stress solution.
The seed surfaces were sterilized with 10% sodium hypochlorite solution for five minutes and wash three times with distilled water. The polyethylene glycol (PEG-6000) was dissolved in 1 L of half strength Hoagland's nutrient solution for creating moisture stress. Pure Hoagland's nutrient solution is used as control, while 178 and 223 mg of polyethylene glycol (PEG-6000) was added separately in 1 ltr Hoagland's nutrient solution for stress treatment as -0.4 and -0.6 bar solution, respectively.
2.2. Experimental set‐up
Thirty chickpea genotypes were evaluated for drought stress tolerance efficiency in growth chamber, at Phytotron facility, Department of Botany, MPKV, Rahuri during Rabi-2013. In between paper method was adopted for germination test. Ten seeds were sown in germination paper. The experiment was laid out in a completely randomized design with two replications for each
ISSN 2250-3153
experimental unit. The control (0.0 Mpa) and water (-0.4 and -0.6 Mpa) stress treatments were given by prepared solutions. Five ml of appropriate treatment solution applied daily on each germination roll having good drain. The germination count was undertaken at every two days interval from sowing and expressed on per cent basis. The root, shoot and seedling length and dry matter of seedling was recorded after 8 days.
2.3. Collection of data and statistical analysis
Percentage of germination stress tolerance index is determined by Almudaris (1998)
Promptness index is the percentage of seed which germinate at 2nd, 4th, 6th and 8th day of observation as indicated by nd2, nd4, nd6 and nd8 (Sammar Raza, 2012).
PI:nd2 (1.00) + nd4 (0.75) + nd6 (0.50) + nd8 (0.25)
Vigour Index (VI) was calculated by using the formula of Abdul-Baki and Anderson (1970).
VI= TG (%) x seedlings length (mm) 100
Germination Stress Index (GSI) was calculated using the formula;
G.S.I. (%) = Promptness index of stressed seeds
Promptness index of control seeds X 100
Germination rate index (GRI) was calculated by the formula given by Almudaris (1998);
GRI = G1
1 +
G2
2 + ---+
Gx x
G1, G2… Gx represents the percentage of germination in first, second and xth day after sowing respectively
Mean germination time (MGT) calculated according the formula given by Ellis and Roberts (1981);
MGT= Σ (ni/di) ni: number of germinated seeds and di: day of counting
Germination index (GI) according to the equation by Kader and Jutzi (2004);
GI= Σ(Ti x Ni) Ti: number of day after sowing
Ni: number of germinated seeds in the day
Coefficient of velocity (CV) = (number of germinated seeds per day) according to formula given by Kader and Jutzi (2004).
CVg= ΣNi
100 x Σ (Ti x Ni)
After 8 days, germination percentage, stress index (SI), stress susceptibility index (SSI) and germination stress tolerance index (GSI) is determined by Sammar Raza (2012)
SI = 1 - Promptness index of stressed seeds (PI0) Promptness index of control seeds (PI1)
GSI (%) = PI0
PI1 X 100
After 8 days seedlings were harvested and their seedling length were recorded. The stress index (SI), stress susceptibility index (SSI) and seedling length tolerance index (SLSI) is determined as below and Seedling (Sammar Raza, 2012).
GP (%) =
Total number of germinated seeds Total
seed sown x 100
SSI = 1-[PI0/PI1]
D D = 1-
ISSN 2250-3153
SI = 1 - Seedling length under stressed condition (SL0) Seedling length under control condition (SL1)
SLSI(%) = SL0
SL1 x 100
After drying the plant in oven at 700C for 24 hours, the dry matter stress tolerance index is determined by Sammar Raza (2012).
SI = 1 - Seedling dry weight under stressed condition (DM0) Seedling dry weight under control condition (DM1)
DMSI (%) = DM0
DM1 x 100
The mean data analyzed for analysis of variance by Panse and Sukhatme (1985).
III. RESULTS AND DISCUSSION
Present studies show genotypic variations in germination, promptness index, seedling length, dry matter and seedling vigour grown under 0, -0.4 and -0.6 Mpa. However, not all these parameters were not proved to be equally effective for screening the genotypes for their tolerance to stress. It was claimed by Fernandez (1992) that selection based on STI (stress tolerance index) would help to evaluate the higher stress tolerance genotypes with good yield potential. Bouslama and Schapaugh (1984) reported same findings in soybean. However, there are other reports (Richards, 1978) indicating germination as a useful criterion in screening for water stress tolerance. Several factors disproved seed quality such as the age of the seed, abiotic factors during plant life, growth and development, harvest and post harvest conditions etc. The response of genotypes may be different to different factors, which could be reflected in their respective seed performances.
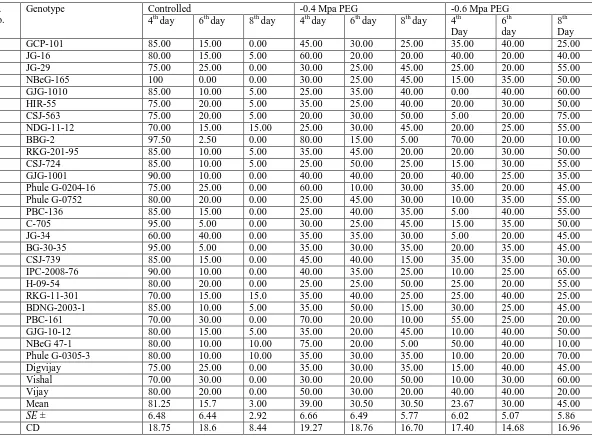
The data indicated significant variation among genotypes for germination percentage. Significantly highest germination percentage was recorded in NBeG-165 (100%), BBG-2 (97.5%), C-705 (95%) and BG-30-35 (95%) on 4th day, JG-34 (40%) on 6th day and NDG-11-12 (15%) and RKG-11-301 (15%) on 8th day under controlled condition (Table 1). While under, moisture stress imposed by -0.4 Mpa, BBG-2 (80%), NBeG 47-1 (75%) and PBC-161 (70%) on 4th day, BDNG-2003-1 (50%), CSJ-724 (50%), RKG-201-95 (45%), GJG-1001 (40%) and CSJ-739 (40%) on 6th day and CSJ-563 (50%), H-09-54 (50%), Vishal (50%), JG-29 (45%), NBeG-165 (45%) and NDG-11-12 (45%) on 8th day recorded the highest germination percentage. The genotypes, BBG-2 (70%), PBC-161 (55%) and NBeG 47-1 (50%) 4th day, GCP-101, GJG-1010, PBC-136, RKG-11-301, GJG-10-12, NBeG 47-1, Digvijay and Vijay (40%) on 6th day and CSJ-563 (75%) and Phule G-0305-3 (70%) on 8th day under the moisture stress imposed by -0.6 Mpa maintained higher germination percentage. Ashraf et al. (1992) concluded that under moisture deficit, germination is not the standard for predicting plant’s drought tolerance.
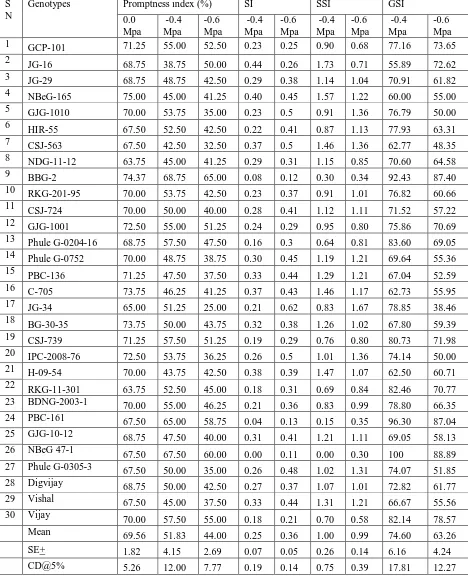
The promptness index analysed under control and stress condition revealed that, the genotypes, NBeG-165 (75.00%), BBG-2 (74.37%), C-705 (73.75%) and BG-30-35 (73.75%) had higher promptness index under controlled condition. While, BBG-2 (68.75 and 65%), NBeG 47-1 (67.50 and 60.00%) and PBC-161 (65.00 and 58.75%) maintained higher promptness index under stress imposed by -0.4 and -0.6 Mpa bar solution of PEG, respectively (Table 2). It is interesting to note that, the similar genotypes maintained minimum SI and SSI and maximum GSI. Therefore, these genotypes can be considered as moisture stress tolerance.
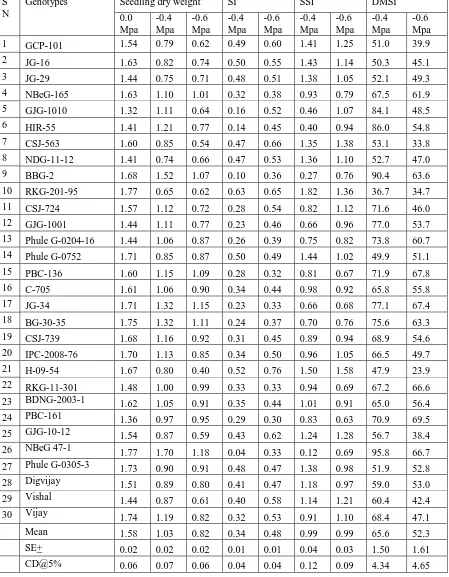
The productivity of genetically different varieties and their consistency is determined by seedling growth plus the correlation of other parameters like dry matter accumulation, Plant height and root length. The seedling length recorded on 8th day, the genotypes,JG-34 (26.80 cm), RKG-201-95 (26.50 cm) and BG-30-35 (25.30 cm) under control, NBeG 47-1(12.03 cm), BBG-2 (9.50 cm) and JG-34 (8.85) under -0.4 Mpa stress and NBeG 47-1 (8.00 cm), JG-34 (7.35 cm), BG-30-35 (6.98 cm) and PBC-47-136 (6.95 cm) under -0.6 Mpa stress recorded the highest seedling length (Table 3). Amongst the genotypes under study, GJG-1010 and PBC-161 maintained minimum SI, SSI and maximum SLSI under stress imposed by -0.4 and -0.6 Mpa bar solution of PEG. In addition to this, GJG-1010 under -0.4 Mpa and PBC-161 under -0.6 Mpa recorded lower SI, SSI and higher SLSI. On the basis of this parameter, GJG-1010 and PBC-161 seems to be moisture stress tolerant.
After drying the seedlings in oven at 700C for 24 hours, seedling dry matter and calculated SI, SSI and DMSI are presented in table 4. The genotype, NBeG 47-1 maintained higher rate of seedling dry matter under control (1.77 g) and stress under -0.4 Mpa (1.70 g) and -0.6 Mpa (1.18 g). This genotype also maintained minimum SI and SSI and maximum DMSI at -0.4 Mpa stress and the genotype PBC-161 at -0.6 Mpa stress situation. In addition to this, RKG-201-95 (1.77 g) and BG-30-35 (1.75 g) under control, BBG-2 (1.52 g), JG-34 and BG-30-35 (1.32 g) stress at -0.4 Mpa and BG-30-35 (1.11 g) and PBC-136 (1.09 g) stress at -0.6 Mpa. In addition to this, NBeG 47-1 at -0.4 Mpa, while, PBC-161 at -0.6 Mpa recorded lower SSI = 1-[SL0/SL1]
D D = 1-
Population mean of SL0 Population mean of SL1
SSI = 1-[DM0/DM1]
D D = 1-
ISSN 2250-3153
rate of SI and SSI and higher rate of DMSI. On that basis, NBeG 47-1 and PBC-161 were found better for maintaining this parameter. Brukner and Frohberg (1987) reported DSI (dry matter stress tolerance index) as a parameter for measuring genotypic yield potential under drought stress conditions. For identifying healthy and vigorous seed lots capable of establishing appropriate populations under deficit soil moisture conditions or under abiotic stress (Ibrahim et al., 2007), the germination test of seed may be useful, but these genetic differences may not be related to subsequent growth of seedling and seed yield.
Germination rate index (GRI) and mean germination time (MGT) were comparatively higher under controlled condition than moisture stress induced by PEG-6000 (Table 5). The genotypes, NBeG-165 (25.0% & 2.5 days), BBG-2 (24.79% & 2.5 days) and C-705 and BG-30-35 (24.58% & 2.5 days) under control, BBG-2 (23.13% & 2.3 days), NBeG 47-1 (22.71% & 2.3 days), PBC-161 (22.08% & 2.2 days) and JG-16 (20.83% & 2.1 days) under stress at -0.4 Mpa and BBG-2 (22.08% & 2.2 days), PBC-161 (20.42% & 2.0 days), NBeG 47-1 (20.42% & 2.0 days) and Vijay (19.17% & 1.9 days) under stress at -0.6 Mpa maintained higher GRI and MTG, respectively (Table 5). On the basis of this parameter BBG-2, PBC-161 and NBeG 47-1 were found better for moisture stress condition.
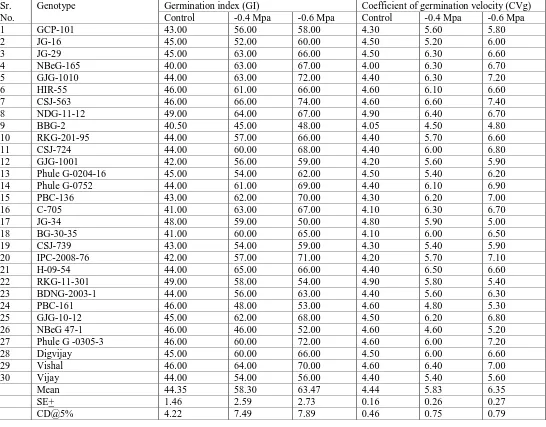
The values for germination index (GI) and coefficient of germination velocity (CVg) were higher under stress condition than the control (Table 6). It indicated that the germinability will be delayed by imposing the stress. The low germination index and coefficient of germination velocity is the desirable direction for stress tolerance. In the present investigation, the genotypes, NBeG-165 (40.00% & 4.00), BBG-2 (40.50% & 4.05), C-705 (41.00% & 4.10) and BG-30-35 (41.00% & 4.10) under control, BBG-2 (45.00% & 4.50), NBeG 47-1 (46.00% & 4.60) and PBC-161 (48.00% & 4.80) and JG-16 (52.00% & 5.20) under moisture stress at -0.4 Mpa PEG and BBG-2 (48.00% & 4.80), JG-34 (50.00% & 5.00), NBeG 47-1 (52.00% & 5.20) and PBC-161 (53.00% & 5.30) under moisture stress at -0.6 Mpa PEG maintained minimum germination index and coefficient of germination velocity, respectively. On the basis of this parameter, BBG-2, PBC-161 and NBeG 47-1 were found better for moisture stress condition.
On the basis of germination percentage, promptness index and other stress parameters under moisture stress imposed by PEG-6000, the promising genotypes were NBeG 47-1, 161and BBG-2. However, the genotypes, GJG-1010 and PBC-161 on the basis of seedling length and NBeG 47-1 and PBC-PBC-161 on the basis of dry matter of seedling were found to be better for moisture stress. The genotypes, BBG-2, PBC-161 and NBeG 47-1 maintained higher vigour index. Therefore, the genotypes, NBeG 47-1, BBG-2 and PBC-161 for germination, GJG-1010 and PBC-161 for seedling growth and NBeG 47-1 and PBC-161 for higher dry matter production can be considered as moisture stress tolerant genotypes.
REFERENCES
[1] Abdul-Baki AA, Anderson JD (1970) Viability and leaching of sugars from germinating barley. Crop Science 10: 31-34.
[2] Almudaris M A (1998) Notes on various parameters recording the speed of seed germination. Der Tropenlandwirt 99: 147-154.
[3] Ashraf MY, Naqvi SSM (1995) Studies on water uptake, germination and seedling growth of wheat genotypes under PEG-6000 induce water stress. Pakistan Journal of Scientific and Industrial Research 38: 103-133. [4] Ashraf MY, Khan AH, Azmi AR (1992) Cell membrane stability and its
relation with some physiological processes in wheat. Acta Agronomica Hungarica 41: 183-191.
[5] Blum A, Sinmena B, Ziv O (1980) An evaluation of seed and seedling drought tolerance screening tests in wheat. Euphytica 29: 727-736. [6] Bouslama M, Schapaugh WT Jr (1984) Stress tolerance in soybeans. I.
Evaluation of three Screening techniques for heat and drought tolerance. Crop Science 24: 933-937.
[7] Boyer JS (1982) Plant productivity and environment. Science 218: 443-448. [8] Bruckner PL, Frohberg RC (1987) Stress tolerance and adaptation in spring
wheat. Crop Science 27: 31-36.
[9] Dedio (1975) Water relations in wheat leaves as screening test for drought resistance. Canadian Journal of Plant Sciences 55: 369-378.
[10] El-Far IA, Allan AY (1995) Responses of some wheat cultivars to sowing methods and drought at different stages of growth. Assuit Journal of Agricultural Sciences 26: 267–277.
[11] Ellis RA, Roberts EH (1981) The quantification of ageing and survival in orthodox seeds. Seed Science Technology 9: 373-409.
[12] Fernandez GCJ (1992) Effective selection criteria for assessing plant stress tolerance. In: Proceedings of on the Symposium Taiwan, August 13-18, 25: 257-270.
[13] Ibrahim MJ, Akhtar M, Younis M A, Riaz M, Anwarul-Haq, Tahir M (2007) Selection of cotton (Gossypium hirsutum L.) genotypes against NaCl stress. Soil and Environment 26(1): 59-63.
[14] Kader MA, Jutzi SC (2004) Effects of thermal and salt treatments during imbibition on germination and seedling growth of Sorghum at 42/19°C. Journal of Agronomy and Crop Science 190: 35-38.
[15] Ludlow MM, Fisher MJ, Wilson JR (1985) Stomatal adjustment to water deficits in three tropical grasses and a tropical legume in controlled conditions and in the field. Journal of Plant Physiology 12: 131-149. [16] Panse VG, Sukhatme PV (1985) Statistical Methods for Agricultural
Workers. ICAR Rev. Ed. By Sukhatme PV, Amble VN, pp. 145-156. [17] Richards RA (1978) Variation between and within species of rapeseed
(Brassica campestris and B.napus) in response to drought stress. III. Physiological and physicochemical characters. Australian Journal of Agricultural Research 29: 491-501.
[18] Sammar Raza MA, Saleem MF, Khan IH, Jamil M, Ijaz M, Khan M.A (2012) Evaluating the drought stress tolerance efficiency of wheat (triticum aestivum L.) cultivars. Russian Journal of Agricultural and Socio-Economic Sciences, No. 12 (12): 41-46.
[19] Zafar-ul-Hye M, Zahir ZA, Shahzad SM, Irshad U, Arshad M (2007) Isolation and screening of rhizobia for improving growth and nodulation of lentil (Lens culinaris Medic) seedlings under axenic conditions. Soil and Environment 26(1): 81-91, 2007.
AUTHORS
First Author – V. M. Dharanguttikar, Department of Botany, Mahatma Phule Krishi Vidyapeeth, Rahuri-413 722, Dist.: Ahmednagar (M.S.), India
Second Author – R. W. Bharud, Department of Botany, Mahatma Phule Krishi Vidyapeeth, Rahuri-413 722, Dist.: Ahmednagar (M.S.), India
ISSN 2250-3153
www.ijsrp.org
Sr. No.
Genotype Controlled -0.4 Mpa PEG -0.6 Mpa PEG
4th day 6th day 8th day 4th day 6th day 8th day 4th Day
6th day
8th Day
1 GCP-101 85.00 15.00 0.00 45.00 30.00 25.00 35.00 40.00 25.00
2 JG-16 80.00 15.00 5.00 60.00 20.00 20.00 40.00 20.00 40.00
3 JG-29 75.00 25.00 0.00 30.00 25.00 45.00 25.00 20.00 55.00
4 NBeG-165 100 0.00 0.00 30.00 25.00 45.00 15.00 35.00 50.00
5 GJG-1010 85.00 10.00 5.00 25.00 35.00 40.00 0.00 40.00 60.00
6 HIR-55 75.00 20.00 5.00 35.00 25.00 40.00 20.00 30.00 50.00
7 CSJ-563 75.00 20.00 5.00 20.00 30.00 50.00 5.00 20.00 75.00
8 NDG-11-12 70.00 15.00 15.00 25.00 30.00 45.00 20.00 25.00 55.00
9 BBG-2 97.50 2.50 0.00 80.00 15.00 5.00 70.00 20.00 10.00
10 RKG-201-95 85.00 10.00 5.00 35.00 45.00 20.00 20.00 30.00 50.00
11 CSJ-724 85.00 10.00 5.00 25.00 50.00 25.00 15.00 30.00 55.00
12 GJG-1001 90.00 10.00 0.00 40.00 40.00 20.00 40.00 25.00 35.00
13 Phule G-0204-16 75.00 25.00 0.00 60.00 10.00 30.00 35.00 20.00 45.00 14 Phule G-0752 80.00 20.00 0.00 25.00 45.00 30.00 10.00 35.00 55.00
15 PBC-136 85.00 15.00 0.00 25.00 40.00 35.00 5.00 40.00 55.00
16 C-705 95.00 5.00 0.00 30.00 25.00 45.00 15.00 35.00 50.00
17 JG-34 60.00 40.00 0.00 35.00 35.00 30.00 5.00 20.00 45.00
18 BG-30-35 95.00 5.00 0.00 35.00 30.00 35.00 20.00 35.00 45.00
19 CSJ-739 85.00 15.00 0.00 45.00 40.00 15.00 35.00 35.00 30.00
20 IPC-2008-76 90.00 10.00 0.00 40.00 35.00 25.00 10.00 25.00 65.00
21 H-09-54 80.00 20.00 0.00 25.00 25.00 50.00 25.00 20.00 55.00
22 RKG-11-301 70.00 15.00 15.0 35.00 40.00 25.00 25.00 40.00 25.00
23 BDNG-2003-1 85.00 10.00 5.00 35.00 50.00 15.00 30.00 25.00 45.00
24 PBC-161 70.00 30.00 0.00 70.00 20.00 10.00 55.00 25.00 20.00
25 GJG-10-12 80.00 15.00 5.00 35.00 20.00 45.00 10.00 40.00 50.00
26 NBeG 47-1 80.00 10.00 10.00 75.00 20.00 5.00 50.00 40.00 10.00
27 Phule G-0305-3 80.00 10.00 10.00 35.00 30.00 35.00 10.00 20.00 70.00
28 Digvijay 75.00 25.00 0.00 35.00 30.00 35.00 15.00 40.00 45.00
29 Vishal 70.00 30.00 0.00 30.00 20.00 50.00 10.00 30.00 60.00
30 Vijay 80.00 20.00 0.00 50.00 30.00 20.00 40.00 40.00 20.00
Mean 81.25 15.7 3.00 39.00 30.50 30.50 23.67 30.00 45.00
SE ± 6.48 6.44 2.92 6.66 6.49 5.77 6.02 5.07 5.86
[image:5.612.13.605.52.490.2]CD 18.75 18.6 8.44 19.27 18.76 16.70 17.40 14.68 16.96
ISSN 2250-3153 S N
Genotypes Promptness index (%) SI SSI GSI
0.0 Mpa
-0.4 Mpa
-0.6 Mpa
-0.4 Mpa
-0.6 Mpa
-0.4 Mpa
-0.6 Mpa
-0.4 Mpa
-0.6 Mpa 1 GCP-101 71.25 55.00 52.50 0.23 0.25 0.90 0.68 77.16 73.65
2 JG-16 68.75 38.75 50.00 0.44 0.26 1.73 0.71 55.89 72.62
3 JG-29 68.75 48.75 42.50 0.29 0.38 1.14 1.04 70.91 61.82
4 NBeG-165 75.00 45.00 41.25 0.40 0.45 1.57 1.22 60.00 55.00
5 GJG-1010 70.00 53.75 35.00 0.23 0.5 0.91 1.36 76.79 50.00
6 HIR-55 67.50 52.50 42.50 0.22 0.41 0.87 1.13 77.93 63.31
7 CSJ-563 67.50 42.50 32.50 0.37 0.5 1.46 1.36 62.77 48.35
8 NDG-11-12 63.75 45.00 41.25 0.29 0.31 1.15 0.85 70.60 64.58
9 BBG-2 74.37 68.75 65.00 0.08 0.12 0.30 0.34 92.43 87.40
10 RKG-201-95 70.00 53.75 42.50 0.23 0.37 0.91 1.01 76.82 60.66
11 CSJ-724 70.00 50.00 40.00 0.28 0.41 1.12 1.11 71.52 57.22
12 GJG-1001 72.50 55.00 51.25 0.24 0.29 0.95 0.80 75.86 70.69
13 Phule G-0204-16 68.75 57.50 47.50 0.16 0.3 0.64 0.81 83.60 69.05
14 Phule G-0752 70.00 48.75 38.75 0.30 0.45 1.19 1.21 69.64 55.36
15 PBC-136 71.25 47.50 37.50 0.33 0.44 1.29 1.21 67.04 52.59
16 C-705 73.75 46.25 41.25 0.37 0.43 1.46 1.17 62.73 55.95
17 JG-34 65.00 51.25 25.00 0.21 0.62 0.83 1.67 78.85 38.46
18 BG-30-35 73.75 50.00 43.75 0.32 0.38 1.26 1.02 67.80 59.39
19 CSJ-739 71.25 57.50 51.25 0.19 0.29 0.76 0.80 80.73 71.98
20 IPC-2008-76 72.50 53.75 36.25 0.26 0.5 1.01 1.36 74.14 50.00
21 H-09-54 70.00 43.75 42.50 0.38 0.39 1.47 1.07 62.50 60.71
22 RKG-11-301 63.75 52.50 45.00 0.18 0.31 0.69 0.84 82.46 70.77
23 BDNG-2003-1 70.00 55.00 46.25 0.21 0.36 0.83 0.99 78.80 66.35
24 PBC-161 67.50 65.00 58.75 0.04 0.13 0.15 0.35 96.30 87.04
25 GJG-10-12 68.75 47.50 40.00 0.31 0.41 1.21 1.11 69.05 58.13
26 NBeG 47-1 67.50 67.50 60.00 0.00 0.11 0.00 0.30 100 88.89
27 Phule G-0305-3 67.50 50.00 35.00 0.26 0.48 1.02 1.31 74.07 51.85
28 Digvijay 68.75 50.00 42.50 0.27 0.37 1.07 1.01 72.82 61.77
29 Vishal 67.50 45.00 37.50 0.33 0.44 1.31 1.21 66.67 55.56
30 Vijay 70.00 57.50 55.00 0.18 0.21 0.70 0.58 82.14 78.57
Mean 69.56 51.83 44.00 0.25 0.36 1.00 0.99 74.60 63.26
SE+ 1.82 4.15 2.69 0.07 0.05 0.26 0.14 6.16 4.24
[image:6.612.72.540.68.645.2]CD@5% 5.26 12.00 7.77 0.19 0.14 0.75 0.39 17.81 12.27
Table 2. Promptness index (Pi) and germination stress indices influenced by chickpea genotypes under moisture stress induced by PEG-6000
ISSN 2250-3153
www.ijsrp.org
SN Genotypes Seedling length (cm) SI SSI SLSI
0
Mpa -0.4 Mpa -0.6 Mpa
-0.4 Mpa
-0.6 Mpa
-0.4 Mpa
-0.6
Mpa -0.4 Mpa -0.6 Mpa
1 GCP-101 19.80 6.00 4.05 0.70 0.79 1.11 1.08 30.5 20.6
2 JG-16 21.30 6.60 5.25 0.69 0.75 1.11 1.02 30.9 24.7
3 JG-29 17.80 6.00 4.90 0.72 0.72 1.15 0.98 28.3 27.8
4 NBeG-165 21.40 7.90 6.15 0.55 0.71 0.88 0.97 44.8 28.8
5 GJG-1010 11.70 8.20 4.05 0.30 0.65 0.47 0.88 70.4 35.2
6 HIR-55 16.80 8.50 5.35 0.49 0.68 0.79 0.92 50.6 32.4
7 CSJ-563 20.10 6.95 3.75 0.65 0.81 1.04 1.10 34.8 18.8
8 NDG-11-12 17.20 5.85 4.60 0.66 0.73 1.05 0.99 34.5 27.1
9 BBG-2 22.30 9.50 6.40 0.57 0.71 0.91 0.97 43.1 28.5
10 RKG-201-95 26.50 4.95 3.90 0.81 0.85 1.30 1.16 18.7 14.8
11 CSJ-724 19.60 8.25 5.02 0.58 0.74 0.93 1.01 42.1 25.7
12 GJG-1001 17.50 8.20 5.30 0.53 0.70 0.85 0.95 46.7 30.5
13 Phule G-0204-16 17.90 7.80 5.65 0.56 0.69 0.90 0.93 43.8 31.5
14 Phule G-0752 23.70 6.65 5.65 0.72 0.76 1.15 1.03 28.2 24.2
15 PBC-136 20.10 8.30 6.95 0.58 0.65 0.93 0.89 41.6 34.6
16 C-705 20.20 8.65 5.70 0.57 0.72 0.91 0.98 42.9 28.2
17 JG-34 26.80 8.85 7.35 0.67 0.73 1.07 0.99 33.1 27.4
18 BG-30-35 25.30 7.85 6.98 0.69 0.72 1.10 0.98 31.1 27.6
19 CSJ-739 21.80 8.40 5.90 0.61 0.73 0.98 0.99 38.6 27.1
20 IPC-2008-76 22.60 8.30 5.65 0.63 0.75 1.01 1.02 36.8 25.0
21 H-09-54 20.50 6.50 3.30 0.68 0.84 1.09 1.14 31.7 16.1
22 RKG-11-301 18.40 7.55 6.10 0.59 0.67 0.94 0.91 41.4 33.3
23 BDNG-2003-1 20.90 7.75 5.88 0.63 0.72 1.01 0.98 37.1 28.1
24 PBC-161 15.20 7.50 6.00 0.51 0.61 0.81 0.83 49.3 39.1
25 GJG-10-12 18.90 7.10 3.75 0.62 0.80 0.99 1.09 38.0 19.8
26 NBeG 47-1 23.30 12.03 8.00 0.48 0.66 0.78 0.89 51.6 34.3
27 Phule G-0305-3 24.20 7.35 5.85 0.70 0.76 1.11 1.03 30.4 24.3
28 Digvijay 18.90 7.20 5.45 0.62 0.71 1.00 0.96 38.0 29.1
29 Vishal 18.20 7.10 3.80 0.61 0.79 0.98 1.08 39.0 20.9
30 Vijay 24.20 8.45 5.65 0.65 0.77 1.05 1.04 34.9 23.3
Mean 20.44 7.67 5.41 0.61 0.73 0.98 0.99 38.8 27.0
SE+ 0.97 0.72 0.66 0.04 0.04 0.07 0.05 4.45 4.03
[image:7.612.23.595.78.640.2]CD@5% 2.80 2.07 1.91 0.13 0.12 0.21 0.16 12.84 11.64
Table 3. Seedling length and stress indices influenced by chickpea genotypes under moisture stress induced by PEG-6000
ISSN 2250-3153 S N
Genotypes Seedling dry weight SI SSI DMSI
0.0 Mpa
-0.4 Mpa
-0.6 Mpa
-0.4 Mpa
-0.6 Mpa
-0.4 Mpa
-0.6 Mpa
-0.4 Mpa
-0.6 Mpa 1 GCP-101 1.54 0.79 0.62 0.49 0.60 1.41 1.25 51.0 39.9
2 JG-16 1.63 0.82 0.74 0.50 0.55 1.43 1.14 50.3 45.1
3 JG-29 1.44 0.75 0.71 0.48 0.51 1.38 1.05 52.1 49.3
4 NBeG-165 1.63 1.10 1.01 0.32 0.38 0.93 0.79 67.5 61.9
5 GJG-1010 1.32 1.11 0.64 0.16 0.52 0.46 1.07 84.1 48.5
6 HIR-55 1.41 1.21 0.77 0.14 0.45 0.40 0.94 86.0 54.8
7 CSJ-563 1.60 0.85 0.54 0.47 0.66 1.35 1.38 53.1 33.8
8 NDG-11-12 1.41 0.74 0.66 0.47 0.53 1.36 1.10 52.7 47.0
9 BBG-2 1.68 1.52 1.07 0.10 0.36 0.27 0.76 90.4 63.6
10 RKG-201-95 1.77 0.65 0.62 0.63 0.65 1.82 1.36 36.7 34.7
11 CSJ-724 1.57 1.12 0.72 0.28 0.54 0.82 1.12 71.6 46.0
12 GJG-1001 1.44 1.11 0.77 0.23 0.46 0.66 0.96 77.0 53.7
13 Phule G-0204-16 1.44 1.06 0.87 0.26 0.39 0.75 0.82 73.8 60.7
14 Phule G-0752 1.71 0.85 0.87 0.50 0.49 1.44 1.02 49.9 51.1
15 PBC-136 1.60 1.15 1.09 0.28 0.32 0.81 0.67 71.9 67.8
16 C-705 1.61 1.06 0.90 0.34 0.44 0.98 0.92 65.8 55.8
17 JG-34 1.71 1.32 1.15 0.23 0.33 0.66 0.68 77.1 67.4
18 BG-30-35 1.75 1.32 1.11 0.24 0.37 0.70 0.76 75.6 63.3
19 CSJ-739 1.68 1.16 0.92 0.31 0.45 0.89 0.94 68.9 54.6
20 IPC-2008-76 1.70 1.13 0.85 0.34 0.50 0.96 1.05 66.5 49.7
21 H-09-54 1.67 0.80 0.40 0.52 0.76 1.50 1.58 47.9 23.9
22 RKG-11-301 1.48 1.00 0.99 0.33 0.33 0.94 0.69 67.2 66.6
23 BDNG-2003-1 1.62 1.05 0.91 0.35 0.44 1.01 0.91 65.0 56.4
24 PBC-161 1.36 0.97 0.95 0.29 0.30 0.83 0.63 70.9 69.5
25 GJG-10-12 1.54 0.87 0.59 0.43 0.62 1.24 1.28 56.7 38.4
26 NBeG 47-1 1.77 1.70 1.18 0.04 0.33 0.12 0.69 95.8 66.7
27 Phule G-0305-3 1.73 0.90 0.91 0.48 0.47 1.38 0.98 51.9 52.8
28 Digvijay 1.51 0.89 0.80 0.41 0.47 1.18 0.97 59.0 53.0
29 Vishal 1.44 0.87 0.61 0.40 0.58 1.14 1.21 60.4 42.4
30 Vijay 1.74 1.19 0.82 0.32 0.53 0.91 1.10 68.4 47.1
Mean 1.58 1.03 0.82 0.34 0.48 0.99 0.99 65.6 52.3
SE+ 0.02 0.02 0.02 0.01 0.01 0.04 0.03 1.50 1.61
[image:8.612.84.533.70.647.2]CD@5% 0.06 0.07 0.06 0.04 0.04 0.12 0.09 4.34 4.65
Table 4. Seedling dry matter (g) and stress indices influenced by chickpea genotypes under moisture stress induced by PEG-6000
ISSN 2250-3153
[image:9.612.36.582.69.496.2]www.ijsrp.org
Table 5. Germination rate index (GRI) and mean germination time (MGT) influenced by chickpea genotypes under moisture stress induced by PEG-6000.
Sr. No
Genotype Germination rate index (GRI) Mean germination time (MGT)
Control -0.4 Mpa -0.6 Mpa Control -0.4 Mpa -0.6 Mpa
1 GCP-101 23.75 19.38 18.54 2.4 1.9 1.9
2 JG-16 23.13 20.83 18.33 2.3 2.1 1.8
3 JG-29 22.42 17.29 16.46 2.2 1.7 1.6
4 NBeG-165 25.00 17.29 15.83 2.5 1.7 1.6
5 GJG-1010 23.54 17.08 14.17 2.4 1.7 1.4
6 HIR-55 22.71 17.92 16.25 2.3 1.8 1.6
7 CSJ-563 22.71 16.25 13.96 2.3 1.6 1.4
8 NDG-11-12 21.88 16.88 16.04 2.2 1.7 1.6
9 BBG-2 24.79 23.13 22.08 2.5 2.3 2.2
10 RKG-201-95 23.54 18.75 16.25 2.4 1.9 1.6
11 CSJ-724 23.54 17.71 15.63 2.4 1.8 1.6
12 GJG-1001 24.17 19.17 18.54 2.4 1.9 1.9
13 Phule G-0204-16 22.92 20.42 17.71 2.3 2.0 1.8
14 Phule G-0752 23.33 17.50 15.21 2.3 1.8 1.5
15 PBC-136 23.75 17.29 14.79 2.4 1.7 1.5
16 C-705 24.58 17.29 15.83 2.5 1.7 1.6
17 JG-34 21.67 18.33 10.21 2.2 1.8 1.0
18 BG-30-35 24.58 18.13 16.46 2.5 1.8 1.6
19 CSJ-739 23.75 19.79 18.33 2.4 2.0 1.8
20 IPC-2008-76 24.17 18.96 14.79 2.4 1.9 1.5
21 H-09-54 23.33 16.67 16.46 2.3 1.7 1.6
22 RKG-11-301 21.88 18.54 16.04 2.2 1.9 1.6
23 BDNG-2003-1 23.54 18.96 17.29 2.4 1.9 1.7
24 PBC-161 22.50 22.08 20.42 2.3 2.2 2.0
25 GJG-10-12 23.13 17.71 15.42 2.3 1.8 1.5
26 NBeG 47-1 22.92 22.71 20.42 2.3 2.3 2.0
27 Phule G-0305-3 22.92 18.13 14.58 2.3 1.8 1.5
28 Digvijay 22.92 18.13 16.04 2.3 1.8 1.6
29 Vishal 22.5 17.08 15.00 2.3 1.7 1.5
30 Vijay 23.33 20.00 19.17 2.3 2.0 1.9
Mean 23.30 18.65 16.54 2.33 1.86 1.65
SE+ 0.56 0.85 0.83 0.06 0.09 0.08
ISSN 2250-3153
Table 6. Germination index (GI) and coefficient of germination velocity (CVg) influenced by chickpea genotypes under moisture stress induced by PEG-6000.
Sr. No.
Genotype Germination index (GI) Coefficient of germination velocity (CVg) Control -0.4 Mpa -0.6 Mpa Control -0.4 Mpa -0.6 Mpa
1 GCP-101 43.00 56.00 58.00 4.30 5.60 5.80
2 JG-16 45.00 52.00 60.00 4.50 5.20 6.00
3 JG-29 45.00 63.00 66.00 4.50 6.30 6.60
4 NBeG-165 40.00 63.00 67.00 4.00 6.30 6.70
5 GJG-1010 44.00 63.00 72.00 4.40 6.30 7.20
6 HIR-55 46.00 61.00 66.00 4.60 6.10 6.60
7 CSJ-563 46.00 66.00 74.00 4.60 6.60 7.40
8 NDG-11-12 49.00 64.00 67.00 4.90 6.40 6.70
9 BBG-2 40.50 45.00 48.00 4.05 4.50 4.80
10 RKG-201-95 44.00 57.00 66.00 4.40 5.70 6.60
11 CSJ-724 44.00 60.00 68.00 4.40 6.00 6.80
12 GJG-1001 42.00 56.00 59.00 4.20 5.60 5.90
13 Phule G-0204-16 45.00 54.00 62.00 4.50 5.40 6.20
14 Phule G-0752 44.00 61.00 69.00 4.40 6.10 6.90
15 PBC-136 43.00 62.00 70.00 4.30 6.20 7.00
16 C-705 41.00 63.00 67.00 4.10 6.30 6.70
17 JG-34 48.00 59.00 50.00 4.80 5.90 5.00
18 BG-30-35 41.00 60.00 65.00 4.10 6.00 6.50
19 CSJ-739 43.00 54.00 59.00 4.30 5.40 5.90
20 IPC-2008-76 42.00 57.00 71.00 4.20 5.70 7.10
21 H-09-54 44.00 65.00 66.00 4.40 6.50 6.60
22 RKG-11-301 49.00 58.00 54.00 4.90 5.80 5.40
23 BDNG-2003-1 44.00 56.00 63.00 4.40 5.60 6.30
24 PBC-161 46.00 48.00 53.00 4.60 4.80 5.30
25 GJG-10-12 45.00 62.00 68.00 4.50 6.20 6.80
26 NBeG 47-1 46.00 46.00 52.00 4.60 4.60 5.20
27 Phule G -0305-3 46.00 60.00 72.00 4.60 6.00 7.20
28 Digvijay 45.00 60.00 66.00 4.50 6.00 6.60
29 Vishal 46.00 64.00 70.00 4.60 6.40 7.00
30 Vijay 44.00 54.00 56.00 4.40 5.40 5.60
Mean 44.35 58.30 63.47 4.44 5.83 6.35
SE+ 1.46 2.59 2.73 0.16 0.26 0.27
ISSN 2250-3153