AUG-SEPT, 2015, VOL. 2/11 www.srjis.com Page 2750 MAPPING THE LEVEL OF COMMUNICATION COMPETENCE AND
PERFORMANCE OF COLLEGE STUDENTS OF PONDICHERRY
G. Swaminathan *& T.Parasuraman
Pondicherry Institute of Linguistics and Culture (PILC), Pondicherry
This paper describes the level of prevalence of communication competence and performance, which is one of the important employability skills, among the graduates of Puducherry Union Territory (earlier known as Pondicherry). A survey conducted among the college students of Pondicherry has revealed that only less than 2 % of the sample possessed acceptable levels of communication competence and performance. The outcome of the research points out the prevalence of the ‘communication skills gap’ placing the youth of Puducherry at a disadvantaged position to obtain, sustain and climb up the professional ladder in the competitive global employment market. Possible cause of this scenario is analyzed and viable solutions to tackle the issues are proposed.
Key terms: Employability skills, Skills gap, Communication competence, Communication
performance.
Introduction
In last four decades, globally the scenario in the employment sector has undergone a radical change in several facets including organizational philosophy from Fordism of initial industrialization era which was characterized by scientific management techniques, hierarchical structure, inflexible processes, specialization and mass production to ‘Post Fordism’1 which
AUG-SEPT, 2015, VOL. 2/11 www.srjis.com Page 2751 places an emphasis on flexibility, decentralization, team work, horizontal structure, and Information, Communication and Technology ( ICT ) utilization etc.; and the ‘Globalization’ in work culture. This has created ample employment opportunity which transcends the physical boundaries of Nations and Continents. Consequently, prospective employers are required to possess a ‘Global mindset’ characterized by set of skills described as ‘Employability skills’ which include several behavioral skills in addition to job specific knowledge and skills. Communication skills have been identified as one of the important employability skills in Employability skills framework developed by several nations irrespective of the job profile and level of the profession2.‘Skills gap’ is one of the major issues in global employment scenario causing far -reaching consequences in terms of economy and development both for the organizations and countries including developed nations3. Several nations have carried out systematic investigations to map different aspects of skills gap, and have devised and implemented appropriate measures to bridge the gap so that their youth are successful in global competitive employment market4.
India has the third largest higher education system in world producing human capital in diverse disciplines like engineering, medicine, management, science and humanities etc.; and the global employers look up on Indian youth for their skilled man power demand. India Skills report 20145 presents the findings of the systematic investigations on the requirement and available human potential in India which can be used for planning human capital for the future.
Puducherry Union territory occupies a prominent position in several sectors of career opportunity map of India projected in India skills report5. This status of Puducherry can be attributed to the large number of educational institutions situated in Puducherry offering higher education opportunity to the youth of Puducherry as well as to students from all over India; thanks to Pondicherry Central University and other private universities in Puducherry.
AUG-SEPT, 2015, VOL. 2/11 www.srjis.com Page 2752 employment market is required to possess proficiency in the language most commonly used internationally and competencies for effective communication6. English language has emerged as one of the most commonly used language in employment sector. Although, the term communication competence has been defined by several researchers7, in the present research it is being used to refer to the behavioral attributes that contribute for effective listening and speaking, two important aspects of oral communication.
Research methodology
Data for the research was collected by conducting a survey among the random stratified sample among the student population of Puducherry using a survey questionnaire. The survey tool used contained items to measure all four components of communication viz; writing, reading, listening and speaking. The reading and writing components of communication in English language was measured by measuring the performance of the sample by using appropriate items, and components of listening and speaking were measured by measuring behavioral competencies for listening and speaking by using self disclosure type statements which included statements reflecting the behavior that would influence either positively or negatively the effective listening and speaking of the respondents8, and the respondents were required to choose their likely behavior on a five point scale. Although the measurement of performance in writing component was qualitative in nature, numerical values were assigned for the responses based on the criteria developed for assessment of the performance and competence. The data was analyzed by performing independent t-test to find out if there is any relationship between performance and competence and variables like gender, demography and medium of instruction up to higher secondary level. Correlation analysis was performed to find out if there is any relationship between competence and performance. Statistical package ANOVA was used to perform statistical analysis.
Results and Discussion
AUG-SEPT, 2015, VOL. 2/11 www.srjis.com Page 2753 Table 1 Estimation of Population of study
College type No. of
colleges
Intake per annum Duration of
the
programme (in years)
Total strength
Engineering 09 5269 4 21076
Arts and
Science
11 4353 3 13059
Education 20 2420 1 2420
Paramedical 09 916 4 3664
Medical 06 1022 5 5110
Pondicherry
University 01 3000 2 / 5 * 6000
Total 51329
(* University offers two years M.A. & M.Sc. programmes and Integrated M.A. and M.Sc. programmes of five years duration which is analogous to B.A.;M.A / B.Sc,; M.Sc.; programmes in addition to research programmes)
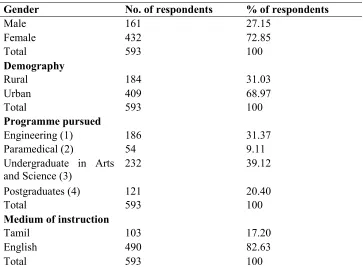
Sample profile is presented in Table 2.
Table 2 Sample Profile
Gender No. of respondents % of respondents
Male 161 27.15
Female 432 72.85
Total 593 100
Demography
Rural 184 31.03
Urban 409 68.97
Total 593 100
Programme pursued
Engineering (1) 186 31.37
Paramedical (2) 54 9.11
Undergraduate in Arts and Science (3)
232 39.12
Postgraduates (4) 121 20.40
Total 593 100
Medium of instruction
Tamil 103 17.20
English 490 82.63
Total 593 100
Criteria adopted for assigning numerical value for the responses on performance and competence is presented in Box 1
AUG-SEPT, 2015, VOL. 2/11 www.srjis.com Page 2754 Box 1 Scheme of assigning numerical value to responses
Scheme for assigning numerical value to responses in writing performance
1. A numerical value of 5 points was assigned to each meaningful sentence with correct usage of grammar and vocabulary.
2. A meaningful sentence but with a grammar mistakes was assigned a value of 3 points
3. An incomplete sentence which does not convey any meaning will be assigned a value of 1 point. 4. A response in one word was assigned a value of zero;
The range of scores in writing performance would be from 0 to 50.
Scheme for assigning numerical value to responses in reading performance
The performance in reading comprehension was also assigned numerical value of 5 point for each correct response and zero for wrong response and the range of scores for this section would be from 0 to 50 and the range of scores for overall performance would be from 0 to 100, and it was assumed that a score of 80 and above is good performance and others are moderate and poor performance.
The numerical value assigned to responses of the items used to measure competencies in listening and speaking is given in table 2. The range of scores for each competency would be
-25 to 25; and overall competency scores would be -50 to 50. The range of scores and frequencies of scores are given in tables 3 to 5.
Scheme of evaluation of competencies
Response Positive statement Negative statement
Always 5 -5
Often 4 -4
Sometimes 3 -3
Rarely 2 -2
Never 0 0
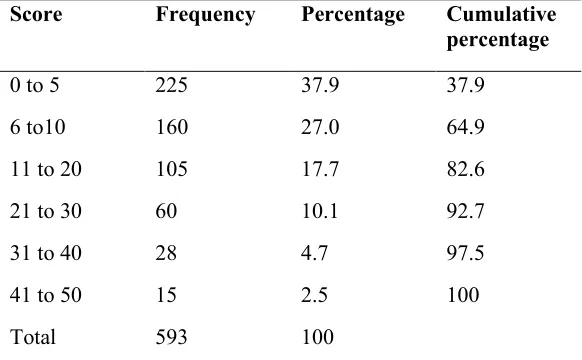
AUG-SEPT, 2015, VOL. 2/11 www.srjis.com Page 2755 Table 3 Scores distribution of writing performance
Score Frequency Percentage Cumulative
percentage
0 to 5 225 37.9 37.9
6 to10 160 27.0 64.9
11 to 20 105 17.7 82.6
21 to 30 60 10.1 92.7
31 to 40 28 4.7 97.5
41 to 50 15 2.5 100
Total 593 100
Table 4 Scores distribution of reading performance Score Frequency Percent Cumulative percent
0-5 51 8.6 8.6
6-10 18 3.0 11.6
11-20 114 19.2 30.9
21-30 175 29.5 60.4
31-40 157 26.5 86.8
41-50 78 13.2 100.0
[image:6.612.179.437.421.608.2]Total 593 100.0
Table 5 Scores distribution of overall performance Score Frequency Percent Cumulative percent
0-5 34 5.7 5.7
6-10 12 2.0 7.8
11-20 42 7.1 14.8
21-30 93 15.7 30.5 31-40 133 22.4 53.0 41-50 126 21.2 74.2 51-60 82 13.8 88.0
61-70 45 7.6 95.6
71-80 16 2.7 98.3
81-90 8 1.3 99.7
91-100 2 .3 100.0
AUG-SEPT, 2015, VOL. 2/11 www.srjis.com Page 2756 Fig.1 Percentage of frequency overall performance scores
The frequencies of likely behavior of respondents for items used to measure competencies are given in Table 6 and percentage of frequencies is given in Fig.2.
[image:7.612.186.432.315.444.2]Table 6 Percentage of frequencies of likely behavior for listening and speaking competencies Fig.2 Percentage of frequencies of likely behavior of listening and speaking competencies
Result of statistical analysis of the data is presented in table 7.
AUG-SEPT, 2015, VOL. 2/11 www.srjis.com Page 2757 Table 7 Results of independent sample t-test
Communicative competence
Gender N Mean Std. Deviation
Male 161 6.26 9.168
Female 432 10.61 9.498
Variable t df Sig.
L+S -5.007 591 0.000
Locality N Mean Std. Deviation
Rural 184 7.87 9.877
Urban 409 10.13 9.399
Variable t df Sig.
L+S -2.669 591 0.008
Medium N Mean Std. Deviation
Tamil 102 6.50 8.585
English 491 10.04 9.694
Variable t df Sig.
L+S -3.418 591 0.001
Communicative performance
Gender N Mean Std. Deviation
Male 161 32.06 17.778
Female 432 41.91 18.123
Variable t df Sig.
R+W -5.920 591 0.000
Locality N Mean Std. Deviation
Rural 184 35.60 18.818
Urban 409 40.87 18.203
Variable t df Sig.
R+W -3.230 591 0.001
Medium N Mean Std. Deviation
Tamil 102 37.63 18.432
English 491 39.57 18.565
Variable t df Sig.
R+W -.963 591 0.336
AUG-SEPT, 2015, VOL. 2/11 www.srjis.com Page 2758 skills. Independent sample t-test analysis results indicated a significan difference in communicative competence between males and females; and medium of instruction up to higher secondary level, but no significant difference between rural and urban samples.
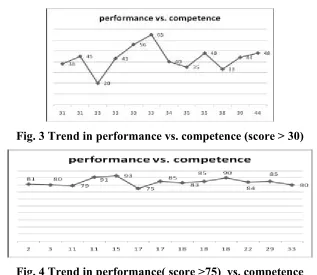
[image:9.612.146.463.250.525.2]It was assummed that there could be a correlation between communicative performance and communicative competence and performance. A correlation analysis between competence and performance indicated no relationship between the two. The trend in performance of respondents who scored above 30 in competence, and the trend in competence of respondents who scored above 75 in performance was plotted (Fig. (2) & (3)) which indicated no regular trend between the two.
Fig. 3 Trend in performance vs. competence (score > 30)
Fig. 4 Trend in performance( score >75) vs. competence
AUG-SEPT, 2015, VOL. 2/11 www.srjis.com Page 2759 subject specific knowledge and skills in academic institutions. But, academic institutions alone can not be held responsible for the observed situation but at the same time its role in imparting these skills can not be ignored. The existing evaluation system which heavily relies on memorization and its impact on teaching - learning process and attitude of learners need to be tuned to crate awareness among the students about the need for developing employability skills, and to provide opportunity to learn these skills in and outside of academic set up, which requires a collective cooperative efforts of policy makers, employers, academicians and the stake holders. The findings of the research is only a tip of the iceberg and needs elaborate investigations in depth and breadth across the nation on different aspects of employability skills to provide input for formulating strategies for addressing the issues and exploit the opportunity available in global employment market.
References
Maria Markantonatou. (2007) The ideal-typical transition from Fordism to post-Fordism: A neopositivist problem setting.European Research Studies, page. 119 -129
Jolee Young and Elaine Chapman. (2010) Generic Competency Frameworks: A Brief Historical Overview. Education Research and Perspectives, page.1 - 24
Bridging the skills gap- report (2012). American Society for Training & Development. ISBN-10: 1-56286-871-3
Employer Preferred Skillsets (2013). Office of Institutional Effectiveness, Hart Research Associates. Liberal Education, page. 22‐ 29.
Monika Aring, (2012). Youth and skills: Putting education to work Background; The India skills report (2014) .
James C. McCroskey, (1982). Communication competence and performance : a research and pedagogicalperspective Communication education, page102 -109.
Vesna Bagarić and Jelena Mihaljević Djigunović, (2007). Defining communicative competence; METODIKA page. 94-103.