Ground Water Potential Mapping in Dulung Watershed
using Remote Sensing & GIS techniques, West Bengal,
India
Mr. Kartic Bera
1, Dr. Jatisankar Bandyopadhyay
2*
Department of Remote Sensing & GIS, Vidyasagar University Paschim Medinipur, Midnapore-721102, West Bengal **
Assistant Professor, Department of Remote Sensing & GIS, Vidyasagar University Paschim Medinipur, Midnapore-721102, West Bengal
Abstract- Groundwater is one of the most valuable natural resources, which supports human civilization. The supply of groundwater is not unlimited and therefore its’ use should be properly planned based on the understanding of the groundwater systems behavior in order to ensure its sustainable use. Again a judicious use of groundwater, proper evaluation is required. A groundwater development and management program needs the analyses of a large volume of multidisciplinary data from various sources. Integrated use of remote Sensing and GIS can provide the appropriate platform for convergence of multidisciplinary data from various sources for appropriate planning. In the present study, an integrated remote Sensing and GIS based methodology is developed and tested for the evaluation of the groundwater resources of Dulung watershed, Paschim Medinipur District, West Bengal and a small part of the adjoining Jharkhand state. IRS 1D LISS-III satellite data of 4th February, 2008 along with other data sets, existing maps and field observation data have been utilized to extract information on the hydro geomorphic features of the study area. The ground water potential zones have been derived for the entire Dulangnala watershed and it has been divided into mainly four categories namely very low, low, medium and high recharge potential zone.
Index Terms- Ground water, Land use/Land cover, Multi-Spectral, Aquifer, Weightage, Reclassify
I. INTRODUCTION
round water refers to all waters stored beneath the surface of the Earth in aquifers. In order to use the water stored in an aquifer, it is necessary first to locate the aquifer, map its size, extent and depth, and then estimate recharge and discharge rates of water. The effects of additional extraction wells on the aquifer and its structural integrity must also be assessed (Dasgupta & Sikdar, 1992). Much of the information can only be confirmed by the use of well records, bore hole and other insitu sampling methods. However, the Remote Sensing and GIS are playing a rapidly increasing role in the field of hydrology and water resources development. Remote sensing provides multi-spectral, multi-temporal and multi-sensor data of the earth’s surface (Choudhury et.al 2003). One of the greatest advantages of using remote sensing data for hydrological investigations and monitoring is its ability to generate information in spatial and temporal domain, which is very crucial for successful analysis, prediction and validation (Sarma & Saraf, 2002). By the GIS
technology provides suitable alternatives for efficient management of large and complex databases. According to conserve to next generation people to consider going the present work is an attempt towards this direction. The study focuses on development of Remote Sensing and GIS based analysis and methodology in groundwater recharge studies in watershed (Gustafsson- 1993). In order to demonstrate the Role of remote sensing and GIS based methodology, the basin of watershed in Dulung river basin Paschim Medinipur district state of West Bengal (India) has been taken for analysis.
Fig: 01 Location Map
II. STUDY AREA
The Dulung watershed situated mainly in the West Bengal (Paschim Medinipur) and some part is situated in the Jharkhand state (Fig-1). In the West Bengal part it cover following blocks: Jamboni, Jhargram, Binpore-I, II, Gopiballvpore-II and Sankrail. Water shed is represented by survey of India topographical map number 73 J/10, 11,14,15,16, & 73 N/3, 4 and the imageries IRS-ID LISS- III i.e path/Row 107/56,107/57 & latitude longitude extant is 220 09' 47.48'' N to 220 34' 11.48’’ N and 860 39' 29.78’’ E to 870 5' 37.30’’ E. the total area of the river basin is about 1141.38 K.M.
Fig: 02
2.1Drainage: The main River of the Study area is Dulung. The river flows from north-west direction to the south-east direction. The source of water of this river is rainfall during monsoon and spring (scanty) during pre-monsoon. During the rainy season the river carries huge amount of water and in the dry season it carries low quantity of water. In this dry season many of its tributary converted into paleo-channels. The main triburary of this river are Ded Nala, Kopan Nala and Palpata Nala (Fig: 02). The tributaries originate form the Chotonagpur plateau and flow towards the south-east direction and join the Dulung river form the right side of the river. There are also many others tributaries, but these are very small in size.
2.2 Land use/Land cover: The Dulung watershed area was
extensively forested with seasoned trees in the recent past. The watershed region is also extensively drained by number of 1st order, 2nd order, 3rd order and 4th order streams form source to mouth. The remaining areas of newer alluvium tracts were potential for cultivation and settlement with available surface and groundwater resource. Thus as a whole the watershed is now modified with the alteration of land cover by expansion of settlements in different corner of the watershed. Almost 500 km2 areas of the basin are now still under forest tracts in different forms of dense forest (82.9 km2), mixed forest (125.40km2), and open land/blank forest (60.98 km2). Other areas of the watershed are mostly altered by extension cultivation land and settlements and different road ways and railway tracks (Fig: 03). On the basis of the alteration of land cover areas some urban centers have coming up on the margin of road ways and railway track of the Dulung watershed.
Fig: 03
2.3 Soil: The study area is endowed with the distribution of wide range of soils (Fig: 04). Soils in the eastern segment can be termed under the great group of the Taxonomic classification system as Paleustalfs and Haplaquents (Both popularly known as older alluvial soils). Bulk of the soils in the western segment can be regarded as Ochraquults, Rhodustults and Haplustults (Known as red and yellow soils). Plinthustults and plinthudults (laterits soils) plainthustults and plinthudults (laterite soils) occur in the central extending north-south. While there are scattered occurrence of Haplustalfs, Paleustalfs and Rhodustalfs (red sandy soil and red gravelly soils) throughout the study area in considerable proportions. The fertility status of the older alluvial soil of the east is a bit superior to the other soils.
Fig 4
[image:2.612.45.278.65.351.2] [image:2.612.357.571.549.730.2]2.4 Rainfall: In the cold weather months of November and December only a fraction of an inch falls monthly, such rain as there is being due to the northward movement of cyclonic storms from the south of the Bay of Bengal, form about the end of December, when the northerly trade wind has become established, cold season’s storms are caused by shallow depressions, which originate in the north-west of the Bay and move East. During their passage they cause general cloudy weather months, but after southerly winds have commenced, thunder storms are as frequent a feature as they are in January and February. At the end of January or the beginning of February, local sea breezes commence (Sinha, J. 2006). They increase in force and extend their influence further inland with the increasing temperature of the hot weather months. And with greater frequency as the season’s advances, period of atmospheric disturbance the most important feature of which is the occurrence of local hot weather usually called nor-wasters. These thunderstorms are generally accompanied by heavy showers, but the rainfall in March and April is only 2 inches a months. In May there is a rapid increase owing to occasional incursion of cyclonic storms, and the rain fall consequently rises to over 5 inches.
Fig: 05
2.5 Geology / Geomorphology: Generally 5 type of lithology can be identified in the study area. These are (Fig: 05)
a) Older Alluvium- found in E-EN high bank areas of the watershed.
b) Basement Crystalline Complex- This type of soil is located under the Binpur block.
c) Fluvial deltaic Sediment– Maximum area is covered by this type of soil. The main content is that lateritic, hard crust mottled clay sand shale slit.
d) Platform Margin Conglomerates- in the middle of the basin area this type of soil is found. The main content is the pebbles cobbles and boulders in coarse sand matrix.
Significant constituent lateritic gravel, cobbles and gneisses.
e) Younger Alluvium- this type of soil concentrated due to flood. Content of the soil is sand, sandy clay or clay.
Fig: 06
2.6 Slope Steepness: From the figure of virtual GIS slope steepness is clearly visible (Fig: 06).
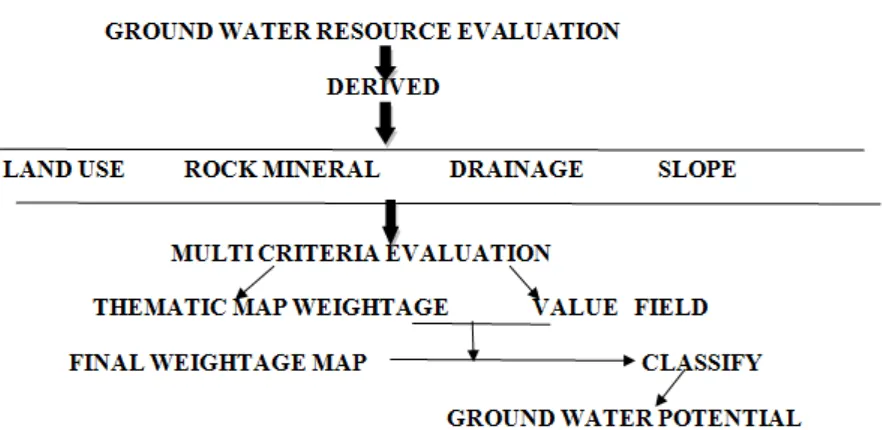
III. METHODOLOGY
Satellite data of IRS-1D LISS III (4th February 2002) Path Row 107/56, 107/57 & 108/56 geo-coded FCC of the study area were used. LISS III camera, one of the three sensors used in IRS-1D, provides multi-spectral data in four bands; two in visible (0.52 0.59 and 0.62– 0.68 mm), one in near infra red (NIR, 0.77– 0.86 mm) and one in short wave infra red (SWIR, 1.55–1.70 mm) regions of the electromagnetic spectrum. It has a spatial resolution of 23.5m in visible and NIR regions and 70.5m in SWIR regions. A path row- based full scene product covers an area of 1141.38 km2. To demarcate the groundwater potential-zones, the weightage of individual theme and future score ware fixed and added to the layer depending upon their suitability to hold ground water. A probability weightage approach has been applied during overlay analysis in Arc Map GIS environment. The maximum being to the lowest potential feature. Spatial analyst extension of Arc GIS 9.2 was used for converting the feature to raster and also for final analysis in this method the total weightage of the final map were derived as sum or product of the weightage assigned to the different layers according to their suitability.
GEOLOGY *15 + SLOPE*10 + DRAINAGE DENSITY*7 + GEOMORPHOLOGY*5 + SOIL*8 + LAND USE/COVER*5 (Table: 01)
IMAGIN 8.5 and map composed by Arc GIS 9.2 and Super Map 6.0. Then these coverage’s are projected. Attributes of the respected themes such as the type of Land use, Geology, Slope, Drainage Density and the field observation of a particular division have been added separately.
3.2 Data analysis : Land use changes for 1971 and 2004 were detected from the statistics and the change for different categories such as residential, commercial, institutional, industrial, open space, non-urban, agricultural, water body, and vacant are computed. Similarly the change for 1991 and 2004 were computed. From these two change detections long term as well as the short term variation in the land use is analyzed. Different thematic maps were prepared conventional survey (geology, drainage and contour maps) and remotely sensed data (hydro geomorphology, lineament map and land use). Figure the movement and storage of groundwater and each unit in every theme map was assigned a knowledge-based ranking depending on its significance to groundwater occurrence. In this terrain geomorphology plays a vital role for groundwater storage followed by slope, geology, lineament density, drainage density, land use. All the themes were overlaid in Arc/Info; two at a time and the resultant composite coverage was classified into four groundwater prospect categories such as (i) Very good (ii) Good (iii) Moderate and (iv) Poor.
IV. RESULTANDDISCUSSION
4.1 ASSESSMENT OF GROUND WATER
POTENTIAL ZONES: The ground water potential zones were
obtained by overlaying all the thematic maps in terms of weighted overlay methods using the spatial analysis tool in are G.I.S 9.2 during the weighted overlay analysis the ranking has been giving for such individual parameter of each thematic map and weighted were assigned according of the influence of the different parameters.
4.2 PREPARATION OF THE THEMATIC MAPS TO
OVERLAY IN DULANGNALA RIVER WATERSHED: The
following maps were scanned; georefrenced subsisted and digitized the study area using arc GIS-9.2 and ERDAS-8.5.
DEM and slope map Geology map
Soil map Drainage density map. Land use/land cover. Geomorphology map
All the thematic maps were changed into raster format and superimposed by weighted overlay method (weightage wise thematic maps) for ground water potential zoning.
[image:4.612.131.582.394.713.2]All the thematic maps were changed into raster format and superimposed by weighted overlay method (weightage wise thematic maps) for ground water potential zoning.
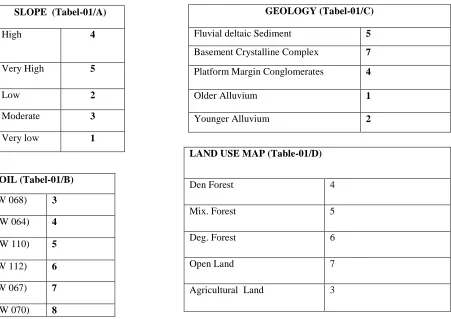
Table 01: Weightage of different parameters for Ground Water potential
SLOPE (Tabel-01/A)
High 4
Very High 5
Low 2
Moderate 3
Very low 1
GEOLOGY (Tabel-01/C)
Fluvial deltaic Sediment 5
Basement Crystalline Complex 7
Platform Margin Conglomerates 4
Older Alluvium 1
Younger Alluvium 2
LAND USE MAP (Table-01/D)
Den Forest 4
Mix. Forest 5
Deg. Forest 6
Open Land 7
Agricultural Land 3 SOIL (Tabel-01/B)
(W 068) 3
(W 064) 4
(W 110) 5
(W 112) 6
(W 067) 7
4.3 RECLASSIFIED SLOPE MAP: Digital elevation model (DEM) is derived using contour information from the topographical map for estimation of slope in degree. Weightage value is assigned to the different slope according to the recharge potential of Ground Water. Steeper the slope lower will be the potentiality of ground water recharge. Highest weightage value is assigned to the very high degree of slope. Five types of slope are found using the slope weightage value from Table, no.01/A. Those are very low, low, moderate, high and very high (Fig: 07).
Fig: 07
4.4 RECLASSIFIED SOIL MAP: In Jamboni, Binpur,
[image:5.612.58.298.413.707.2]Gopiballavpur, and Sankrail blocks have different types of soil namely very deep, moderately deep, well drained, fine loamy soil (w 068 & w 064), very deep moderately well drained, fine loamy soil occurring on very gently slope (w 110 & w 67) and very deep poorly drained fine soils (w 112) which is occurring on level two (W 070 AND W 069). Using weightage value form the Table no-01/B soil map is reclassified (Fig: 08). It is observed from the reclassified map that the highest potential zone is 2nd & 4th class, medium is 3rd & 6th class and lowest is the 1st & 5th class.
[image:5.612.325.594.443.709.2]4.5 RECLASSIFIED GEOLOGY: In this watershed various types of lithology like pebbles, gravels of different size, quartzite, sand with silt, clay etc is observed (Fig: 09). According to geological structures, highest weightage value is given to gravel of different size and lowest value to fragments of
quartz, granite, pebbles and gravels of the geological soil. In this study area Jamboni, Binpur, Gopiballavpur &
Sankrail block have different types of features like pediments, peniplanes, rides, hills, undulating planes, upland planes, & plantation surface and planes. Low weightage value is given to undulating planes whereas high weightage value to pedimants and planes.
Fig: 09
4.6 RECLASSIFIED DRAINAGE DENISITY: The
drainage map prepares primarily from the survey of India top sheet and then updated with the help of satellite data (Fig: 10). It noted from map that the flow direction of the river is from south- east to north-west. The source of water of this river is rain water. The total area of the water shed is 320square kilometer and length of the river is around 105 kilometer. Dranage density map is prepared using Arc GIS software and then using weightage value drainage density map is reclassified. It is observed form the map red zone (4th class) is the highest ground water potential zone whereas sky blue zone (1st class) lowest potential zone.
Fig: 10
4.7 GROUND WATER POTENTIAL ZONE: The
ultimate objective of the investigation is to find out the areas which have good ground water potential in the hard rock terrain of the present study.
Fig: 11
V. CONCLUSION
The ground water potential zones have been derived for the entire Dulang watershed and it has been divided into mainly four categories namely very low, low, medium and high recharge potential zone.
It is observed from the study- the ground water recharge zone is located only in the pediplain portion of the study area.
Rain water is mainly responsible for the ground water recharging for the study area.
However, the use of remote Sensing techniques is a very cost effective approach in prospecting and in
preliminary survey because the cost of drilling in random way is very expensive.
The limitation of this study is as follows-
Much of the information can only be confirmed by the use of well records, bore hole and other insitu sampling methods.
Due to the unavailability of temperature data the ground water potential zones measurement does not contain the overall accuracy
REFERENCES
[1] Chowdhary VM, Roan NH and Sarma PBS (2003) GIS based decision support system for groundwater assessmen in large irrigation project areas. Agricultural water managemen 62:229-252
[2] Das, D. & Kader, A. 1996. A Geomorphological approach for selecting the sites for artificial of groundwater in the upper catchment area of the Kumari river basin, eastern India. In: Abs. Vol. of Xth Convention of India Geological Congress. 8- 10February at ism Dhanbad, 35
[3] Dasgupta, S. Sikdar, P.K, 1992. Groundwater potential in the upper catchment of the Silai river basin. Bankura district, West Bengal. Indian journal of Earth Scince, 19(2-3) 128-135
[4] Gustafsson, P.1993. High resolution satellite data and GIS as a tool for assessment of groundwater potential of semi-arid area. In: IXth Thematic Conference on Geologic Remote Sensing. 8-11February, 1993at Pasadena, California, USA.
[5] Sarma B and Saraf AK (2002) Study of land use-ground –water relationship using an integrated remoe sensing and GIS approach, hpttp:/www.gisdevelopment.net
[6] Sinha, J (2006), Remote Sensing and GIS towards Runoff Assesment studies in Dulung Watershed, situated in West Bengal & Jharkhand states, un published M.Sc dissertation paper.
AUTHORS
First Author – Kartic Bera, Department of Remote Sensing & GIS, Vidyasagar University Paschim Medinipur, Midnapore721102, West Bengal, Telephone 03222
-276554/276555/276557/276558, Extn. 488, Fax: 03222-275329, Mobile No-09804703804, E-Mail: [email protected]
Second Author – Dr. Jatisankar Bandyopadhyay, Assistant