HYDRATE: REAL MENACE TO FLOW ASSURANCE
Anyadiegwu Charley Iyke C
1, Ohia N. P
1and Muonagor Chukwuemeka M
21
Department of Petroleum Engineering, Federal University of Technology, Owerri, Nigeria
2
Institute of Petroleum Studies, Port Harcourt, Institut Francais du Petrole, France E-Mail: [email protected]
ABSTRACT
The effect of hydrate formation on flow was evaluated. Orifice Flow equation was applied to compute the flow rates of Gas Stream A through the orifice before hydrate formation and after hydrate formation. From the computations and Figure-3.1, it is seen that hydrate formation reduces the amount of flow through the orifice. The flow rate through the orifice before hydrate formation was 2465829.4scf/hr but after hydrate of about 2.25’’ thickness was formed the flow rate reduced to 668146.4scf/hr. Also, from Figure-3.1, as the thickness of the hydrate increases, the flow rate of gas through the orifice decreases.
Keywords: natural gas stream, flow rate, hydrate, water content, orifice, inhibition.
1. INTRODUCTION
Flow assurance can be defined as an operation that provides a reliable and controlled flow of fluids from the reservoir to the sales point. Flow assurance operation deals with formation, depositions and blockages of gas hydrates, paraffin, asphaltenes, and scales that can reduce flow efficiency of oil and gas pipelines. Due to significant technical difficulties and challenges, providing safe and efficient flow assurance needs interdisciplinary focus on the issue and joined efforts of scientists, engineers and operation engineers (Guo et al., 2005).
The formation of hydrates in a pipeline is common in seasonally cold or sub-sea environments with low temperatures and high pressures. In particular, hydrate blockages become a real menace to flow assurance in inadequately protected flowlines (Hunt, 1996).
Gas hydrates can form at the gas liquid interfaces along the entire length of the static pipeline. This can create small volumes of hydrate over time, but usually do not block the pipeline. However, when flow resumes, plugs can form at any point where the flow regime changes. Small-scale hydrate formation in the interface sometimes cannot be avoided in the pipeline. Moreover, under certain conditions, small-scale agglomerates are also observed in the bulk phase. Hydrate formation does not become a threat to pipe flow unless the agglomerates and hydrates formed at the interface start forming bridges. In such cases blockage occurs where the small accumulations of hydrates adhere to the walls and begin to bridge and reduce flow. This bridging can eventually shut down the
entire pipeline or field until the hydrates have been removed (Austvik, 2000).
Hydrates may exist far above the freezing point of water, and hence they can cause plugging of pipelines and nozzles. Also, they may cause many difficulties in deep water drilling platform because they could block mud line, choke, and blow out preventer (BOP). For over 160 years hydrates remained a mere scientific curiosity. Their importance to the oil and gas industry was realized in the early 1930’s when Hammerschmidt discovered that the solid compounds, which frequently plugged the gas transmission lines during cold weather, were not ice but hydrates (Hammerschmidt, 1934).
Hydrate formation poses challenge to natural gas pipeline, some of which are:
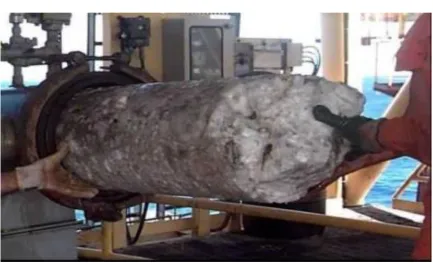
- Flow restriction: Hydrate blockages are major problem in offshore and arctic operations. They can formed in subsea transfer lines, high residence time pipelines, gas expansion cross valves due to sub-cooling effect, etc. Hydrate formation is also common in hydrocarbon transmission lines such as ethane, propane and ethylene that are operating under low temperature environment.
Figure-1. A large gas hydrate plug formed in a subsea hydrocarbon pipeline. Source: Heriot-Watt University Institute of Petroleum Engineering, (2013).
2. METHODOLOGY
The flow rate of gas through the orifice is computed with equation 1 shown below:
Q = Ci(hwPf) 0.5
(1)
Where Ci is the Orifice flow constant expressed in equation 2 below:
Ci = Fb*Fr*Y*Fpb*Ftb*Ftf*Fg*Fpv*Fm*Fl*Fa (2)
Fb = Base Orifice Factor read from the Orifice Meter Table shown in Appendix B1
Fr = Reynold’s Number Factor given by equation 3 as:
Fr = 1+b/(hwPf) 0.5
(3)
b is read from Appendix B2
Y = Expansion Factor read from the Orifice Meter Table shown in Appendix B3 at d/D and hw/Pf Fpb = Pressure Base Factor given by equation 4 as:
Fpb = 14.73/Pb (4)
Ftb = Temperature Base Factor given by equation 5 as:
Fg = (1/SG)0.5 (7)
Fpv = Super compressibility Factor given by equation 8 as:
Fpv = (1/z)0.5 (8)
Fm = Manometer Factor given by equation 9 as:
Fm = [(62.3663-(Patm+(hw/27.707))/192.4)/62.3663]0.5 (9)
Fl = Gauge Location Factor given by equation 10 as:
Fl = (g/32.17405)0.5 (10)
Fa = Orifice thermal expansion factor given by equation 11 as:
Fa = 1 + 0.000018(T - Tm) (11)
3. RESULTS
Table-1. Data for natural gas stream A.
Gas temperature, T, 0F 35
Gas Pressure, P, psig 1200
Gas Specific Gravity, SG 0.70 Water Content of the Gas, Cw,
lb/MMscf 39.3
Differential Pressure at 600F, hw, in 65
Absolute Static Pressure, Pf, psia 2000
Orifice Size, d, in 4.75
Pipe Size, D, in 11.376
Absolute Base Pressure, Pb, psia 14.65
Absolute Base Temperature, Tb, 0F 60
Gas Compressibility Factor, z 0.7
Atmospheric Pressure, Patm, psia 14.4
Gravitational Acceleration, g, ft/s2 32.1418 Temperature During Orifice Boring,
Tm, 0
F 25
3.1 Flow through the Orifice without hydrate formation
Fb = Base Orifice Factor read from the Orifice Meter Table shown in Appendix B1 at pipe size of 11.376 as 5191.5
b is read from Appendix B2 at d = 4.75 and D = 11.376 as 0.0178
From equation 3, Fr = 1+0.0178/(65*2000) 0.5
= 1.000049368
Y = Expansion Factor read from the Orifice Meter Table shown in Appendix B3 at d/D of 4.75/11.376 which is 0.418 and hw/Pf of 0.03 as 1.003824
From equation 4, Fpb = 14.73/Pb = 14.73/14.65 = 1.00546 From equation 5, Ftb = (60 + 460)/520 = 1
From equation 6, Ftf = [520/(35 + 460)]0.5 = 1.02494 From equation 7, Fg = (1/0.7)
0.5
= 1.195 From equation 8, Fpv = (1/0.7)0.5 = 1.195 From equation 9, Fm = [(62.3663 - (14.4 + (65/27.707))/192.4)/62.3663]0.5 = 0.9993
From equation 10, Fl = (32.1418/32.17405)0.5 = 0.9995 From equation 11, Fa = 1 + 0.000018(35 - 25) = 1.00018 From equation 2, Ci = 5191.5 * 1.000049368 * 1.003824 * 1.00546 * 1 * 1.02494 * 1.195 * 1.195 * 0.9993 * 0.9995 * 1.00018 = 7661.75
From equation 1, Q = 7661.75 * (65 * 2000)0.5 = 2762482 scf/hr
2762482scf/hr is the flow rate through the orifice without hydrate formation.
3.2 Flow through the Orifice with hydrate formation The flow rate through the orifice after hydrate formation is computed as follows:
The New Orifice Size, d2 = Orifice Size - Hydrate Thickness 3.1
d2 = 4.75 – 2.25 = 2.5
The New Base Orifice Factor Fb2 is read from the Orifice Meter Table shown in Appendix B1 at pipe size of 11.376 as 1295.9
For the New Reynold’s Number Factor:
The New b is read from Appendix B2 at d = 2.5 and D = 11.376 as 0.0342
The New Fr, Fr2 = 1+0.0342/(65*2000)0.5 = 1.000094854
The New Expansion Factor, Y2 read from the Orifice Meter Table shown in Appendix B3 at d/D of 2.5/11.376 which is 0.22 and hw/Pf of 0.03 as 0.99967
The New Flow Constant is computed as follows: Ci = 1295.9 * 1.000094854 * 0.99967 * 1.00546 * 1 * 1.02494 * 1.195 * 1.195 * 0.9993 * 0.9995 * 1.00018 = 1904.7
The flow rate after hydrate formation is then evaluated using equation 1 as:
Q = 1904.7 * (65 * 2000)0.5 = 686747.2 scf/hr
Using equation 1, the Orifice Flow Rate at various Hydrate Thicknesses is computed and presented in Table-2 and used to generate plot of Orifice Flow Rate at various Hydrate Thicknesses as shown in Figure-1.
Table-2. Orifice flow rate at various hydrate thicknesses.
Hydrate thickness, in Orifice flow rate, scf/hr
0 2762482.0
0.5 1959776.4
1 1517364.2
1.5 1134777.5
2 809684.8
2.5 540390.4
3 325972.3
Figure-2. Orifice flow rate at various hydrate thicknesses.
4. CONCLUSIONS
From the evaluations conducted using the equations, computer models and charts, the following conclusion may be drawn:
According to Figure-2, hydrate formation reduces the amount of gas flow through the orifice. The flow rate through the orifice conducting natural gas stream A before hydrate formation was 2465829.4scf/hr but after hydrate of about 2.25’’ thickness was formed the flow rate reduced to 668146.4scf/hr.
REFERENCES
Austvik T., Li X. and Gjertsen L.H. 2000. Hydrate plug properties; formation and removal of plugs, Gas Hydrates: Challenges for the future, Annals of New York Academy of Science. 912, pp. 294-303.
Guo D.B., D.S. Song, J. Chacko, D.A. Ghalambor. 2005. Offshore Pipelines, Gulf Professional Publishing, Houston, Texas.
Guo D.B. and Ghalambor D.A. 2005. Natural Gas Engineering Handbook; Gulf Publishing Company, Houston, Texas.
Hammerschmidt E. G. 1934. Formation of Gas Hydrates in Natural Gas Transmission Lines. Ind. Eng. Chem. 26: 851-855.
Heriot-Watt University Institute of Petroleum
Engineering, Heriot-Watt University, Edinburgh EH14 4AS
Hunt A. 1996. Fluid Properties Determine Flow Line Blockage Potential; Oil & Gas Journal. 62-66.
APPENDIX A: NOMENCLATURE
Ci = Orifice Flow Constant D = Pipe diameter
d = Orifice diameter Deg F = Degree Fahrenheit ft/s2 = Foot per square second Fb = Base Orifice Factor read Fr = Reynold’s Number Factor Fpb = Pressure Base Factor Ftb = Temperature Base Factor Ftf = Flowing Temperature Factor Fg = Specific Gravity Factor Fpv = Super compressibility Factor Fm = Manometer Factor
Fl = Gauge Location Factor
Fa = Orifice Thermal Expansion Factor g = Gravitational acceleration
psia = Pound per square inch (atmosphere) psig = Pound per square inch (gauge) q = Gas flow rate
scf/hr = Standard cubic foot per hour SG = Specific gravity
Y = Expansion Factor Z = Compressibility factor
0.0 500000.0 1000000.0 1500000.0 2000000.0 2500000.0 3000000.0
0 0.5 1 1.5 2 2.5 3 3.5 4
Orif ice Fl ow R ate, scf /h r
APPENDIX B: ORIFICE METER TABLES