Evaluate the performance of the K-means method
when increasing the sample Size
(Applied to a Dataset package for diabetics)
Omer A.Khalid*, Mubarak H. Elhafian*, **, Afra H. Abdulatif*
* Department of Statistics, Sudan University of Science and Technology, Khartoum, Sudan [email protected],[email protected]
** Department of Mathematics,
Faculty of Science and Arts, King Abdul-Aziz University, Jeddah, Kingdom of Saudi [email protected]
DOI: 10.29322/IJSRP.8.9.2018.p8134
http://dx.doi.org/10.29322/IJSRP.8.9.2018.p8134
ABSTRACT— Inthis paper, weexamined K-means clustering algorithm as one of the methods of data clustering and analysis process. The proposed study investigated the k-means algorithm with different size of samples. This study was tested the diabetes UCI standard dataset as case study. We start our experiments with 1015(Random number) sample size, and then we increase the sample size for each run by 1015 units. The elapsed time for each tested was calculated and reported for investigation process. Our investigation procedure was conducted using the R software. The One-Sample Kolmogorov-Smirnov Test used for examined the normality of the sample size and clustering processing time. The test proofed that the samples that we used is not distributed normally. In order to test the effect of the increase in sample size, we divided the samples into two groups: small samples (1015-15225) and large samples (17255-30450). Using a Mann-Whitney U test to test for a difference between the two groups, the median was found to be equal in the two groups. The correlation coefficient between time and sample size was also calculated and found to be weak. Our investigation shows that the efficiency of the k-means cannot influences with the sample size.
Keywords— K-means; cluster analysis; Big Data; sample size, elapsed time
1. INTRODUCTION
Data represent the important aspect of any applied study.In our area there are a number of things such as Internet networks and other sources of information that contain data of various kinds images, videos, texts, numbers and other types of data .Diffrent files that contain these data and different programs deals with them. The term large data (Big Data) appeared with the development of means of communication and information networks. The main problems of large data are data storage ,data retrieval and statistical analysis. In our study, we will address the efficiency of statistical programs used in ordinary computers in data analysis when increasing sample size , this study we will be interested in the time it takes to implement the algorithms of cluster analysis. Cluster analysis is considered an important statistical analysis and has many uses in different fields. Many studies have been concerned with cluster analysis and the different ways of doing it. Most of the studies dealt with the use of algorithms, the different methods of cluster analysis, development of new algorithms and comparison between methods [1] [2] [3].A few studies concerned the time and the improvement of the time of completion according to different method [4][5].
multiple clusters, such that data units within the same cluster are homogeneous. When we used the k-means clustering method, each cluster is represented by its center which corresponds to the mean of points assigned to the cluster [8][9]. When constructing partitions with a fixed number k of clusters, it is often assumed that there exists a function which measures the quality of different clustering of the same data set [10] [11]. For further information on clustering and clustering algorithms, see [12] [13] [14].
There are several k-means algorithms available. The standard algorithm is the Hartigan-Wong algorithm (1979), which defines the total within-cluster variation as the sum of squared distances Euclidean distances between items and the corresponding centroid [8] :
This method consists of its three simplest steps: 1. Divide values into primary groups.
2. Place each value in the group with the nearest Arithmetic Mean (usually using the Euclidean distance to calculate the distance either by actual observations or standard observations). We recalculate the arithmetic mean of the group to which the new item was added and the group from which the individual was lost.
3. Repeat the second step until the values distribution process stops. Instead of starting with the first step by dividing all the values into K from the averages of the initial groups, we can begin by specifying K (base points) and then implementing the second step.
The final distribution of data values depends, to a certain extent, on the groups on the first partition used or on the first choice of base points. Usually one does not know the number of clusters present in a data set. Because most partitioning methods provide a fixed number k of clusters, one must apply them for several values of k in order to find the most meaningful clustering [15].
In this study we will take care of the time of clustering .The following algorithm were used to calculate the time "Elapsed Time" variable as the total time from the beginning of the command until the end of it, to obtain the results we use the function proc.time ( )where this function stores the timing in a variable immediately before the beginning of the implementation and then calculate the time after implementation and subtract the initial value of it to obtain the time taken where the output appears in the form of three values .As described in the following steps[10]
Start.point <- proc.time() “Type your code here” proc.time () – Start.point Start.point ≡ “the time on Start”. Proc.time () ≡ “function retrieve the time from Windows”.
Note: The three steps must be shaded at execution until the R program performs the steps sequentially [10][16].
3. Formulation of the Problem and proposed method of solution.
Previous studies have been concerned with cluster analysis and the algorithms used in the different methods. There are few studies that have studied this analysis in other sides. This study deals with the time taken to make the clustering for data set in case of increasing the size of the sample. The important question is whether the size of the sample affects the time taken to clustering data using the k-means method? Does analyzing big data in this cluster analysis by k-means method require a special type of computer or not?
The diagram above illustrates the steps that will be taken to study and analyze the study problem
4. Numerical results. To study our problem, we took data from the site of the center of learning machine and intelligent
Calculate the elapsed Time
Normal t-test
Determine the effect of increasing sample size on elapsed time
Person correlation
Spearman correlation Un normal
Mann-Whitney U test Test the
normality Of elapsed time
Increase the sample size by add 1015 units Data
Set
States. These data were prepared for the purpose of diabetes study. The total number of patients whose data are available is (101766) patients. The data included variables such as strain, age, sex, duration of stay in hospital, number of laboratory tests, Number of procedures (non - laboratory) performed by the patient during his stay in the hospital, Number of medical drugs, number of outpatient clinics, emergency visits per year before entering the hospital, Number of visits to the hospital [17].
Table (1):The variables
Percentage of missing values% Variable label variable 2 Strain patient Strain 0 Type of patient as well as definition of non-identification type as
an unknown value Sex
0 The age of the patient is divided into 10 categories of 10 years in
each category from 0 to 100 Age
0 The period of the patient's stay until he is out in the range between
(1-14) days Duration
0 Number of laboratory tests performed for the patient
Laboratory procedures
0 Number of procedures (non - laboratory) performed by the patient
during his stay in the hospital procedures
0 Number of medicines taken
pharmaceutical
0 Number of visits to outpatient clinics within a year
Outpatient clinics
0 The number of emergency visits carried out by the patient during
the year Emergency
visits
0 Number of visits to the hospital
Internal visits
Table (4) illustrates the variables introduced in the research and their definition.
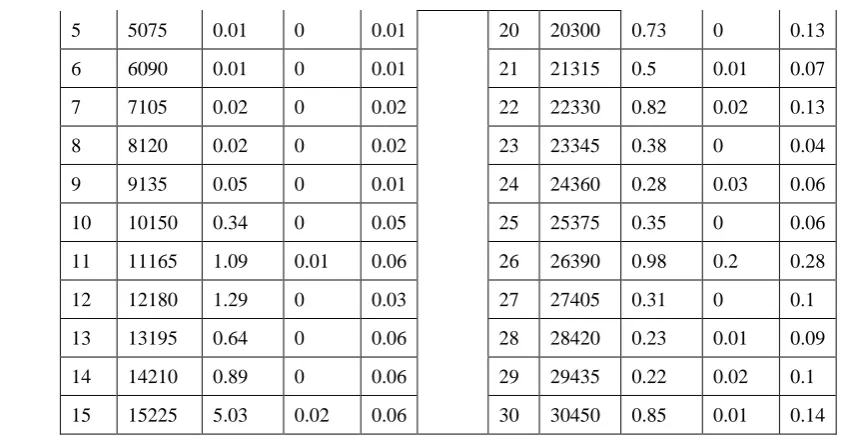
-To analyze the data the R Program (R-Programming) used to measure the time taken to cluster data set. In the beginning, a random sample of 1015 patients was selected and a cluster analysis was performed using the k- mean method. Through the algorithm proc.time() in the program R the time of implementation of this process was counted. Then we add the same number each time and repeat the previous steps each time. This process was carried out 30 times and the data obtained in the table (2).
We define the following variables User: User times of the current R process * System: System times of the current R process * Elapsed: Time since the process was started
Table (5) shows the measurement of the time taken by the computer for the steps of the k-means method. The time was obtained in seconds with the sample size being increase by 1015 units each time
Table (2):The time of the K-means method in seconds with sample size
[image:3.595.107.535.160.418.2] [image:3.595.112.535.162.417.2] [image:3.595.106.498.639.759.2].
-To determine which test we were used we must test the normality of the data values .we use One-Sample Kolmogorov-Smirnov Test
Graph no (1):Goodness of fit for normal distribution
Table (3):One-Sample Kolmogorov-Smirnov Test
Decision P-value
Test value Hypothesis
Accept the hypothesis 0.03035
0.25766 Data are not distributed normally
Table (6) shows the Normality Test. the Sig for One-Sample Kolmogorov-Smirnov Test is equal to (0.03035) is less than 0.05 that lead us to accept the alternative hypothesis (the data are not distributed normally).
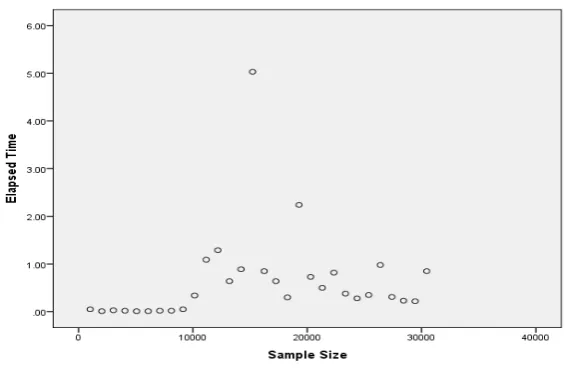
-To illustrate the relationship between the sample size and the elapsed time we compute the spearman rank correlation coefficient
Graph no (2)
Relationship between elapsed time and sample size
[image:4.595.76.500.67.290.2]Table (4):Correlation coefficient
Decision p-value
Correlation coefficient hypothesis
Weak positive linear relationship 0.359
0.477 There is no statistically
significant relationship between time and sample size
Through the linear correlation coefficient value, we observe that the correlation between the elapsed time and sample size is weak. And through the p- value (0.359) we note that it’s greater than 0.05, which leads to the acceptance of null hypothesis and therefore there is no statistically significant relationship between time and sample size
-In order to test the difference between the median of elapsed time in small samples (1-15) and the median of elapsed time in large samples (16-30), the Mann-Whitney U test will be used because elapsed time does not follow normal distribution
Table (5):Statistics
Highs value Lowest
value Standard
deviation Median
Mean The Measures
5.03 0.1
1.29453 0.0500
0.6333 Small Samples
2.24 0.22
0.51226 0.5000
0.36543 Large Samples
Table 7 shows descriptive measurements of small and large samples
Table (6):*Nonparametric Tests: Mann-Whitney U test.
Decision p-value
Hypothesis
Accept the null hypothesis 0.143
The median of elapsed time in small samples equals the median time in large samples
Table( 6) shows that the p- value (0.143) is greater than 0.05. That means accept the null hypothesis (The median of elapsed time in small samples equals the median time in large samples or there are no significant differences between the median elapsed time in the small samples and the median elapsed time in the large samples ).
[image:5.595.158.443.69.253.2]6.REFERENCES
[1] Ghosh, Soumi, and Sanjay Kumar Dubey. "Comparative analysis of k-means and fuzzy c-means algorithms." International Journal of Advanced Computer Science and Applications 4, no. 4 (2013).
[2] Sawant, Kedar B. "Efficient determination of clusters in k-mean algorithm using neighborhood distance." The International Journal of Emerging Engineering Research and Technology 3, no. 1 (2015): 22-27.
[3] Velmurugan, T. "Efficiency of k-means and k-medoids algorithms for clustering arbitrary data points." Int. J. Computer Technology & Applications 3, no. 5 (2012): 1758-1764.
[4] Napoleon, D., and P. Ganga Lakshmi. "An efficient K-Means clustering algorithm for reducing time complexity using uniform distribution data points." In Trendz in Information Sciences & Computing (TISC), 2010, pp. 42-45. IEEE, 2010.
[5] Rauf, Azhar, Saeed Mahfooz Sheeba, Shah Khusro, and Huma Javed. "Enhanced k-mean clustering algorithm to reduce number of iterations and time complexity." Middle-East Journal of Scientific Research 12, no. 7 (2012): 959-963.
[6] Aldenderfer, Mark S., and Roger K. Blashfield. "Cluster analysis: Quantitative applications in the social sciences." Beverly Hills: Sage Publication (1984).
[7] Bernstein, Ira H. Applied multivariate analysis. Springer Science & Business Media, 2012.
[8] Everitt, Brian. "Cluster Analysis. Second." (1980).
[9] Kaufman, Leonard, and Peter J. Rousseeuw. Finding groups in data: an introduction to cluster analysis. Vol. 344. John Wiley & Sons, 2009.
[10] Everitt, Brian, and Torsten Hothorn. An introduction to applied multivariate analysis with R. Springer Science & Business Media, 2011.
[11] Krajewski, Grzegorz, and Danielle Matthews. "RH Baayen, Analyzing linguistic data: A practical introduction to statistics using R. Cambridge: Cambridge University Press, 2008. Pp. 368. ISBN-13: 978-0-521-70918-7." Journal of Child Language 37, no. 2 (2010): 465-470.
[12] Capoyleas, Vasilis, Günter Rote, and Gerhard J. Woeginger. "Geometric clusterings." J. Algorithms 12, no. 2 (1991): 341-356.
[13] Kaufman, Leonard, and Peter J. Rousseeuw. Finding groups in data: an introduction to cluster analysis. Vol. 344. John Wiley & Sons, 2009.
[14] Inaba, Mary, Naoki Katoh, and Hiroshi Imai. "Applications of weighted Voronoi diagrams and randomization to variance-based k-clustering." In Proceedings of the tenth annual symposium on Computational geometry, pp. 332-339. ACM, 1994.
[15] Kaufman, Leonard, and Peter J. Rousseeuw. "Partitioning around medoids (program pam)." Finding groups in data: an introduction to cluster analysis (1990): 68-125.
[16] Duin, Robert PW, and D. M. J. Tax. "Statistical pattern recognition." In Handbook of Pattern Recognition and Computer Vision, pp. 3-24. 2005.