ISSN 2250-3153
Abstract- Groundwater level is an indicator of groundwater availability ,groundwater flow and the physical characteristics of the groundwater system. Management of water resources requires input from hydrological studies. This is mainly in the form of estimation of the magnitude of a hydrological parameters. The factors that influence and control the groundwater level fluctuation were determined to develop a forecasting model and examine its potential in predicting groundwater level. Models for prediction of water table depth were developed based on Artificial Neural Networks(ANN) with different combinations of hydrological parameters. The best combination was confirmed with factor analysis. The input parameters for groundwater level forecasting were derived using Time Series Analysis (TSA).Mamom river basin in Trivandrum district was chosen as the study area as its groundwater resources have been used as the main source for drinking and agricultural purposes.
Index Terms- Artificial neural network, groundwater level, factor analysis, time series analysis, model tree
I. INTRODUCTION
roundwater is the major source of drinking water in both urban and rural India. Besides, it is an important source of water for the agricultural and the industrial sector. Groundwater level is an indicator of groundwater availability, groundwater flow, and the physical characteristics of an aquifer or groundwater system[5]. Due to increased population and decreased groundwater recharge, the demand increases and it may not be feasible to check the draft of groundwater resources. The only available option is to increase the recharge rate to the aquifer by suitable means. Therefore it is necessary to quantify the present rate of groundwater recharge, monitor the change in water table depth and then predict the future trend of water table depth before any intervention.Any phenomenon, which produces pressure change within an aquifer, results into the change of ground water level[2]. These changes in ground water level can be a result of changes in storage, amount of discharge and recharge, variation of stream stages and evaporation. Where a stream channel is in
indirect contact with an unconfined aquifer, the stream may recharge the ground water, or receive discharge from the ground water[3]. The general consideration is that due to any reason if the aquifer pressure rises above the atmospheric pressure an up leveling in ground water level results and vice versa[6]. ANN is the most popular tool for groundwater prediction. In the present study, factor analysis was introduced to identify the factors that have maximum influence on the groundwater level of the area and time series analysis to forecast the influencing factors prior to ANN prediction.
Many studies have been conducted in the area of predicting groundwater level. Out of the various methods available, ANN is a very useful tool for predicting groundwater level. ANN is specifically used when a number of data are available. Riccardo Taormina , (2012) [4] developed an application of Feed Forward Neural networks (FFNs) for long period simulations of hourly groundwater levels in a coastal unconfined aquifer situated in the Lagoon of Venice, Italy. After initializing the model with groundwater elevations observed at a given time, the developed FFN should be able to reproduce water level variations using only the external input variables, which have been identified as rainfall and evapotranspiration. To achieve this purpose, the models were first calibrated on a training dataset to perform 1-h ahead predictions of future groundwater levels using past observed groundwater levels and external inputs. Simulations were then produced on another data set by iteratively feeding back the predicted groundwater levels, along with real external data. The results showed that the developed FFN can accurately reproduce groundwater depths of the shallow aquifer for several months. Ahmad and Ali (2008) [2] analysed the capability of two ANN models to predict the urban groundwater level using different sets of available input data, and then compared the results of these two models. A multi-input-single-output network has been trained using Levenberg-Marquardt algorithm. The aforementioned models are evaluated using three statistical performance criteria namely mean square error (MSE), root mean squared error (RMSE), and efficiency (R2). The results showed the importance of input data selection and its effect on prediction accuracy. Also, this study confirmed that ANN models are capable in predicting the
G
Groundwater level forecasting using Artificial Neural
Network
Suja S Nair *, Dr. Sindhu G **
ISSN 2250-3153
groundwater level even in complicated urban water cycles using common hydrological data.
Most of the researches used ANN alone to predict groundwater level. But the present study incorporated factor analysis along with time series forecasting to increase the accuracy and usefulness of prediction.
II. STUDY AREA
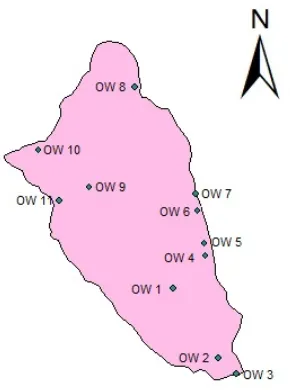
[image:2.612.67.212.303.498.2]The study area is located in the Mamom river basin which lies between longitude 8° 35' 36.06 '' N to 8° 40' 42.96'' N and latitude 76° 51' 1.14'' E to 76° 49' 27.66'' E and with a basin area of 114 km2. Fig 1 shows the study area with 11 observation well locations. As per the data obtained from State Groundwater Department (SGWD) Kerala, (2009), the area receives an yearly rainfall of 2200-2070 mm. Major portion of the rain is received during the southwest monsoon period (May to November), which accounts for about 87% of annual rainfall.
Fig 1: Well locations in study area
III. METHODOLOGY
The methodology of this research can be divided into four phases; Field Survey, Factor analysis, Time series analysis and Prediction of groundwater level using ANN.
A. Field survey
Field survey was carried out to establish the observation well locations suitable for the study area. The wells were selected in such a way that areas of different elevations are suitably covered. The spatial locations were identified by conducting GPS (Global positioning system) survey. The groundwater level was recorded periodically.
B. Factor analysis
In factor analysis the correlation between input parameters Potential evapotranspiration (PET), temperature, humidity and rainfall were analysed using Statistical Package for Social Sciences (SPSS) for monsoon and non monsoon season. Any factor having component value less than 0.5 was extracted as it is less significant for the input combination.
C. Time series analysis (TSA)
In this phase the input parameters required for the prediction of groundwater level were forecasted. The values were forecasted based on previously observed data. In this study, time series analysis based on moving average method was adopted.
D. Prediction using ANN
[image:2.612.334.488.478.612.2]ANN is an information processing paradigm inspired by biological nervous systems, such as our brain. It consists of large number of highly interconnected processing elements, called neurons, working together[1]. An ANN consists of input, hidden and output layers as shown in Fig 2 and each layer includes an array of processing elements. A Neural network is characterized by its architecture that represents the pattern of connection between nodes, its method of determining the connection weights, and the activation function[4]. The learning, training, performance and transfer functions used in this study are LEARNGDM, TRAINSCG, MSE AND TRANSIG respectively.
Fig 2: Typical architecture of ANN
ISSN 2250-3153
IV. RESULTS AND DISCUSSION
A. Factor analysis
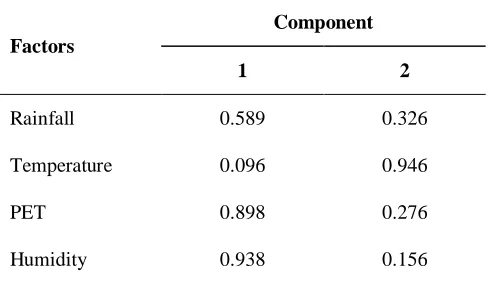
[image:3.612.31.275.212.353.2]The components derived from the factor analysis for monsoon season is shown in Table 1.Temperature is having a component value of 0.096 and it cannot be used as an input parameter for monsoon season.
Table 1: Factor analysis for monsoon season
Factors
Component
1 2
Rainfall 0.589 0.326
Temperature 0.096 0.946
PET 0.898 0.276
[image:3.612.359.580.272.433.2]Humidity 0.938 0.156
Table 2: Factor analysis for non monsoon season
Factors
Component
1
Rainfall 0.686
Temperature 0.509
PET 0.961
Humidity 0.810
The component matrix of factor analysis for non monsoon season is shown in Table 2. All input factors were having factor value greater than 0.5. showing their influence on the output parameter, groundwater level. Therefore, based on the factor analysis, for monsoon season, rainfall, PET and
humidity were selected as the major influencing parameters whereas for non monsoon season, rainfall, PET, humidity and temperature were selected.
B. Performance of ANN models
The best performances of the network during monsoon and non monsoon period are shown in Table 3 and Table 4. From this, it is inferred that the model gives the best performance when rainfall, humidity and PET are given as input parameters during monsoon season. During non monsoon season, best performance is obtained when temperature is added to the input parameters, which indicates the influence of temperature on the groundwater level during non monsoon period.
Table 3: Best performance of ANN models (Monsoon)
Table 4: Best performance of ANN model(Non monsoon)
By analyzing the values in tables 3 and 4 it can be found that a slight reduction in coefficient of correlation is seen for OW28. The altitudes of TW36 and OW14 are 14.8m and 15.3m respectively with respect to mean sea level, whereas altitude of OW28 is 32.5m with respect to mean sea level. This higher elevation may be the reason for the reduction in correlation.
C. Prediction of groundwater level using ANN
The TSA forecasted input parameters rainfall, PET, temperature and humidity were used as inputs in ANN to predict groundwater level up to 2016. The forecasted data was
Sl
No. Well No. Inputs Architecture R
2
1 TW 36
Rainfall, PET, Humidity
3 -15 -1 0.81
2 OW 14
Rainfall, PET, Humidity
3 -15 -1 0.84
3 OW 28
Rainfall, PET, Humidity
3 -15 -1 0.72
Sl No. Well No. Inputs Architecture R2
1 TW 36
Rainfall, Temperature,
PET, Humidity
4 -15 -1 0.74
2 OW 14
Rainfall, Temperature,
PET, Humidity
4 -15 -1 0.74
3 OW 28
Rainfall, Temperature,
PET, Humidity
[image:3.612.31.259.414.555.2]ISSN 2250-3153
compared with the observed data of all the three observation wells.
[image:4.612.319.573.41.366.2]Fig 3: Open well 14, observed V/S predicted graph (monsoon)
Fig 4: Tube well 36, observed V/S predicted graph (monsoon)
[image:4.612.37.281.71.212.2]
Fig 5: Open well 28, observed V/S predicted graph (monsoon)
[image:4.612.37.287.255.393.2]Fig 6: Open well 14, observed V/S predicted graph (non-monsoon)
[image:4.612.329.569.411.556.2]Fig 7: Tube well 36, observed V/S predicted graph (non-monsoon)
Fig 8: Open well 28, observed V/S predicted graph (non-monsoon)
The relation connecting observed and predicted values for the three observation wells during monsoon and non monsoon seasons is shown in figures 3 to 8. Observing these graphs, it can be inferred that up to June 2015 the observed and predicted values of groundwater level show same trend for all the observation wells.
V. CONCLUSION
[image:4.612.36.288.428.573.2]ISSN 2250-3153
ground water to satisfy the needs of a huge population has resulted in severe stress on the limited resources available, leading to progressive decline of water levels. Design of architecture of ANN, a robust tool in water resource modelling and forecasting was carried out to simulate the trend of groundwater level and its prediction. Factor analysis was carried out using SPSS to identify the optimum combination of input parameters. ANN models were also developed using different sets of combinations of the input parameters and the best combination was selected based on the performance parameters. Factor analysis and ANN gave same set of input combinations for groundwater level forecasting during monsoon and non monsoon season. Since the trend of variation of groundwater level is same for predicted and observed cases, this model can be used for predicting groundwater level of Mamom river basin.
REFERENCES
[1] Ahmet Dogan, Husnu Demirpence and Murat Cobaner (2012). "Prediction of groundwater levels from lake levels and climate data using ANN approach."
[2] Verma, H C, Sharma, S P, Kumar, A (2010). "Prediction of water table depth in a hard rock basin by using artificial neural network." International Journal of Water Resources and Environmental Engineering Vol.2 (4), pp. 95-102, June, 2010.
[3] Steven Humphrey, Donald M Reeves (2008). "A stochastic approach to a groundwater flow model."
[4] Nourani, V, Hosseini Baghanam, A, Daneshvar Vousoughi, F and Alami, M T (2012). "Classification of groundwater level using ANN forecasting model." International Journal of Soft Computing and Engineering (IJSCE) ISSN: 2231-2307, Volume-2, Issue-1, March 2012.
[5] Hasan Srihan and Manfred Koch (2010) "Prediction of groundwater level in Gaza coastal aquifer using ANN."
[6] Affandi, A K, Watanabe, K, Tirtomihardjo, H (2007) "Application of an Artificial Neural Network to estimate ground water level fluctuation." International Journal of Spatial Hydrology. 7(2): 23-46.
[7] Petchinathan, G, Valarmathi, K (2014) "Local linear model tree and Neuro-Fuzzy system for modelling and control of an experimental pH neutralization process" Brazilian Journal of Chemical Engineering Braz. J. Chem. Eng. vol.31 no.2
AUTHORS
First Author – Suja S Nair, M.tech Civil, College of Engineering Trivandrum, [email protected].