Simulation based Performance Analysis of Zone Routing
Protocol in Manet
Neha Jain Yogesh Chaba,
Ph.DAssistant Professor Associate Professor
MRIU, Faridabad GJUS&T, Hissar
ABSTRACT
The Zone Routing Protocol is a protocol which employs both the activities of proactive and reactive protocols. It is mainly designed for Mobile Adhoc Networks. The transfer of data inside the routing zone is handled by proactive part of ZRP i.e IARP and outside the routing Zone is done by the reactive part i.e IERP. In this work, an analysis has been done by setting up two different simulation environments for ZRP. First is by varying the Zone Radius and another one is by varying the node density for various zone radius. This will help us in analyzing the performance of zone routing protocol in highly dynamic environment.
Keywords
ZRP,BRP,IARP,IERP,Jitter,Normalized Routing Overhead
1.
INTRODUCTION
A MANET (Mobile Ad-hoc Network) is a type of adhoc network with rapidly changing topology. These networks typically have a large span and connect hundreds to thousands of nodes [1]. These networks are fully distributed, and can work at any place without the aid of any infrastructure. One of the distinctive features of MANET is, each node must be able to act as a router to find out the optimal path to forward a packet. As nodes may be mobile, entering and leaving the network, the topology of the network will change continuously [2].
Since the nodes in Ad hoc networks are free to move over a certain area which results into frequent change in the network topology, design of suitable routing protocol is essential to adapt the dynamic behavior of the network. Therefore to meet the needs, Zone Routing Protocol has been designed which has both the properties of table-driven and on-demand protocols. This study shows the behavior and operation of Zone Routing Protocol as well as effect of increasing zone radius and node density on various performance matrices in highly mobile environment.
Basically paper is divided into five sections where Section I deals with an introduction to Mobile adhoc networks, section II provides a brief overview on Zone Routing Protocols (ZRP), Section III deals with the simulation methodology and section IV gives the detailed analysis of the result obtained from the experiments and section V concludes the work and also provides the future scope of the work.
1.1 Description Of Protocol
1.1.1 Zone Routing Protocol
:
The ZRP protocol, developed by Haas and Pearlman, incorporates a localized zone approach to routing. The fundamental approach is to incorporate a hybrid protocol that exploits the benefits of both a reactive and a proactive protocol[3]. It was designed to mitigate the problems of those two schemes. Proactive routing protocol uses excess bandwidth suffers from long route request delays and
inefficient flooding the entire network for route determination. ZRP addresses these problems by combining the best properties of both approaches. In ZRP, the distance and a node, all nodes within -hop distance from node belongs to the routing zone of node[4]. However, size of a routing zone depends on a parameter known as zone radius. In ZRP, each node maintains the routing information of all nodes within its routing zone.Components of ZRP are IARP, IERP and BRP.
1.1.2 Intrazone Routing Protocol (IARP)
The first protocol of ZRP is the Intrazone Routing Protocol (IARP). IARP is responsible for maintaining routes within each node's routing zone through periodic routing table updates. This is usually accomplished using a wide range of traditional distance vector or link-state protocols [5]. All nodes less than or equal to the routing zone radius are considered to be in the zone. These nodes are referred to as interior nodes. Nodes on the edge of the routing zone (those with hop count equal to the zone radius) are considered peripheral nodes and take on greater significance in the next section.
1.1.3 Interzone Routing Protocol (IERP)
1.1.4 Bordercast Resolution Protocol (BRP)
BRP is a subset and the workhorse of IERP. It provides bordercasting, route accumulation, route optimization, and query control. When a node reach a destination outside of the zone, efficiency is increased by bordercasting the query request directly to the peripheral nodes to reach the entire network. BRP uses efficient flooding (multipoint relay) and efficient probing to control unnecessary overhead[8]. It also does proactive route repair and route shortening to improve performance. This reduces the overhead in comparison to simple flooding over the entire network. [image:2.595.57.278.280.452.2]2.
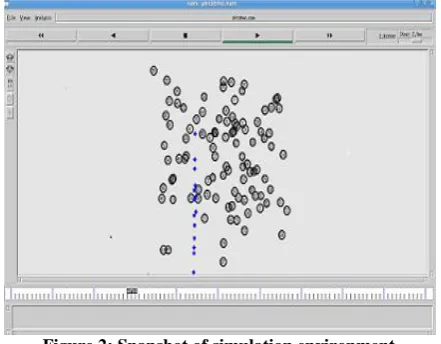
SIMULATION METHODOLOGY
A well known network simulator NS-2.33 is used as a framework to study the performance of ZRP routing protocol.[9] the analysis of Zone Routing Protocol is done on the basis of its authentic parameter Zone Radius. The simulations are done in a specific two scenarios.Figure 2: Snapshot of simulation environment
2.1 Routing Zone Optimization
A mathematical expression for the optimum zone radius for optimum performance has not yet been determined. Even with perfect knowledge of all network parameters, computation of an optimal routing zone radius is not a straightforward mechanism. Haas recommends that further research could focus on a complete derivation of the ZRP traffic function[10].
Optimum Zone Routing Radius
IARP IERP Dominates
IERP IARP
IERP
IARP
As shown in Figure, if IERP traffic is decreasing and the amount of proactive IARP traffic is increasing, there is an "undershoot" of the optimum zone radius. Likewise, if IERP traffic is increasing and IARP traffic is also increasing would indicate an "overshoot" of the optimum zone radius.[11] The traffic adaptive method only relies on current estimates. In other words, the ratio between IERP to IARP (IERP/IARP) should be as close one as possible for optimization[12]. The general rule-of-thumb is that a sparse network favors a large routing zone and a dense network favors a small routing zone.
3.
EXPERIMENTAL SETUP
Scenario 1:
Effect of increasing zone radius on
performance matrices:
The Zone Radius is varied from 1 to 10 by keeping number of nodes constant. The experimental set up for scenario 1 is as depicted in the table:
PROTOCOL ZRP
ENVIRONMENT SIZE 500 X 500
NUMBER OF NODES 50
DATA RATE 16 bits/sec
PACKET SIZE 512 bytes
SIMULATION TIME 150 mins
TRAFFIC TYPE CBR
The effect of Zone Radius on various performance matrices is as shown with the help of graphs.
(a)
Average end to end delay:
From the graph (b), it has been observed that the end to end delay decreases as the Zone Radius increases. This is probably due to increase in Zone Radius leads to increment in proactive component. Therefore, time to send a packet is low.(b)
Average jitter:
It has been observed from the graph that the average jittering having smaller radius is less than as compared to increased zone radius. Zone radius=1 has high average jitter as being reactive in nature, there is more variation in the arrival time of packets. At high zone radius, proactive routing mechanism (IARP) causes greater number of control packets leading to more jittering factor.(c)
Packet delivery ratio:
Packet delivery ratio has the same effect as the average throughput. At lower zone radius, it has the highest packet delivery ratio. As zone radius = 1 means that the transmission is done only on the basis of reactive nature of zone routing protocol, therefore it is not able to take the advantage of proactive routing mechanism for local routing table maintenance.(d)
Normalized routing overhead:
The number of routingpacket is much higher than number of data packets and that cause higher routing load for zone radius =1. It is minimum at the zone radius=2 and as the zone radius increases, routing load also increases. This is probably due to more high chances of link failures at higher zone radius. Therefore, more efforts are needed to build the zone routing tables. Hence, the load increases.
0 20 40 60 80 100 120 140 160 180
1 2 3 4 5 6 7 8 9 10
AV
ERA
G
E
TH
RO
UG
H
PUT
(in
k
b
p
s)
INCREASING RADIUS
AVERAGE THROUGHPUT
ZRP
0 500 1000 1500 2000
1 2 3 4 5 6 7 8 9 10
TIM
E
(in
m
s)
INCREASING RADIUS
AVERAGE END TO END
DELAY
ZRP
0 0.0005 0.001 0.0015 0.002 0.0025
1 2 3 4 5 6 7 8 9 10 INCREASING RADIUS
AVERAGE JITTER
ZRP
0 2 4 6 8
1 2 3 4 5 6 7 8 9 10 INCREASING RADIUS
PACKET DELIVERY RATIO
(e)
Scenario 2: Effect of varying node density by
keeping zone radius constant
Now, number of nodes ranging from 10 to 100 are taken and take some constant values of zone radius like in this scenario, we take values 2,4 and 6. The configuration for this scenario is as follows
:
PROTOCOL ZRP
ENVIRONMENT SIZE 500 X 500
NUMBER OF NODES 10-100
DATA RATE 16 bits/sec
PACKET SIZE 512 bytes
SIMULATION TIME 150 mins
TRAFFIC TYPE CBR
ZONE RADIUS 2,4,6
Average throughput:
The average throughput withsmaller zone radius and at smaller number of nodes increases and then as the number of nodes increases, throughput decreases. The possible reasons are as node density increases, number of zones in the area increases. Due to this number of zones increases, so that reactive traffic of ZRP increases as compared to proactive one and large number of query packet are generated, to share information between zones. The graph shows that ZRP having smaller zone radius give the better throughput as compared to ZRP having higher zone radius in high-density nodes.
Average jitter:
From the graph, we can see that the average jitter having small zone radius is less as compared to large zone radius. As the node density increases, jitter also decreases. This is mainly due to as number of nodes increases, the proactive part increases. Hence, query packet losses are less. Therefore, information with reactive part reduced and packet form the source to destination reach at equal interval.Packet delivery ratio:
Packet delivery ratio isapproximately equal for the increasing zone radius. As node density increases, packet delivery ratio decreases. The possible reasons is mainly due to decrease in throughput at higher node density. The throughput is less therefore the packet delivery ratio. At lower number of nodes, packet delivery ratio is more because of more reactive components than the proactive one leads to the increment in packet delivery ratio.
0 10 20 30 40
1 2 3 4 5 6 7 8 9 10 INCREASING RADIUS
NORMALIZED ROUTING
OVERHEAD
ZRP
0 50 100 150 200 250 300 350
10 30 50 70 90
AV
ERA
G
E
TH
RO
UG
H
PUT
(in
k
b
p
s)
NUMBER OF NODES
AVERAGE THROUGHPUT
ZRP_2
ZRP_4
ZRP_6
0 0.0005 0.001 0.0015 0.002 0.0025 0.003 0.0035 0.004
10 30 50 70 90 NUMBER OF NODES
AVERAGE JITTER
ZRP_2
ZRP_4
Normalized routing overhead:
At some initial number of nodes, routing overhead of lower zone radius is approximately equal to the higher zone radius. But after a reach of 50 number of nodes, routing load of higher zone radius is higher as compared to lower zone radius. The main reason behind that as the node density increases and zone radius increases, the proactive components are more. They need more route packets to maintain their routing table. Hence, it increases the load of the network.Average end to end delay:
The average end to end delayof larger zone radius is less than the smaller zone radius and as the node density increases, delay decreases. The reason for this is as zone radius is smaller, number of zone increases. Due to this reactive traffic increases and time required to share information between zone increases. Therefore, due to all these overall time delay required by the packet to reach the destination form the source increases. On the other hand, ZRP having higher zone radius shows less end-to-end delay as compared to ZRP having smaller zone radius.
4.
CONCLUSION & FUTURE WORK
The results shows that ZRP demonstrated a really low packet delivery ratio and throughput where the mobility is high. As the number of nodes increases, the routing load also increases with the Zone Radius. The Zone radius in order to achieve higher throughput should be kept low in range of 2-4 as the figures depicted above shows the best performance of ZRP at these zone radius. On the other hand, average end to end delay is least at high Zone Radius. But this parameter alone cann’t be taken as a whole criterion for good performance. Average jitter also decreases with the increasing node density. Therefore, ZRP is termed as suitable only for a very large network so the benefits of both proactive and reactive protocols are enjoyed. For future work, the analytical study for Optimum Zone Radius will be done to achieve high throughput. In this literature, the simulations are done at constant pause times and through CBR traffic. For our future work, simulations will be done by varying pause time and through TCP traffic.5.
REFERENCES
[1] Nicklas, Beijar “Zone Routing Protocol (ZRP)” citeseer.nj.nec.com/538611.html.
[2] S. Sathish1, K. Thangavel2 and S. Boopathi “Performance Analysis of DSR, AODV, FSR and ZRP Routing Protocols in MANET”. Second International Conference … - 220.227.128.112 pp 57 - 61.
[3] Haas, Zygmunt J, Pearlman, Marc R., "The Zone Routing Protocol (ZRP) for Ad Hoc Networks," Internet Draft,draft-ietf-manet-zone-zrp-02.txt, (1999).
[4] Haas, Zygmunt, "A New Routing Protocol For The Reconfigurable Wireless Networks," pg 652 - 566, IEEE Journal on Selected Areas in Communications, (1997). [5] Zygmunt J. Haas and Marc R. Pearlman and P. Samar.
“Intrazone Routing Protocol (IARP”, IETF Internet Draft, draft-ietf-manet-iarp- 02.txt, (2002).
[6] Zygmunt J. Haas and Marc R. Pearlman and P. Samar “Interzone Routing Protocol (IERP)” IETF Internet Draft,draft-ietf-manet-ierp- 02.txt,(2002).
[7] Zygmunt J. Haas and Marc R. Pearlman, “ZRP:a hybrid framework for routing in Ad Hoc networks” Addison-Wesley Longman Publishing Co., pp.221—253, (2001). 0
10 20 30 40 50 60 70 80
10 20 30 40 50 60 70 80 90 100
NUMBER OF NODES
PACKET DELIVERY RATIO
ZRP_2
ZRP_4
ZRP_6
0 50 100 150 200 250
10 30 50 70 90
NUMBER OF NODES
NORMALIZED ROUTING
OVERHEAD
ZRP_2
ZRP_4
ZRP_6
0 500 1000 1500 2000 2500
10 30 50 70 90
TIME
(
in
m
s)
NUMBER OF NODES
AVERAGE END TO END DELAY
ZRP_2
ZRP_4
[8] Zygmunt J. Haas, Marc R. Pearlman and Prince Samar, “The Bordercast Resolution Protocol (BRP) for Ad Hoc Networks”. draft-ietf-manet-zone-brp-02.txt,(2002) [9] By Brijesh Patel MAGNeT Group “ZRP Agent for NS2
(NS-2 v2.33) “
[10]Zygmunt J. Haas and Marc R. Pearlman, “Determining the Optimal Configuration for the Zone Routing Protocol”, US Air Force/Rome Labs, under the contract number C-7-2544 and a grant from Motorola Corporation, the Applied Research Laboratory, Wireless Networks Laboratory (WNL), School of Electrical
Engineering, Cornell University, Ithaca, NY 14853-3801, USA.
[11]Mr. Kamaljit I. Lakhtaria Mr. Paresh Patel “Analyzing Zone Routing Protocol in MANET Applying Authentic Parameter” global journal of computer science and technology pg 114 vol. 10 (2010).
[12]Sanku Sinha, Biswaraj Sen “Effect of Varying Node Density and Routing Zone Radius in ZRP: A Simulation [13]Based Approach” /International Journal on Computer