Implementation of Image Registration for Satellite
Images using Mutual Information and Particle Swarm
Optimization Techniques
Heena R. Kher
Assistant Professor, A. D. Patel Institute of Technology, New V. V. Nagar, Gujarat, India
ABSTRACT
The aim of this research is to register satellite images on the DSP processor using probabilistic optimization method named as particle swarm optimization. Satellite image registration is necessary in order to find change detection, to eliminate influence of camera distortion (roll, pitch and yaw), merge satellite imagery and in urban planning. Particle Swarm Optimization is a stochastic search technique with less computation and still very effective as compared to other optimization techniques. It is based on bird flocking, fish schooling and swarm theory. Each particle changes its position and velocity based on its corresponding fitness value. Fitness value can be calculated using joint entropy and mutual information. The algorithm can be used in object recognition, image segmentation, matching and registration. The performance of this algorithm is measured and results are shown using DSK 6713 hardware along with VM32242.
Keywords
Image Registration, Mutual Information, Joint Histogram, Joint Entropy, Particle Swarm Optimization
1.
INTRODUCTION
Image registration is a method of aligning two images. First image is called reference image which is fixed and second image is called sensed image which it to be transformed and then registered over reference image. This basic capability is required in various image analysis applications like satellite images used for remote sensing, medical image processing and analysis and in computer vision. The alignment process will find the correspondence between key points in the two images. Image features are unique image properties that can be used to establish correspondence between the images. The most required features are points, because point’s coordinates can be directly used to determine the parameters of a transformation function that registers the images.
Correlation based methods registered images directly without finding their features. One image was shifted over another and at each shift position the similarity between the two was determined. The shift position producing the highest similarity was chosen to register the images.
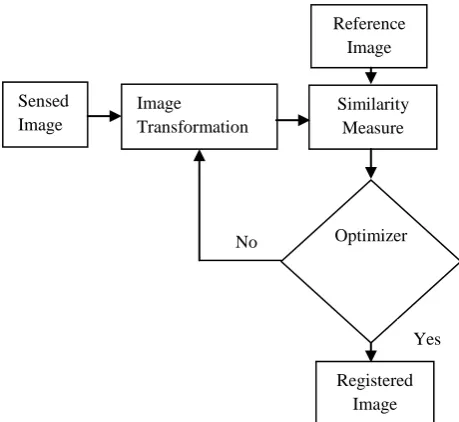
[image:1.595.309.539.199.410.2]To reduce the computation time sub images can be used and to speed up further multi stage and coarse to fine methods can be used. If the given image has non linear geometric differences, as the scale of the images is reduced, making the image more similar, registration accuracy increases. One can find feature points in low resolution image and map that point in next higher resolution and gradually finding more and more confident points. Image registration will require image transformation, similarity measure and optimizer as shown in fig. 1.
Fig. 1 Basic Image Registration block diagram
Image transformation can be applied over sensed image and transformed sensed image is compared with reference image. Mutual information is used as a similarity measure in this case which is fitness function for particle swarm optimization. If mutual information is less than some predefined value then again transformation is applied over sensed image and procedure repeats until maximum number of iteration is completed. So finally sensed image is registered and quality assessment parameters like RMSE, PSNR, CC and SSIM have been computed.
Image matching and registration is an Optimization problem. Finding the maximum of similarity measure or minimum of dissimilarity measure is a multi-dimensional optimization problem. As number of dimension will increase, degree of freedom will decrease. Therefore it is becoming computationally demanding where exhaustive search over the entire image is required.
There are many optimization techniques available like Simulated Annealing, Genetic algorithm, Memetic algorithm, Ant colony optimization, Differential evolution, Powell’s method, Downhill Simplex method, Brent’s method and series of one dimensional searches, Levenberg Marquardt optimization, Newton Raphson iteration, Stochastic search methods, Gradient descent methods, Genetic methods, Fuzzy methods, Geometric hashing, Nelder Mead Optimization, Neural Network based methods, Quasi exhaustive search methods, Particle Swarm Optimization (PSO) and many more. Out of these, PSO is suitable for continuous optimization problem because it is highly non linear, non differentiable and non convex.
Sensed Image
Image Transformation
Similarity Measure Reference Image
Optimizer
Registered Image
2.
PREVIOUS WORK
Viola and Wells [5] suggested mutual information based image alignment. The method is based on mutual information between the two images. In this, entropy of two images, joint entropy and joint histogram is calculated. This is an intensity based method, it works well where edge and gradient based method fail to register and robust than correlation based method.
Chen et al. [7] proposed medical image registration for multi modal images (CT – MR Brain images) using generalized partial volume estimation (GPVE) technique. Their experimental results show that by properly choosing the kernel functions, the GPVE algorithm significantly reduces the interpolation induced artifacts and thus improving the registration accuracy.
Berthilsson [9] tried to register using cross correlation which is more global search method compared to others like steepest descent based methods. Algorithm is based on certain changes of coordinates in the image and Fast Fourier Transform that makes it faster.
Wolberg and Zokai [14] suggested hierarchical image registration where the affine parameters are computed iteratively using a variation of the Levenberg – Marquadt nonlinear least squares optimization method. In this paper, they are using Sum of Squared Difference (SSD) similarity measure for iterative estimation of perspective deformation. Every time, SSD value is compared with threshold, if SSD is higher than threshold then it is rejected and when SSD is minimum will be the best match. This method is less accurate than NCC but it is faster.
Huttenlocher et al. [15] described new method of similarity measure called Hausdorff Distance (HD). They registered binary images transformed by rotation and translation and compared HD based method with classical CC based method and proved that HD is better than CC.
Mutual information (MI) based image registration can be done for multimodal images. MI which is originating from information theory is a measure of statistical dependency between two data sets. Ritter et al. [16] proposed hierarchical search strategy along with simulated annealing to find maximum mutual information.
Meisen Pan [17] suggested fuzzy based image registration in which Fuzzy C- Means (FCM) clustering is used and divided the coordinates of the pixels in the image into two clusters to fit a straight line, and then derived the slope of the line to compute the rotation angle of the image. Fuzzy method provides good result for mono modal and multi modal (with different sensors) images.
J. Senthilnath [20] suggested multi objective function for fitness calculation. They have used distance condition and angle condition both because only distance condition cannot be effective for multi sensor images. These two conditions give better matching of the corner points between the two images. A set of three points between reference image and sensed image is required in the algorithm. In the past, RANSAC is used to match the points. Based on the results obtained to them, their algorithm is more efficient for multi sensor image registration. Registration accuracy is measured in terms of root mean square error.
Chen Lun Lin [22] described Hybrid particle swarm optimization (HPSO) for medical image registration. HPSO includes two important concept subpopulation and crossover
of genetic algorithm and conventional PSO and also provide comparison between HPSO, Genetic algorithm and conventional PSO.
Yong Fang Guo [24] introduced improved PSO for image matching and proved that this method is a simple but effective and reduces computation time. In [25], Yong Fang Guo have modified the method and calculated another objective function using distance transform and PSO and shown that it will again reduce time complexity of the algorithm.
Object detection can also be done using particle swarm optimization proved by Ankit Sharma in [28]. They have determined cross correlation coefficient between the images and applied PSO. Applications are in navigation, guidance, automatic surveillance and robot vision.
Finding point correspondence using Simulated Annealing (SA) explained by Starink and Baker [31] that tries to minimize a dissimilarity measure defined on point pairs. SA is a stochastic optimization algorithm based on the physical analogy of annealing a system of molecules to its ground state.
Thevenaz et al. [32] explained iterative multi scale registration without landmarks in which they have combine Levenberg Marquardt method and sum of squared differences metric. They present an automatic sub pixel registration algorithm which minimizes the mean square difference of intensities between a reference image and sensed image. It uses coarse to fine pyramid strategy and performs minimization using Levenberg Marquardt method. They have used several images from PET and fMRI modalities and concluded that multi resolution refinement strategy is faster and more robust than single scale methods.
We had taken satellite images in which preprocessing is already done otherwise we have to do radiometric correction on raw images which include LUT corrections, stagger correction, correction for block and line losses etc. Some users also expect geometric corrections also to be done on these images. Challenges to register satellite images are mainly because they are linear arrays of CCDs; many such lines together form an image. (The normal images are taken from frame cameras). Here every linear array image is a frame and you can look forth for variations in camera orientations
between every such frames of linear array giving rise to internal distortion within the image. A corrected satellite image can be free of such distortions.
3.
PARTICLE SWARM
OPTIMIZATION
There are many methods available for optimization problem. Methods are either deterministic or probabilistic in nature. Deterministic method gives exact solutions and do not use any random technique and rely on the thorough search of the feasible domain. But the disadvantages of deterministic method is it is not robust and can only be applied to restricted class of problems and Often too time consuming or sometimes unable to solve real world problems. Particle Swarm Optimization is an iterative, learning based method introduced by James Kennedy and Eberhart in 1995.
updated and a new velocity is calculated in each iteration. Find the best position of the particle and generates social groups, where each particle has different logical neighbors. Each particle will remember its best value and X and Y coordinate of it.
For each iterative process, the particle can update its position (xi
k
), velocity (vi k
) and moving based on the particle best (pbest) and global best (gbest) as following.
Where k is the current iteration, c1 and c2 are two positive constants, r1, r2 and r3 are random number in the range [0, 1]. is inertia that will control the influence by the former moving velocity. is greater, then global searching performance is better while smaller would bring better local search.
4.
IMAGE SIMILARITY USING
MUTUAL INFORMATION
Fitness function can be calculated using the following equations of mutual information between reference and sensed image and maximum value indicate best match.
Mutual Information (MI) has emerged in recent years as a very effective measure of image comparison. It is intensity based method so it takes into account spatial relationship between pixels.
4.1 Entropy
Entropy is a measure of information. Any image is basically matrix which consists of various intensity values which are random in nature. Shannon entropy probability distribution function is defined by the following equation.
Entropy measures the uncertainty inherent in the distribution of a random variable.
4.2 Joint Entropy
MI is intensity based similarity measure and is closely related with joint entropy of two images which can be calculated from the following equation.
Joint entropy and conditional entropy are simple extensions that measure the uncertainty in the joint distribution of a pair of random variables, and the uncertainty in the conditional distribution of a pair of random variables. Images are registered when one is transformed relative to the other to minimize the joint entropy.
4.3 Joint Histogram
Individual entropies can be easily calculated from Joint histogram. A joint histogram is a multidimensional histogram created from a set of local pixel features. An entry in a joint histogram counts the number of pixels in the image that are described by a particular combination of feature values. Each entry is the number of times intensity in one image corresponds to an intensity b in the other. Row number is
intensity of image 1, i.e. 1st row is the occurrence of intensity 1 in image 1. Column number is intensity of image 2, i.e 1st column is the occurrence of intensity 1 in image 2.
Usually a discrete joint histogram is considered to estimate the joint PDF for the calculation of MI. attempting to compute the overlapping regions; we should maximize the individual entropies and minimize the joint entropy. An image of single amplitude has a less disperse histogram than an image of many grey scales and the lower dispersion implies lower entropy.
4.4 Mutual Information
Mutual information between two images is calculated from individual entropy and Joint entropy as follows.
Advantage in using mutual information over joint entropy is it includes the individual entropy. Maximizing the mutual info is equivalent to minimizing the joint entropy. After registration joint entropy increases as matching is achieved so the correspondence of pixel to pixel increases, which in terms increase the mutual information.
5.
HARDWARE USED
Digital signal processing is now become core in most of the rapidly growing technologies like signal and image processing and in wireless communication. These processors are having capabilities of representing real time analog signals in digital form with fast processing speed. The TMS 320C67X series is a 32 bit floating point processor having implemented VLIW architecture. It requires one computer to create the program, embedded JTAG to load the program from computer to C6713, an AIC23 stereo codec, 4 user accessible LEDs and DIP switches, power supply, 32 bit external memory interface and VM3224K2 display card. The on board power supply provides two voltages, 1.26 V for DSP core and 3.3 V for I/O ports. DSK 6713 operates on 225 MHz. Synchronous dynamic RAM is of 16 MB and Flash of 512 KB [34].
Code composer studio (CCS) provides an IDE to incorporate the software tools. CCS includes tool for code generation (C compiler), debugging tool, assembler and linker. The C compiler will compile the C code with extension .c and generating .asm assembly file. The assembler converts .asm file into machine language object file .obj. the linker links and combines object and library files and generates .out file which can be loaded using CCS into C6713 and run on C6713. The CCS has Graphical User Interface (GUI) using which we can view Time/ Frequency graph, Eye diagram, Constellation diagram and Images.
The DSP VM3224K2 is a TFT LCD video daughter card which support NTSC analog video signal and displays digital video data on TFT LCD display. It used NTSC up to 30 fps as a input and gives output in the form of RGB565 format. The resolution for video / image output is 320 X 240 with 16 bits per pixel. It uses power from DSP board so no additional power is required. This product is a plug in for the Texas instruments C67X starter kit.
image. So extra 2 bytes are saved and thus saved time too. In this system 5 bits for red, 6 bits for green and 5 bits for blue color. Human eye is more sensitive to green color so extra 1 bit is added to green component.
Fig. 2 Structure of the TFT LCD Display Unit [33]
The Thin Film Transistor (TFT) LCD uses an RGB565 format and having 320x240 in size. The LCD panel should given pixel information periodically. So VM3224K2 module contains memory which will store 320 X 240 pixel information. LCD controller provides 512 KB DRAM memory data to the LCD panel in synchronization with the horizontal and vertical sync signals. 512 KB DRAM is divided into two parts: 256 KB size in two pages. One part is for display buffer and other is used by DSP. The LCD controller generates signals to drive the LCD, and the 17-bit address generator generates pixel data addresses directed to the LCD.
Pixel locations in TFT-LCD display are shown in fig. 3. The first number in parenthesis represents the horizontal coordinate on the LCD panel, while the second represents the vertical coordinate.
(0,0) (1,0) … (318,0) (319,0)
(0,1) (1,1) … (318,1) (319,1)
… … … … …
(0,238) (1,238) … (318,238) (319,238)
(0,239) (1,239) … (318,239) (319,239)
Fig 3 Pixel Locations for the Landscape Panel [33]
6.
QUALITY ASSESSMENT
PARAMETERS
6.1 Root Mean Square Error
It is measure of estimator which suggests the accuracy of registration with respect to reference image. It should be near to zero for best match.
6.2 Peak Signal to Noise Ratio
It is a ratio of maximum possible power of signal to power of corrupting noise that affects the fidelity of representation. Its
range is wide so it is expressed as logarithmic scale. Maximum value of PSNR indicates good match between the two images.
6.3 Cross Correlation
Range of cross correlation is between -1 to +1. Minimum value indicates the dissimilarity between the images. For maximum matching, its value is 1.
6.4 Structural Similarity Index Matrix
It is a method for comparing the two images using similarity criterion. It is a quality measure of one of the image being compared with another image having perfect quality. It is an improved version of the universal image quality index (UIQI). The mean SSIM is one when two images are same. The difference with RMSE and PSNR is that these approaches estimate perceived errors. Conversely, SSIM considers image degradation as perceived change in structural data which is having strong inter- dependencies (important information about the structure of the object) specifically when they are spatially close.
To compute above quality parameters, the size of two images must be same. x(i,j) is the reference image, y(i,j) is the sensed image, n is the number of bits per pixel, so (2^n -1) represents maximum gray value, and are the mean values for reference and sensed image respectively, and are the variance of x and y images, is the covariance of x and y, M and N are the height and width of the image. C1 and C2 are the constants.
(10)
Where k1= 0.01 and k2 = 0.03 (default) and L = (2^n -1)
7.
ALGORITHM
We have used the following algorithm.
1. The first step is to read two satellite images – one reference image and another sensed image using DSK 6713. To read the images we have to convert them into .dat file format using MATLAB.
2. Open code composer studio 3.1 and connect DSP 6713 kit and then create new project using .pjt extension.
3. Open editor window and write C code. Create population of agents called particles which is uniformly distributed and save the details of the particles into two swarm matrixes (one for x and other for y coordinate) which include initial position of the particles, velocity of each particles, updated position, and fitness values / objective function.
4. If current position of particle is better than previous one then update it and also update its velocity using equation (1) and (2).
5. Calculate fitness value (using equation (5)) and place it at the fourth column and evaluate particle best (pbest) and global best (gbest).
512 Kbytes DRAM
17 bit word Address generator
TFT LCD Panel
24.576
MHz Clock LCD Controller Pixel Clock
V Sync
6. Repeat the procedure until stopping criterion is satisfied.
7. Save the program using .c extension and then add in the current project and build the program. Then load the .out file and run the program.
8.
RESULT AND DISCUSSION
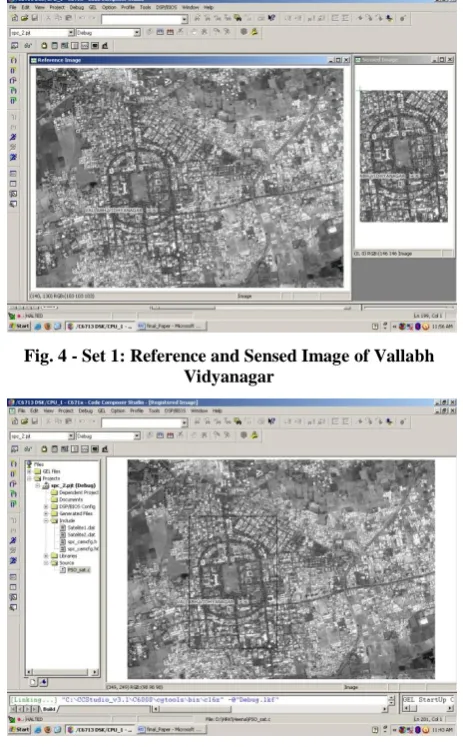
[image:5.595.317.543.73.240.2]The images we have used are taken from Bhuvan website – a Geoportal of ISRO. First set of image is of Vallabh Vidyanagar and we are trying to register Shastri medan area. Second set of image is of New Valllabh Vidyanagar and we had registered academic institutions of CVM including A. D. Patel Institute of Technology.
[image:5.595.55.283.207.374.2]Fig. 4 - Set 1: Reference and Sensed Image of Vallabh Vidyanagar
[image:5.595.52.284.210.584.2]Fig. 5 Registered Image
Fig. 6 - Set 2: Reference and Sensed Image of New Vallabh Vidyanagar
Fig. 7 Registered Image
[image:5.595.317.543.253.457.2]Initially particles are given random values and coordinates of each particle are stored in swarm matrix. For each iteration, fitness function is calculated and accordingly particle’s position and velocity is updated. This procedure is repeated until stopping criterion is satisfied. Then RMSE, PSNR, CC and SSIM are calculated using equations (6 -10).
Fig. 8 Set up of image Registration using DSP hardware
[image:5.595.317.539.532.700.2]Table 1 Ten fold validation result of set 1
Entropy of sensed image H(B): 6.9584 Entropy of reference image: 26.9634 No. of
Itera-tion
Entropy H(A)
Joint Entropy
H(A,B)
Mutual Inform-ation (MI)
X Value
Y Value
RMSE PSNR CC SSIM
1. 6.9981 13.2979 1.0495 201 125 65.9734 27.0402 0.0074 0.0362
2. 6.9812 13.2849 1.0493 158 118 66.37 26.9204 -0.0031 0.0288
3. 6.8926 13.2057 1.0489 12 70 64.677 27.4372 -0.0197 0.0303
4. 6.9628 13.2725 1.0489 201 188 65.7641 27.1038 0.0145 0.0256
5. 7.0033 13.3002 1.0497 201 86 65.4868 27.1883 0.0055 0.0310
6. 7.0089 13.3082 1.0495 201 100 65.6392 27.1418 -0.0006 0.0190
7. 6.9586 13.2637 1.0492 201 38 64.3596 27.5356 0.0014 0.0413
8. 6.9728 13.2745 1.0495 170 136 65.4552 27.1980 0.0266 0.0311
9. 6.96 13.2580 1.0498 147 140 65.666 27.1336 0.0215 0.0395
[image:6.595.55.556.296.687.2]10. 6.9578 13.2208 1.0526 140 128 48.2687 33.2896 0.4687 0.2300
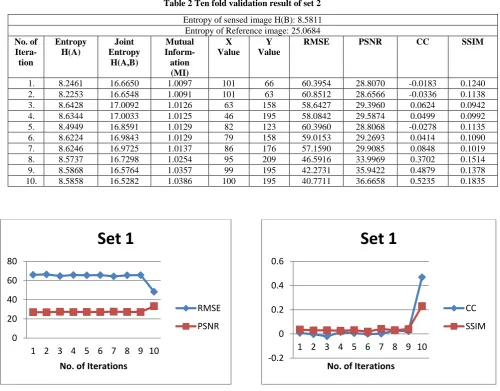
Table 2 Ten fold validation result of set 2
Entropy of sensed image H(B): 8.5811 Entropy of Reference image: 25.0684 No. of
Itera-tion
Entropy H(A)
Joint Entropy
H(A,B)
Mutual Inform-ation (MI)
X Value
Y Value
RMSE PSNR CC SSIM
1. 8.2461 16.6650 1.0097 101 66 60.3954 28.8070 -0.0183 0.1240
2. 8.2253 16.6548 1.0091 101 63 60.8512 28.6566 -0.0336 0.1138
3. 8.6428 17.0092 1.0126 63 158 58.6427 29.3960 0.0624 0.0942
4. 8.6344 17.0033 1.0125 46 195 58.0842 29.5874 0.0499 0.0992
5. 8.4949 16.8591 1.0129 82 123 60.3960 28.8068 -0.0278 0.1135
6. 8.6224 16.9843 1.0129 79 158 59.0153 29.2693 0.0414 0.1090
7. 8.6246 16.9725 1.0137 86 176 57.1590 29.9085 0.0848 0.1019
8. 8.5737 16.7298 1.0254 95 209 46.5916 33.9969 0.3702 0.1514
9. 8.5868 16.5764 1.0357 99 195 42.2731 35.9422 0.4879 0.1378
10. 8.5858 16.5282 1.0386 100 195 40.7711 36.6658 0.5235 0.1835
0 20 40 60 80
1 2 3 4 5 6 7 8 9 10
No. of Iterations
Set 1
RMSE
PSNR
-0.2 0 0.2 0.4 0.6
1 2 3 4 5 6 7 8 9 10
No. of Iterations
Set 1
CC
9.
CONCLUSION
In this paper, Particle swarm optimization based satellite image registration is done. This method is iterative learning based method where particles will remember its position and depending on fitness function value, algorithm will update particle’s position and velocity. To calculate accuracy of this registration, we have compute quality assessment parameters. The algorithm will be ended when error becomes zero or minimum. Ten fold validation method is used to check the performance of PSO in which the process is repeated for 10 times and parameters are measured. Moreover, the parameters like number of particles, inertia, positive coefficients, number of iterations, size of two images and fitness function will affect the registration time and registration result.
10.
ACKNOWLEDGMENTS
The Authors would like to thank Principal, Management of A. D. Patel Institute of Technology and Charutar Vidya Mandal for carrying out the work in the laboratory of Electronics and Communication Engineering Department. Authors also express sincere thanks to Dr. V. S. Patel, Director SICART for his suggestions, evaluation and encouragement during our work. We had used satellite images from the website of Bhuvan – a gateway to Indian earth observation. A Geoportal of ISRO which provide platform for rendering of Multi-sensor, Multi-resolution and Multi-temporal imagery providing satellite data and products for download.
11.
REFERENCES
[1] Josien P. W. Pluim, J. B. Antoine Maintz and Max A. Viergever, “Mutual information based registration of medical images: A survey”, IEEE transaction on medical imaging, pp. 1 – 16, 2003.
[2] Jiarui Lin, Zhiyong Gao, Bangquan Xu, Yangxiezi Cao, Zhan yingjian, “The affection of grey levels on mutual information based medical image registration”, 26th annual international conference of the IEEE EMBS San Francisco, CA, USA, pp. 1747 – 1750, 1 -5 September, 2004.
[3] Li Junli, CONG Rijuan, Jin Linpeng, Wei Ping, “A medical image registration method based on weighted mutual information”, 2nd
International Conference on Bioinformatics and biomedical engineering, Shangai, pp. 2549 – 2552, 16 – 18 May, 2008.
[4] Anrong Yang, Caixing Lin, Cheng wang and Hongqiang Li, “An improved medical image registration framework based on mutual information”, Global Congress on Intelligent systems, pp. 588 – 592.
[5] Paul Viola and William M. Wells III, “Alignment by Maximization of Mutual Information”, International Journal of Computer Vision, Vol 24 issue 2, pp. 137– 154, 1997.
[6] Josien P. W. Pluim, J. B. Antoine Maintz and Max A. Viergever, “Mutual information based registration of medical images: a survey”, IEEE Transactions on Medical Imaging, pp. 1- 21, 2003.
[7] Hua-Mei Chen, Pramod K. Varshney, and Manoj K. Arora, “Performance of Mutual Information Similarity Measure for Registration of Multi temporal Remote Sensing Images”, IEEE Transactions on Geo science And Remote Sensing, Vol 41, No. 11, pp. 2445-2454, November 2003.
[8] Hua-mei Chen and Pramod K. Varshney, “Mutual Information-Based CT-MR Brain Image Registration Using Generalized Partial Volume Joint Histogram Estimation”, IEEE Transactions on Medical Imaging, Vol. 22, No. 9, pp. 1111- 1119, September 2003.
[9] R. Berthilsson, “Affine correlation” 14th International Conference on Pattern Recognition ICPR’98, Brisbane, Australia, pp. 1458–1461, 16 – 18 August, 1998.
[10] F. Maes, A. Collignon, D. Vandermeulen, G. Marchal, P. Suetens, “Multimodality image registration by maximization of mutual information”, IEEE Transactions on Medical Imaging Vol. 16, pp. 187– 198, 1997.
[11] J.P.W. Pluim, J.B.A. Maintz, M.A. Viergever, “Mutual information matching in multiresolution contexts”, Image and Vision Computing, Vol.19, pp. 45–52, 2001. [12] A. Rangarajan, H. Chui, J.S. Duncan, “Rigid point feature registration using mutual information”, Medical Image Analysis, Vol.4 pp. 1–17, 1999.
[13] D. Rueckert, C. Hayes, C. Studholme, P. Summers, M. Leach, D.J. Hawkes, “Non-rigid registration of breast MR images using mutual information”, Proceedings of the Medical Image Computing and Computer-Assisted Intervention MICCAI’98, Cambridge, Massachusetts, pp. 1144–1152, 1998.
[14] George Wolberg, Siavash Zokai, “Image Registration For Perspective Deformation Recovery”, Proc. SPIE, Automatic Target Recognition, Orlando, FL, pp. 1-12, April 2000.
0 20 40 60 80
1 2 3 4 5 6 7 8 9 10
No. of Iterations
Set 2
RMSE
PSNR
-0.2 0 0.2 0.4 0.6
1 2 3 4 5 6 7 8 9 10
No. of Iterations
Set 2
CC
[15] D.P. Huttenlocher, G.A. Klanderman, W.J. Rucklidge, “Comparing images using the Hausdorff distance”, IEEE Transactions on Pattern Analysis and Machine Intelligence, Vol.15, pp. 850–863, 1993.
[16] N. Ritter, R. Owens, J. Cooper, R.H. Eikelboom, P.P. van Saarloos, “Registration of stereo and temporal images of the retina”, IEEE Transactions on Medical Imaging, Vol. 18, pp. 404–418, 1999.
[17] Meisen Pan, Jingtian Tang, Qi Xiong,“ Medical image registration using fuzzy theory”, Computer methods in biomechanics and biomedical engineering, Taylor & Francis, pp. 721- 734, March 2011.
[18] Jemes Kennedy, Russell Eberhart, “Particle Swarm Optimization”, Purdue School of Engineering and Technology, Washington, pp. 1942 – 1948, 1995
[19] S. Chernyavskiy, “A Robust Scheme of Model Parameters Estimation Based on the Particle Swarm Method in the Image Matching Problem”, Pattern Recognition and Image Processing, Journal of Computer and Systems Sciences International, Vol. 47, No. 5, pp. 764–777, 2008.
[20] J. Senthilnath, S.N.Omkar, V.Mani, and T. Karthikeyan, “Multi objective Discrete Particle Swarm Optimization for Multi sensor Image Alignment”, IEEE Geo science and Remote Sensing Letters, VOL. 10, NO. 5, pp. 1095- 1099, September 2013.
[21] Yen-Wei Chen, Chen-Lun Lin and Aya Mimori, “Multimodal Medical Image Registration Using Particle Swarm Optimization”, Eighth International Conference on Intelligent Systems Design and Applications, pp. 127 – 131, 2008.
[22] Chen-Lun Lin, Aya Mimori, and Yen-Wei Chen, “Hybrid Particle Swarm Optimization and Its Application to Multimodal 3D Medical Image Registration”, Hindawi Publishing Corporation Computational Intelligence and Neuroscience, pp. 1 – 7, 2012.
[23] Lukasz A Machowski, Tshilidzi Marwala, “Evolutionary Optimization Methods for Template Based Image Registration”, School of Electrical and Information Engineering University of Witwatersrand, Johannesburg, South Africa, pp. 1-6, 2007.
[24] Yong Fang Guo, Yi Cai Sun, “Image matching based on improved Particle Swarm Optimization”, International Conference on Electronics,
Communication and Controls, Ningbo, pp. 862-865, 9-11 September, 209-11.
[25] Guo Yong fang, Huang Kai, “Efficient Image Matching Algorithm Using Distance Transform and Particle Swarm Optimization”, Advanced Materials Research, pp 753-757, 2012.
[26] Xiaoxiang Liu, Weigang Jiang, Jianwen Xie, Yitian Jia, “An Image Template Matching Method Using Particle Swarm Optimization”, Second Asia-Pacific Conference on Computational Intelligence and Industrial Applications, pp. 83-86, 2009.
[27] Peng-Yeng Yin, “Particle swarm optimization for point pattern matching”, Journal of Visual Communication and Image Representation, Vol 17, issue 1, pp: 143– 162, February 2006.
[28] Ankit Sharma, N. Singh, “Object Detection in Image Using Particle Swarm Optimization”, International Journal of Engineering and Technology Vol.2 (6), pp. 419-426, 2010.
[29] Yongming Li, Han Lai, Liuyi Lu, Yiwen Gao, Pin Wang, “Dynamic Brain Magnetic Resonance Image Registration based on Inheritance Idea and PSO”, 4th International Conference on Biomedical Engineering and Informatics (BMEI), pp. 263 – 267, 2011.
[30] Mark P. Wachowiak, and Terry M. Peters, “High-Performance Medical Image Registration Using New Optimization Techniques” IEEE Transactions on Information Technology in Biomedicine, Vol. 10, No. 2, pp. 344-353, April 2006.
[31] J.P.P. Starink, E. Baker, “Finding point correspondence using simulated annealing”, Pattern Recognition, Vol. 28, pp. 231–240, 1995.
[32] P. Thevenaz, U.E. Ruttimann, M. Unser, “Iterative multi scale registration without landmarks”, Proceedings of the IEEE International Conference on Image Processing ICIP’ 95, Washington DC, pp. 228– 231, 1995.
[33] DSP STAR TFT LCD Video Daughtercard User’s Manual, Copyright © 2009 www.nd-tech.com, Pages: 1- 14.
[34] TMS320C6713 DSK Module Technical Reference, November 2003.
![Fig. 2 Structure of the TFT LCD Display Unit [33]](https://thumb-us.123doks.com/thumbv2/123dok_us/8038731.770851/4.595.50.286.120.253/fig-structure-tft-lcd-display-unit.webp)