Munich Personal RePEc Archive
India’s specialisation in IT exports:
Offshoring can’t defy gravity
Meyer, Thomas
Deutsche Bank Research
15 November 2007
Online at
https://mpra.ub.uni-muenchen.de/5780/
Editor Stefan Heng
Advisory Committee Dr. Peter Cornelius AlpInvest Partners Prof. Soumitra Dutta INSEAD
Prof. Michael Frenkel WHU Koblenz
Prof. Helmut Reisen OECD Development Centre Prof. Norbert Walter Deutsche Bank Research
Deutsche Bank Research Frankfurt am Main Germany
Internet:www.dbresearch.com E-mail:[email protected] Fax:+49 69 910-31877 Managing Director Norbert Walter
November 15, 2007
Around 16% of India’s total exports are IT services and IT-based business services (average 2000-2003). This level of export specialisation is unrivalled by any comparable country and it is an indicator of a strong comparative advantage. This is surprising because exports of IT services are typically the premise of rich and technology-savvy countries. An educated workforce – which is abundant in rich countries but scarce in poor countries such as India – is the key resource.
! " # "
Offshoring offers a route for poor countries to expand their share of skill-intensive exports. This boosts India’s export specialisation beyond the level that is predicted by its stage of development. However, the IT boom has also crowded out exports of other high-tech products, such as manufacturing.
$ " ! " As countries climb up the
development ladder the very foundation of the offshoring model – namely low wages – erodes. The specialisation in skill-intensive exports may actually decline in the course of development until – at some point – it picks up again.
% " ! &In one projection (see
chart), India’s export specialisation in skill-intensive products will be greatest by the year 2010 and regain this level only when GDP per capita will have reached USD 20,000 (c. 2100).
Thomas Meyer([email protected])
India's specialisation in IT exports
$
'
!
!
0 5 10 15 20 25 30 352004 2014 2024 2034 2044 2054 2064 2074 2084 2094 2104 2114
' " !
Extrapolation of India's export specialisation in IT and high-tech, %
Offshoring model
Trade model Average of offshoring and trade India's current export specialisation
India’s specialisation in IT exports
Offshoring can’t defy gravity
By Thomas Meyer*
1. Introduction
The success of India’s IT industry is iconic. It is the perfect illustration of India’s
accelerating growth rates and has been a constant source of pride and confidence to
the Indians. Indian programmers, software developers, IT consultants and providers
of other business services are held in high acclaim worldwide.
According to estimates by the Indian National Association of Software and Service
Companies (NASSCOM), a business association, the Indian IT sector – including IT
services, IT-based business services and IT-related R&D – generated revenues of
around $29.5bn in 2006. It employs around 1.3m people and grew at a rate of over
30% p.a. over the last few years (NASSCOM, 2007). As a consequence, the IT
industry contributed around 0.5 to 1 pp to economic growth in India.
Exports are the primary sales channel for Indian IT services. Exports generated
around 79% of software and services revenues in 2006 (NASSCOM, 2007). These
exports are chiefly generated through IT offshoring, a business model where western
companies relocate part of their IT services and the related IT-based business
services (henceforth lumped together as IT services unless stated otherwise) to
low-wage countries.
The degree of export specialisation is a commonly used indicator of a revealed
comparative advantage (Balassa, 1965). By this account, India is one of the
strongest contenders: Around 16% of all Indian exports are IT services. Only Israel
and Cyprus have a stronger IT-services specialisation. The United States’ export
share is just 6%.
What is unusual about this picture is that IT services are typically skill-intensive work:
IT offshoring typically covers tasks in programming, software development, data
processing, or customer services which draw on qualified personnel (see for instance
Rajan, 2006). Most IT services need employees with an advanced education, fluency
in English and probably a college degree. However, skilled workers are abundant in
the US but scarce in India. In view of the resource endowment, one would expect the
country’s export specialisation being just the other way round.
The emergence of India as an offshore hub has sparked substantial excitement in the
scholarly literature as well as in the political arena – in particular during the 2004 presidential elections in the US. The perceived loss of qualified IT jobs to offshore
destinations has caused many to believe that the educated middle class in
industrialised countries stands to lose from trade this time. Protectionist rhetoric has
gained new traction. And IT may only be the beginning. Alan Blinder, for instance,
reckons that between 22% and 29% of all US-American jobs are “offshoreable” in
principle – i.e. they can be performed from a distance (Blinder, 2007). If offshore
countries were to excel also in the production of a broad array of skill-intensive goods
and services at the presently low wages, the very foundations of today’s rich
economies may be threatened and wages of the educated middle class may erode.
This paper looks at the economic fundamentals that may explain India’s export
specialisation. To this end, it examines cross-country evidence for a sample of 91
countries. It employs a simple empirical model which relates the extent of export
specialisation in IT services and other high-technology products to a list of
fundamental characteristics, such as the level of economic development and the
supply of skilled workers. Despite its parsimonious setting, this model explains
between 25% and 45% of the variation in the sample. A number of observations can
be taken from this exercise:
1. The level of development is a driving force behind the export specialisation
in IT services and other skill-intensive work such as high-tech
manufacturing. Skill-intensive exports are basically the premise of rich
2. Offshoring offers a route for poor countries to expand their share of
skill-intensive exports beyond the level traditionally predicted by their stage of
development. The necessary ingredients are a (relatively) well qualified
workforce at low wages and the ability to communicate effectively with
international clients – preferably in English.
3. India owes its export specialisation in IT services in part to its reliance on
offshoring but also to a shift away from high-tech manufacturing exports –
which are lower than expected.
4. Offshoring is a somewhat temporary phenomenon. As countries climb up
the development ladder the very foundation of the offshoring model – namely low wages – erodes. The specialisation in skill-intensive exports
may actually decline in the course of development until – at some point – it
picks up again.
5. India’s specialisation may be close to its peak: By one projection, India’s
export specialisation in skill-intensive products will be greatest by the year
2010 and regain this level only when GDP per capita will have reached
$20,000 (c. 2100).
As it appears, offshoring cannot defy the shackles of economic fundamentals. Whilst
there is legitimate concern in some industrialised countries that offshoring might cost
jobs and prosperity, there is little evidence that poor countries could take over
production of skill-intensive products on a large scale. Doing so would require a
similar level of development. But then they would not be poor, low-wage countries
anymore.
2. Offshoring: A new form of trade?
The fragmentation of production processes across borders is not an entirely new
phenomenon. But advances in information and communication technology have
accelerated this trend and enabled inroads into the services sector, which was mostly
exempt from fragmentation in the past. The rise of the Indian IT offshoring industry
Whether offshoring has different implications than traditional trade is debated in the
literature. Some authors discuss offshoring firmly based on the traditional trade
literature (e.g. Bhagwati, 2004; Mankiw and Swagel; 2005, Meyer, 2007). Others see unique features that may or may not have different results from what traditional trade
theory would say (see for instance Jones and Kierzkowski, 2000, Baldwin and
Robert-Nicoud, 2007). Grossman and Rossi-Hansberg (2006b), for example, present
a model of trade in tasks in which all domestic factors of production may gain from
trade – as opposed to the classical Stolper-Samuelson result – because trade in
tasks may effectively boost the productivity of the factor whose tasks become easier
to move offshore.
By and large, the export specialisation in skill-intensive goods and services follows
the resource endowment and thus confirms the general notion of traditional trade
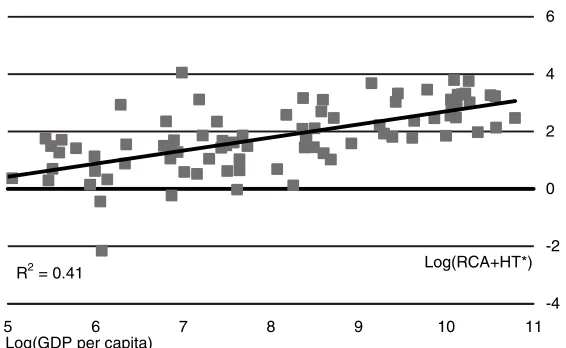
models à la Heckscher-Ohlin. As illustrated in figure 1, around 40% of the variation in
the specialisation in skill-intensive exports can be explained by variations in GDP per
capita. Rich countries have the necessary resources: an educated workforce,
capable infrastructure, good institutions, and a high level of technology, in particular.
Yet, the Indian experience and the empirical analyses of sections 3 and 4 suggest
that there is also room for poorer countries to engage in skill-intensive exports.
A simple way to distinguish offshoring from traditional trade is to look at the
technology used in production. Western firms which relocate certain tasks of their
R2= 0.41
-4 -2 0 2 4 6
5 6 7 8 9 10 11
Log(GDP per capita)
Log(RCA+HT*) Income [Log(GDP per capita)] vs high-skill specialisation [Log(RCA+HT*)]
RCA: Exports of computer & information services and other business services in % of total exports HT: Exports of high-technology manufacturing products, % of total exports
[image:6.595.146.429.75.249.2]production chain to low-wage countries may continue to use their own, more
advanced technology in the offshore country. By paying the local wage (and local
overheads) but using the advanced technology of their home country, relocating firms
can pocket the difference between the workers’ marginal product and labour costs.
Offshoring typically entails additional transaction and communication costs, if only
because a remote production facility has to be managed from a distance, and these
costs have to be deducted from this difference. Obviously, offshoring only pays when
lower wages outweigh the additional transaction and communication costs (see
Baldwin and Robert-Nicoud, 2007).
This form of technology transfer may explain why some poor countries excel in
high-skilled exports although their resource endowment suggests otherwise. Offshore
facilities offer attractive employment opportunities for educated people and typically
produce skill-intensive intermediate goods or service tasks to parent firms in rich
countries.
Baldwin and Robert-Nicoud (2007) call this “shadow migration” because offshoring
has the same effect as if workers from poor countries were to work in rich countries’
facilities at their home countries’ wages. But that may be an exaggeration. Firms can
only transfer firm-specific technology such as machines, work routines or
management techniques but not broader, country-specific amenities such as good
institutions or social capital. This limits the extent to which skill-intensive production
can spread in poor countries. In fact, the differences in country-specific technology
are an important reason for the wage differences and thus necessary to make the
offshoring model possible in the first place.
3. How special is India’s IT specialisation?
India’s prominence as an offshore production hub for IT services is well visible: On
average between 2000 and 2003, around 16% of India’s total exports were computer
and information services and other business services. Both balance-of-payments positions are being used frequently in the literature to describe the business of
processing, hardware consultancy, software implementation but also news-related
services. With the exception of the latter, most of these components appear to be a
fair representation of IT services. Other business services is a residual category
which covers those business services that are not allocated to other categories.
While many IT-based business services that are commonly considered to be part of
offshoring are included here, such as call-centre operations and other back-office
tasks, there are also potentially many services outside the realms of IT-based
offshoring included here. Hence, a high figure for other business services may
overstate the actual amount of IT-based business processes. Still, both
balance-of-payments positions include valuable information on the respective industry and should therefore be included in the analysis.
0 5 10 15 20 25
Sudan Russia China Japan Germany United States Finland Egypt Ireland India Israel Cyprus
Share of exports of computer and information services and other business services in a country's total exports, average 2000-2005 (or latest) [%]
Sources: Author's calculation based on IMF, 2007
At 16%, India’s exports of IT services account for a very high share of India’s total
exports. Only Cyprus and Israel command a higher share. Ireland is only just behind
India’s level. Yet, none of the big industrial and technologically savvy countries such
as the US, Germany or Japan have an export share that is nearly as high. China’s
export share is only 3.2%. The bottom of this list is occupied by poor African states
[image:8.595.155.443.372.606.2]At first glance, India’s specialisation appears strong but not exceptional. After all,
other countries have a similar or even higher export share. But the other countries
with a pronounced export specialisation in IT services – say, those with an export
share above 10% – differ in some aspects from India. Israel and Ireland are small
high-income economies with a highly educated workforce. Hence, the resource
endowment is much better suited for the production of more sophisticated services.
Ireland in particular is a well known global offshore (some call it nearshore) centre
and many firms have relocated part of their IT and business processes there. Cyprus
and Egypt, on the other hand, have a lower level of GDP per capita than either Israel
or Ireland and the level of tertiary education is also worse. However, their
specialisation is largely based on exports of other business services while computer
and information servicesare only a small fraction of IT services exports (see table 1). As noted above, it is quite likely that other business services capture more than just
IT-based services. Hence, the export shares of Cyprus and Egypt may be inflated by
non-IT services.
Standard trade theory suggests that in particular rich countries with a highly educated
workforce should have a comparative advantage in IT services. This impression is
supported by looking at the export share of IT services in relation to GDP per capita. The export share of IT services is estimated by the share of computer and
information services andother business services in a country's total exports (average
2000 to 2005, or latest). The variable is named RCA. Figure 3 illustrates the positive
relation between wealth and specialisation in IT services.
Table 1 | Top-5: IT and IT-based business services exports 2005 or latest
Exports of computer and information services and other
business services, USD m
Of which are computer and information services, %
Cyprus 1,719 12.5
Israel 10,056 45.0
India 13,967 81.4
Ireland 31,728 58.8
Egypt 1,574 1.6
In order to obtain a slightly more systematic impression, we estimated a simple
empirical model. The dependent variable is RCA. Our line-up of explaining variables
consists of (i) GDP per capita (GDP), (ii) the share of students in tertiary education
(EDUC), (iii) a dummy variable if a country has English as an official language
(ENGL), and (iv) the number of internet users per 1,000 people (INTER).1 All of them
have a supposedly positive impact on the production of IT services. Most IT and
IT-based business services need a qualified workforce. The Indian IT business
association NASSCOM, for instance, boasts the quality of its knowledge
professionals as one of the key advantages. By the same token, the main users of
offshoring are located in Anglo-Saxon countries (Meyer, 2006). Therefore, low-wage
countries with an English speaking populace should have an edge because
communication is easier and some services – e.g. call centres – could not be
possibly relocated otherwise. The degree of internet penetration captures additionally
the affinity towards technology.
Low-cost offshore destinations combine high-skill workers with low wages. So the
combination between high education and low GDP per capita may hold additional
explanatory power. For a relocating company, the degree of education at a certain
1
Data on exports of computer and information services and other business services are from the IMF’s Balance of Payment Statistics. High-technology manufacturing exports, GDP per capita (in 2000 USD), the share of students in tertiary education (% of the respective age cohort), number of internet users per 1,000 people are from the World Development Indicators (WDI) database. The dummy for English as an official language is from CEPII.
R2= 0.24
-1 -0.5 0 0.5 1 1.5
2 2.5 3 3.5 4 4.5 5
!
Log(GDP per capita)
Log(RCA*)
*RCA: Exports of computer & information services and other business services in % of total exports
India Cyprus
US
Namibia
Sources: Author's calculation, based on IMF, World Bank, 2007
[image:10.595.162.441.98.271.2]wage rate in the target country is arguably more important than the level of education
per se. Since GDP per capita correlates strongly with wages, a high value of EDUC
in relation to GDP should indicate the prevalence of an educated but affordable
workforce which in turn should boost offshoring. However, the variable EDUC per
GDP has proven to be statistically insignificant. One reason for this result may be that
many countries with a socialist tradition – e.g. those formerly belonging to the Soviet
bloc – boast high tertiary education but are often quite poor at the same time.
Moldova, for instance has a GDP per capita of around $400 (figures for 2004 in
prices of 2000) but nearly 32% of the people in the respective age cohort are enrolled
in tertiary education. India’s GDP per capita is $540 but only 11.5% are enrolled in tertiary education. Yet, no country of the former Soviet bloc has developed a
particular export specialisation in IT services. True, many Eastern European
countries have jumped on the offshoring train but their export structure remains less
focused (see Meyer, 2006). As it appears, it takes more than skilled workers at
affordable prices to leverage the potential of offshoring. One additional necessary
condition may be the ability to communicate in English. Shifting certain tasks of the
production chain to low-wage countries is only efficient if the cost differential is not
foiled by excessively high transaction costs (see, for instance Baldwin and
Robert-Nicoud, 2007). Speaking a different language than the sponsor would certainly boost
transaction costs. Hence, we combine the variable EDUC per GDP with a dummy for
English as official language – i.e. we put the following interaction term into the
equation: ENGL GDP
EDUC . This interaction term produces a positive value only for countries
where English is an official language. Otherwise it is zero. Hence, a high value for
this interaction term indicates that English is spoken, and that tertiary education is
widespread in relation to GDP. A combination of high education and moderate wages should attract international sponsors. The corresponding models are given by:
u ENGL GDP EDUC INTER EDUC GDP c RCA u INTER ENGL EDUC GDP c RCA + + + + + = + + + + + = 5 4 2 1 : (a) Offshoring 4 3 2 1 : Trade(a) β β β β β β β β
For the sake of this analysis, the full model without the interaction term will be
“Offshoring” denotes the model with the interaction term because it explicitly allows
for poor countries to make inroads into skill-intensive exports via, well, offshoring.
The results of this exercise are described in table 2. As it appears, all variables
correlate individually with RCA positively and significantly. Yet, in the full “trade(a)”
model, only GDP per capita retains explanatory power. That is not too surprising
because of multicollinearity. Countries tend to improve education and internet
[image:12.595.71.521.320.566.2]penetration as they get richer.
Table 2 | Dependent variable: RCA – share of exports of computer and information services and other business services in a country's total exports, average 2000-2005 (or latest) [%]
Method: OLS
Ia IIa IIIa IVa Trade(a) Offshoring(a) c 2.94 3.136 3.95 2.820 2.675 2.568 GDP 0.00161***
(3.17E-05)
0.00015*** (5.29E-05)
0.00015*** (5.23E-05) EDUC 0.0377***
(0.0152)
0.00125 (0.0201)
ENGL 1.954**
(0.932)
1.051 (0.937)
INTER 0.00657***
(0.0016)
0.00045 (0.003)
0.000991 (0.0025)
ENGL GDP
EDUC 145.62*
(0.0025) R2 23.2% 6.6% 4.7% 16.9% 24.6% 25.7%
N 90 90 91 89 87 87
Standard errors are in parentheses. Asterisks denote statistical significance at ***1%; **5% and *10% levels. Data sources: CEPII, IMF, WDI
The interaction term in the offshoring model turns out to be statistically significant
together with GDP. This suggests that rich countries are in principle better suited to
specialise in exports of IT services but that there is also room for low-wage offshore
destinations. GDP has a twofold effect on export specialisation. Firstly, it indicates
the level of economic development. Since IT services are skill-intensive products,
richer countries are typically better suited to export them – as evidenced by the
positive correlation between RCA and GDP. However, a low GDP per capita does
translate into low wages. This attracts international clients seeking a low-cost
rich countries) and communication works well. Under these conditions, even poor
countries can develop an export specialisation in IT services as shown by the positive
correlation between RCA and the interaction term. While many other potential
influences have been ignored here, even these parsimonious models explain about a
quarter of the variation in RCA.
Using the results of the trade(a) and offshoring(a) models, it is possible to estimate
the export share of IT services based on the selected fundamentals. A comparison
between this predicted export share and the actual export share is an indication of
how exceptional India’s or any other country’s position is in fact. As it turns out,
India’s average export share over 2000-2003 exceeds the predicted value by a factor
3.9 (trade[a]) respectively factor 2.8 (offshoring[a]).
In the trade(a) model, no other country has a higher multiple. Cyprus and Egypt come
close, but for reasons explained above. The export shares of Israel and Ireland – at a
level similar to India’s – appear more in line with fundamentals. Their multiples are
between 1.8 and 2.4 (see table 3). In the offshoring(a) model, India’s export share appears less exceptional. India’s multiple is on par with that of Israel, and Ireland
follows closely. Cyprus and Egypt even have much higher multiples – but again, they
are arguably driven by non-IT exports. Yet, bear in mind, that India is the only big
country with a high multiple. Small countries are much more likely to be specialised in
some sectors – simply because they are too small to achieve an efficient sector scale
in many sectors. Therefore, it is to be expected that for any given sector, there are
Table 3| India’s actual share of IT exports exceeds fitted values
actualexport share (%)
actual/fitted
Trade(a)
actual/fitted
Offshoring(a)
India 15.95 3.9 2.8
China 3.16 1.0 1.1
UK 11.16 1.3 1.5
Ireland 15.40 1.8 2.1
Israel 17.35 2.4 2.8
some small countries that are specialised in it. In our case, they happen to be Israel
and Ireland.
4. India has a bias towards IT not high-tech
India’s prominent position as an offshore hub for IT and IT-based business services
does not translate into a general specialisation in sophisticated products. In fact,
India’s share of high-technology manufacturing exports is markedly below that of
other countries. Only 2.8% of all exports are classified as high-technology. Such
exports include products with a high R&D intensity, such as in aerospace, computers,
pharmaceuticals, scientific instruments, and electrical machinery. A share of 2.8% is
not small compared with other countries at a similar level of economic development,
but it pales in comparison to the more advanced regions. The US, for instance,
commands an export share of around 20%. China’s export share of high-technology
product exceeds 19%, the Philippine’s share even 56%. The latter two countries’ shares may be inflated by exports that are still classified as high-technology but have
moved down-market in the meantime. Certain electronic components for instance
0 10 20 30 40 50 60
Sudan Norway Portugal Egypt India Cyprus China Japan United States Finland United Kingdom Israel Ireland Philippines
IT: Computer and information services plus other business services HT: High-technology manufacturing
Sources: Author's calculation based on IMF and WDI, 2007 "
[image:14.595.158.440.214.501.2]have become a commodity over the last few years, though they may be counted as
high-tech nevertheless.
High-technology manufacturing products may draw on a similar set of resources as
IT and IT-based business services, in particular a skilled workforce at affordable
wages. Hence, a lower share of high-technology exports may just be the
consequence of a higher share of IT services exports because domestic resources
may have been allocated towards the latter. Combining both exports thus gives a
more complete picture (see figure 4): India loses its exceptional position but it is still a
strong contender with regard to sophisticated services and products. However, other
countries, in particular if they are rich and technologically savvy, are typically more
specialised in such exports which corresponds to standard trade theory.
We use the same empirical analysis as above but with the sum of the shares of
high-technology manufacturing and IT services exports as dependant variable – named
RCA+HT. The results of this exercise are given in table 4. As in the previous
[image:15.595.68.525.210.446.2]analysis, each of the explaining variables – i.e. GDP per capita, tertiary education, a
Table 4 | Dependent variable: RCA+HT – share of exports of computer and information services and other business services plus high-tech exports in a country's total exports, average 2000-2005 (or latest) [%]
Method: OLS
Ib IIb IIIb IVb Trade(b) Offshoring(b) c 6.387 5.006 8.281 4.776 3.404 3.009 GDP 0.00049***
(9.42E-05)
0.00023 (0.00014)
0.00027** (0.00013) EDUC 0.1498***
(0.0424)
0.0401 (0.0571)
ENGL 10.40***
(2.646)
7.273*** (2.581)
INTER 0.0240***
(0.0044)
0.0081 (0.0084)
0.0141** (0.0063)
ENGL GDP
EDUC 1091.93***
(216.02) R2 24.7% 12.9% 15.2% 26.3% 33.7% 44.8%
N 84 86 88 86 83 83
dummy for English as an official language, and internet penetration – correlate
positively and significantly with RCA+HT. In all specifications, the R2is higher than in
the original setting which suggests that the selected fundamentals are better suited to
explain the general tendency to produce sophisticated products and services than
just IT services. Close to 45% of the variation in RCA+HT can be explained by the
offshoring(b) model.
However, the results also produce a rather remarkable result. The dummy variable
ENGL turns out to exert a huge influence. A country with English as an official
language appears to have a higher share of RCA+HT of between 7.3 (trade[b]) and 10.4 (model IIIb) percentage points – all other things being equal. By the same token,
the interaction term ENGL GDP
EDUC in the offshoring(b) model also has a huge coefficient.2
In the first set of models, ENGL exerts are smaller influence on RCA, even if one
takes into account that RCA has a mean of 4.4% whereas the mean of RCA+HT is
10.4%. The different impact is puzzling because it is the IT-service sector which
should benefit most from a common language. English is the lingua franca for IT
professionals and most relocating companies are based in English-speaking
countries. Yet, the results from this estimation suggest that the prevalence of the
English language also boosts exports of other high-technology products.
2The sample contains 21 countries with English as an official language which span from the UK to
[image:16.595.138.461.523.645.2]India, Hong Kong, Malta, Namibia or Eritrea. Colonial origin and the introduction of Anglo-Saxon-style institutions may play a role, but the strong position of ENGL remains even if the quality of institutions is controlled – e.g., by including the International Country Risk Guide (ICRG) composite indicator as an additional explaining variable.
Table 5 | India’s actual share of IT and HT exports within the range of fitted values
actualexport
share (%)
actual/fitted
Trade(b)
actual/fitted
Offshoring(b)
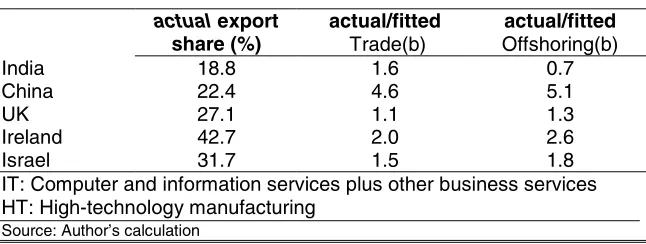
India 18.8 1.6 0.7
China 22.4 4.6 5.1
UK 27.1 1.1 1.3
Ireland 42.7 2.0 2.6 Israel 31.7 1.5 1.8 IT: Computer and information services plus other business services HT: High-technology manufacturing
India’s actual export share of IT services plus high-technology manufacturing
products is well within the range of fitted values: the multiples of actual vs fitted
values are between 0.7 (offshoring[b]) and 1.6 (trade[b]). Ireland and Israel have
higher multiples (see table 5). Also, China’s actual export share is between 4.6 and
5.1-times higher than predicted by the models – but again that may be partly due to a
[image:17.595.137.462.214.325.2]excessively generous classification of high-technology.
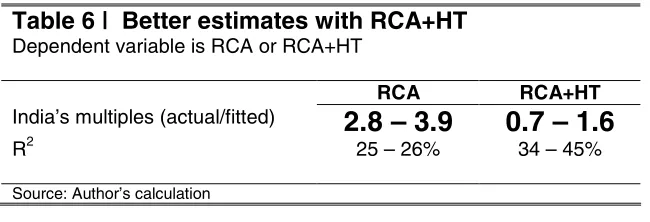
Table 6 | Better estimates with RCA+HT Dependent variable is RCA or RCA+HT
RCA RCA+HT
India’s multiples (actual/fitted)
2.8 – 3.9
0.7 – 1.6
R2 25 – 26% 34 – 45%Source: Author’s calculation
Combining the export shares of IT services with high-technology manufacturing
nearly doubles the explanatory power of the models and provides estimates for India
which are much closer to the actual numbers (see table 6).
The reasons for the bias towards IT services and away from high-tech manufacturing
exports are difficult to unbundle and deep analysis is beyond the scope of this paper.
Yet, two factors appear to have contributed: firstly, a discriminating economic policy
and, secondly, rising economies of scale. Trade barriers and red tape help to explain
the somewhat low overall volume of trade in India.3 Yet, many activities in the IT sector, in particular those in the offshoring business, are freed from such restrictions.
These privileges include for instance the creation of Software Technology Parks
(STP), tax breaks for IT firms, and the permission of full ownership of local firms by
foreigners (WTO, 2005). The latter is particularly relevant for a certain offshoring
model which requires that the provider is fully or mainly owned by the relocating
company. This model is often referred to as captive offshoring, and is often chosen
when critical tasks or sensitive data are being involved. India’s former minister for
telecommunications, Pramod Mahajon, once quipped that India is a leader in “IT and
beauty contests, the two areas that the government has stayed out” (Kapur 2002:
94). As a consequence, the IT sector has benefited from a mixture of benign neglect
first and outright government support after the initial success became apparent.
3
The Indian IT offshore sector shows evidence of rising economies of scale. The top-3
Indian providers with revenues in excess of $1bn have grown by around 40% (in
terms of revenues) on average in the financial year 2006 compared to around 20%
growth in the rest of the top-20. Also, the big ones are more profitable. Profit margins
increased from 12% for smaller Indian offshore providers (revenues less than $1bn),
to 19% for medium-sized firms (revenues around $1bn) to 24% for the top-3 (see
figure 5). This gravitation towards the big players suggests the presence of rising
economies of scale.
0 5 10 15 20 25
...>>$1bn ...~$1bn
...<<$1bn
# $ % &
Profits for the quarter ending Dec 2006, % of revenues NASSCOM top 20 companies with revenues ...
Source: Apte et al., 2007
Top-tier firms have a couple of advantages in the offshoring business. They can
bundle tasks and smooth out peaks in demand. They are also finding it easier to
relocate part of their work to other low-wage countries such as China or Vietnam.
Besides multinationals, they are often the first choice for talented employees. Since
people are the key resource in a skill-intensive business, this gives them an important
edge over smaller competitors. Moreover, a big size allows to serve a dispersed client base without losing efficiency on the way – something smaller firms have
struggled with (see Apte, 2007). The arguably biggest advantage of size is
reputation. While many tasks are scaleable and many smaller firms could leverage
efficiency by specialising in certain business fields, the appreciation as an acclaimed
and reliable provider is a strong selling point vis-à-vis clients. Typical offshore
contracts span over multiple years and switching to a different provider is often
costly. Therefore many clients prefer a provider whose sustainability and quality of
[image:18.595.160.440.311.444.2]5. India may be close to its offshoring peak
The level of development appears to have two and for poor countries opposing
effects on export specialisation. Firstly, there is a generally positive relation between
the share of skill-intensive exports and GDP per capita. Richer countries typically
have the necessary resource endowments – an educated workforce, good
institutions, capable infrastructure – to boast a comparative advantage in
skill-intensive goods and services. However, low GDP per capita translates into low wages. This attracts international clients seeking a low-cost destination, given that
educated workers are available (even if not as abundant as in rich countries) and
communication works well. Under these conditions, even poor countries can develop
a specialisation in skill-intensive exports.
Yet, you can’t get rich by staying poor. In the course of development, incomes and
eventually wages will rise, putting the offshoring model under pressure. In contrast to
the traditional trade model, offshoring may result in a declining export specialisation
in skill-intensive products as countries get richer until – at some point – it picks up
again.
To illustrate the point, consider the case of India. Table 5 describes the empirical
relation between the export specialisation and economic fundamentals. Using these
[image:19.595.137.470.118.217.2]relations, it is possible to extrapolate what may happen as India gets richer.
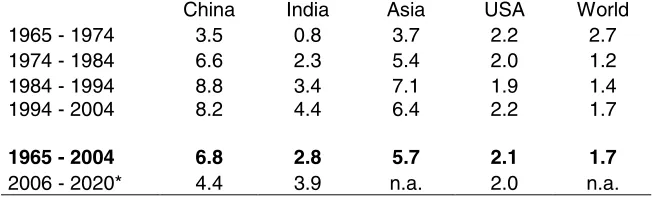
Table 7 | Serial growth accelerations in India Average growth in real GDP per capita p.a., %
China India Asia USA World 1965 - 1974 3.5 0.8 3.7 2.2 2.7 1974 - 1984 6.6 2.3 5.4 2.0 1.2 1984 - 1994 8.8 3.4 7.1 1.9 1.4 1994 - 2004 8.2 4.4 6.4 2.2 1.7
1965 - 2004 6.8 2.8 5.7 2.1 1.7
2006 - 2020* 4.4 3.9 n.a. 2.0 n.a.
India is still a poor country – classified as low income by the World Bank. Yet, real
growth rates of GDP per capita have been rising constantly. In the mid-60s, the
average Indian produced less than $200 compared with more than $500 in 2004 (in
prices of 2000). The average per capita growth rate between 1965 and 2004 of 2.8%
may be less than the Asian average (5.7%) or China’s (6.8%) but it exceeds for
instance that of the US (2.1%) as well as global growth (1.7%). Going forward, India’s
growth rate is projected to stay high in the foreseeable future – at a rate of 3.9% it is
only just behind China’s 4.4% (see table 7). The extrapolation in this section uses a
future growth rate of 3.9% p.a.
How will the share of students enrolled in tertiary education (EDUC) and the internet
diffusion (INTER) evolve as India gets richer? Both variables are highly correlated
[image:20.595.137.460.360.516.2]with GDP per capita as shown in table 8.
Table 8 | Method: OLS
Dependent variable: EDUC INTER
C -61.32 -748.32
Log GDP 12.06*** (1.134)
124.08*** (8.149)
R2 57.4% 73.2%
N 86 87
Standard errors are in parentheses. Asterisks denote statistical significance at ***1%; **5% and *10% levels. Data sources: WDI
Using the coefficients in table 8 allows projecting the rise in education and internet
adoption in the course of development based on cross-country averages. We have
adjusted both constants slightly – using 64.33 (instead of 61.32) for education and
-747.82 (instead of 748.32) for internet diffusion – in order to get starting values that
match India’s exactly.
With projections on GDP per capita, education and internet diffusion, it is possible to
estimate India’s share of skill-intensive exports over time (see figure 6). The
traditional “trade” model shows the typical monotonously upward sloping evolution.
The “offshoring” model shows a more twisted development. According to the
0 5 10 15 20 25 30 35
2004 2014 2024 2034 2044 2054 2064 2074 2084 2094 2104 2114
' (
Extrapolation of India's export specialisation in IT and high-tech, %
Source: Author's calculation
"Offshoring"
"Trade" Average of ""offshoring" and "trade" India's current export
specialisation
development, then declines and then rises again broadly in line with the traditional
“trade” model. The “offshoring” model predicts a higher, the traditional “trade” model
a lower export specialisation than India actually has. Interestingly, a simple average
of both models delivers a prediction (19.3%) that is quite close to the actual share of
18.8%.
As it appears, India may still be in a period of growing specialisation in skill-intensive
exports. Growth in education more than compensates rising GDP per capita which
makes relocations more attractive. But that may be about to change. The turning
point of the pure “offshoring” extrapolation is already 2007, that of the average extrapolation is 2010. Beyond these turning points, the rise in GDP per capita more
than outweighs the gains in education and high-skill specialisation declines. This
decline continues far into this century with a low point of 16.4% around the year 2060
for the average extrapolation. At that time, India will boast GDP per capita of around
$5,100 (in prices of 2000) and close to 39% of the respective age cohort will be
enrolled in tertiary education. Going forward, the share of skill-intensive exports will
rise again, but it will take until the year 2100 for export specialisation to reach a
similar level as in 2010. The average Indian will then produce close to $20,000 and
[image:21.595.158.443.518.684.2]The exercise in figure 6 illustrates the typical u-shape in the relation between the
specialisation in skill-intensive exports and the level of development within the
“offshoring” model. It shows that the revealed comparative advantage in the
production of skill-intensive products that some poor countries enjoy is a rather
temporary phenomenon. This puts the current excitement and alarm over the rise of
offshoring into perspective. After all, the basic notion that rich and technologically
savvy countries have a comparative advantage in the production of skill-intensive
products is unaffected by the “offshoring” model. What is more, the comparative
advantage currently enjoyed by offshore destinations such as India should not be
extrapolated linearly into the future. Rather a dip and convergence to the traditional “trade” model is more likely.
Note, however, that although the “offshoring” model does not lend support to the idea
of an ever growing comparative advantage in skill-intensive products for poor
countries it doesn’t predict a collapse either. The export specialisation predicted by
the “offshoring” model – and therefore necessarily also by the average model – stays
well above the traditional “trade” model until far into this century despite its declining
relative weight. Moreover, there is little reason to expect a decline in skill-intensive
exports in absolute terms. The shift in the relative weights appears relatively minor
compared with the overall export growth. All this points to a more balanced view:
Offshoring – as described in this analysis – allows some poor countries to develop an
export specialisation in skill-intensive products which they would not enjoy otherwise.
But neither does offshoring overthrow the traditional economic pecking order nor is it
an over-hyped business model that is going to fade away anytime soon.
A word of caution is in order here. The extrapolation in figure 6 serves as an
illustration but it is not a forecast. Changes in technology which boost or curb
transaction costs, for instance, may reshape the path of the “offshoring” model. The
same goes for policy changes. Also, the gains in education and internet diffusion in
the course of development are based on contemporary cross-country evidence (see
table 8) which may or may not be appropriate for India in the future. However, the
fundamental structural relation – the u-shape – is robust to a variety of different
6. Conclusions
The rise of India’s IT industry is obvious. Its success draws on India’s supply of
well-educated, English-speaking and affordable workers. But these fundamentals explain
only part of the story – as illustrated by our simple empirical analysis. India’s actual
export specialisation in IT services exceeds the fitted values of the empirical “trade”
model by a factor 4. No other country has a higher multiple; only Israel and Ireland
come close. This paper argues that two factors contribute to this specialisation:
Firstly, India makes extensive use of the offshoring model by which western firms
relocate part of their production to low-wage countries. Offshore production facilities typically combine local talents at local wages with the advanced technology of the
parent company. They often use this combination to produce and export
skill-intensive goods and services back home. As a consequence, the skill-intensity of
exports may be upwardly biased in the presence of offshoring compared to the
intensity suggested by the level of development. However, the actual/fitted multiple
declines only to 2.8 if the empirical estimation addresses offshoring more directly.
This suggests that the presence of offshoring is not sufficient to explain India’s export
specialisation in IT services.
A second observation is that the specialisation in IT services comes – at least partly –
at the expense of other high-tech manufacturing exports. The actual/fitted multiple
declines to values between 0.7 (“offshoring”) and 1.6 (“trade”) if high-tech
manufacturing exports are included because India exports relatively little of them.
Moreover, the explanatory power of the estimation rises when high-tech
manufacturing exports are being included: the R² rises from around 25% to between
34 and 45%. IT services and high-manufacturing exports appear to draw on a similar
set of economic fundamentals – a well educated workforce, in particular – and a bias
towards one seems to crowd out the other.
Obviously, there is no magic behind India’s IT specialisation. This should lend
comfort to those who feel threatened by the rise of offshoring and the progress some
poor countries have made in exporting skill-intensive products. In the long run, the
level of development is the leading driver behind a comparative advantage in the
skill-intensively at an early stage of development – provided that transaction costs are
sufficiently low – but this model draws on low wages in the first place. Yet, wages
tend to rise as countries climb up the development ladder. This crowds out the very
foundation of the offshoring model and results in a declining export specialisation for
intermediate stages of development. The example of India, detailed in section 4,
illustrates this u-shaped evolution: India’s specialisation in skill-intensive exports may
reach a peak between 2007 and 2010 and decline afterwards. It may take until the
year 2063 for specialisation to rise again and until the end of this century for the
current level to be reached again (see section 5 for assumptions and qualifications).
While this should not be seen as a forecast, it serves to illustrate the ups and downs in the evolution of export specialisation.
The success of India’s IT industry has additional effects that are not easily measured
in economic terms. It is a constant source of pride and confidence to the Indian
economy and has contributed to the growing perception of India as an economic
References
Amiti, Mary and Shang-JinWei (2005). “Services Offshoring, Productivity, and
Employment: Evidence from the United States”. IMF Working Paper No. 05/238.
Apte, Sudin; et al. (2007). “The Polarization of Indian Offshore Providers Accelerates”. Quick Take. March 15. Forrester Research, Inc.
Balassa, Bela (1965). Trade Liberalization and Revealed Comparative Advantage. The Manchester School of Economic and Social Studies 33. S. 99-123.
Baldwin, Richard and Frederic Robert-Nicoud (2007). “Offshoring: General
Equilibrium Effects on Wages, Production and Trade”. NBER Working Paper No 12991.
Bergheim, Stefan (2005). “Global growth centres 2020: Formel-G for 34 economies”. Current Issues. DB Research. Frankfurt am Main, 2005.
Bhagwati, Jagdish, Arvind Panagariya and T. N. Srinivasan (2004). “The Muddles over Outsourcing.” The Journal of Economic Perspectives. Vol. 18. No. 4. pp. 93–114.
Blinder, Alan S. (2007). “How Many U.S. Jobs Might Be Offshorable?” CEPS Working
Farrell, Diana et al. (2005). “The Emerging Global Labor Market: Part II – The Supply of Offshore Talent in Services”. McKinsey Global Institute.
Global Competitiveness Report (2005-2006).Policies Underpinning Rising Prosperity. Geneva
Grossman, Gene and Esteban Rossi-Hansberg (2006a). “The Rise of Offshoring: It’s not Wine for Clothes anymore”. Working Paper. Princeton University.
Grossman, Gene and Esteban Rossi-Hansberg (2006b). “Trading Tasks: A Simple Theory of Offshoring”. Working Paper. Princeton University.
Jones, Ronald W. and Henryk Kierzkowski (2000). “A Framework for Fragmentation”. Tinbergen Institute Discussion Paper 2000-056/2.
Kochhar, Kalpana; Utsav Kumar, Raghuram Rajan, Arvind Subramanian and Ioannis Tokatlidis (2006).” India's pattern of development: What happened, what
follows?”. Journal of Monetary Economics, Volume 53, Issue 5, pp 981-1019
Meyer, Thomas (2006). ”Offshoring to new shores: Nearshoring to Central and Eastern Europe”. E-conomics 58. DB Research. Frankfurt am Main.
Meyer, Thomas (2007). “Offshoring work, not jobs”. E-conomics 61. DB Research. Frankfurt am Main.
NASSCOM (2007). “Indian IT Industry – Fact Sheet”. Available at:
http://www.nasscom.in/upload/5216/Indian_IT_Industry_Factsheet_Feb2007.pdf
Neuhaus, Marco (2005). “Opening economies succeed: More trade boosts growth”. Current Issues. DB Research.
Rajan, Raghuram G. (2006). “India: The Past and its Future”. Address at the forum for Free Enterprise, Mumbai, India, 20 January 2006. available at
www.imf.org/external/np/speeches/2006/012006.htm
Ricardo, David (1817).On the Principles of Political Economy and Taxation. London.
Research Notes 27
© Copyright 2007. Deutsche Bank AG, DB Research, D-60262 Frankfurt am Main, Germany. All rights reserved. When quoting please cite “Deutsche Bank Research”.
The above information does not constitute the provision of investment, legal or tax advice. Any views expressed reflect the current views of the author, which do not necessarily correspond to the opinions of Deutsche Bank AG or its affiliates. Opinions expressed may change without notice. Opinions expressed may differ from views set out in other documents, including research, published by Deutsche Bank. The above information is provided for informational purposes only and without any obligation, whether contractual or otherwise. No warranty or representation is made as to the correctness, completeness and accuracy of the information given or the assessments made.
![Fig 2 │ India reveals a comparative advantage for ITShare of exports of computer and information services and other businessservices in a country's total exports, average 2000-2005 (or latest) [%]](https://thumb-us.123doks.com/thumbv2/123dok_us/8033191.769457/8.595.155.443.372.606/comparative-advantage-itshare-computer-information-services-businessservices-average.webp)
![Fig 3│ Rich countries export IT servicesIncome [Log(GDP per capita)] vs IT specialisation [Log(RCA*)]](https://thumb-us.123doks.com/thumbv2/123dok_us/8033191.769457/10.595.162.441.98.271/fig-rich-countries-export-servicesincome-log-capita-specialisation.webp)
![Table 2 | Dependent variable: RCA – share of exports of computer and information services andother business services in a country's total exports, average 2000-2005 (or latest) [%]Method: OLS](https://thumb-us.123doks.com/thumbv2/123dok_us/8033191.769457/12.595.71.521.320.566/dependent-variable-computer-information-services-andother-business-services.webp)
![Fig 4│ India not a high-tech starShare of IT and HT exports in a country's total exports, average2000-2005 (or latest) [%]](https://thumb-us.123doks.com/thumbv2/123dok_us/8033191.769457/14.595.158.440.214.501/india-starshare-exports-country-total-exports-average-latest.webp)
![Table 4 | Dependent variable: RCA+HT – share of exports of computer and information servicesand other business services plus high-tech exports in a country's total exports, average 2000-2005 (orlatest) [%]Method: OLS](https://thumb-us.123doks.com/thumbv2/123dok_us/8033191.769457/15.595.68.525.210.446/dependent-variable-computer-information-servicesand-business-services-orlatest.webp)