Thermal Analysis of Immersed Heat Source during Flow
Reduction Transient
Akram W. Ahmed Ezzat,
Ph.D
Asst. Prof. Dept. of Mech. Eng. University of Baghdad
Salah I. Hasan
Dept. of Mech. Eng. University of Baghdad
ABSTRACT
Theoretical and experimental study of transient heat transfer parameters related to downward flowing water in a circular concentric annular channel is conducted. The cooling channel is exposed internally to sinusoidal heat flux and has an adiabatic outer surface. The present theoretical study investigated the heat transfer and thermodynamic parameters during of 25%, 50%, and 75% flow reduction transients. The related experiments to such flow reductions simulates the loss of flow accidents (LOFA) in the research nuclear reactors initiated by loss of main power supply, pump failure, heat exchanger blockage, pipe blockage or valve closing. The results of steady state condition set as an initial condition for the transient model which is evaluated by using M-file-MatlabR2013a written computer program. The theoretical transient approach involved a mathematical model based on the analytical solution for first order ordinary differential equations supported by experimental correlations for axially, symmetric, simultaneously developing laminar water flow in a vertical annulus cooling channel which takes under consideration the nucleate boiling, film boiling and two phase flow formulation. The mathematical model is based on one dimensional downward flow. Unit step flow reduction function is implemented in the present model to simulate the flow reduction transient. It is noteworthy that the unit step reduction function is used first time in the recent study among the related previous study. The present experimental investigation included a set of experiments carried out to investigate the thermal-hydraulic behavior and evaluate their boiling safety factor, K. The present work is based on the following initial and boundary conditions: heat flux of 50 kW/m2, mass flux values of 192.6, 128.4, and 64.2 kg/m2.s to simulate the 25%, 50% and 75% flow reduction transients as the nominal mass flux is 256.8 kg/m2.s accompanied with keeping the inlet cooling water pressure around 1.06 bar, inlet water temperature equal 80oC and 38.89. Before initiating the flow reduction transient scenario, the acceptable thermal-hydraulic safety level of the cooling system is set to be close from the acceptance criteria (K ≥ 1.6) that implemented in the Iraqi nuclear reactor (14th Tammuz 5000 kW Reactor) referred to the final safety analysis report that done by (A.W.Ezzat and H.M.Taki, 1988). It is concluded that K value reaches around unity for 25% and 50% of flow reduction percentage transient at around 5 and 3 seconds respectively from transient initiation while the K value dropped below the unity at 75% of flow reduction transient. The surface dry out takes place during 75% and 100% flow reduction at normalized distance of 0.65 away from the cooling channel entrance based on experimental observation due to the onset of flow instability (OFI) that encounter the downward flow direction at low pressure and low velocity system (LPLV). It’s also conclude that the elapsed time required for the surface temperature to reach its steady state values after each transient scenario is less than that related to bulk water temperature as long as the
water temperature kept below its saturation temperature. Generally, the present experimental and theoretical results showed good agreements.
Keywords
Loss of flow accident, Dry out, Nucleate boiling and film boiling, Heat transfer parameters, Downward flow, circular concentric annular channel, Two phase flow, Onset of flow instability.
1.
INTRODUCTION
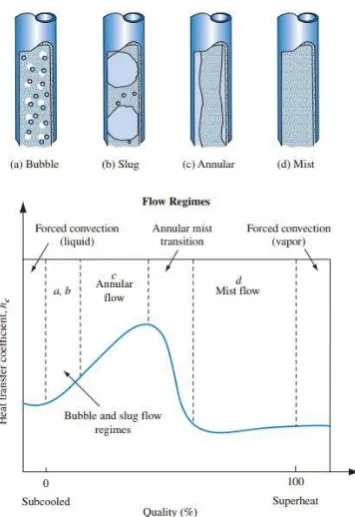
Figure (1): Heat transfer coefficient versus quality and types of flow regime.
Qing Lu et al. 2009 [2], investigated the course of the partial and total blockage of a channel in the IAEA 10 MW MTR pool type research reactor core without scram. The analysis was performed with best estimate code RELAP5/MOD3.3. The interaction of the obstruction channel and its adjacent channels has been taken into account. The results indicated that even when the flow channel has been totally blocked, there is still no boiling occurrence, and the fuel temperature is low enough to maintain its integrity. Hainoun et al. 2010 [3], used the thermal hydraulic code MERSAT, (Model for Evaluation of Reactor Safety and Analysis of Thermal hydraulic) in his study. Detailed model including primary and secondary loop was developed for the International Atomic Energy Agency, IAEA reference research reactor material MTR 10MW. The developed model enables the simulation of expected neutronic and thermal hydraulic phenomena during normal operation, reactivity and loss of flow accidents. They found that two different losses of flow accident have been simulated using slow and fast decrease time of core mass flow rate. In both cases the expected flow reversal from downward forced to upward natural circulation has been successfully simulated. His results indicated that in accidents the limit of onset of sub-cooled boiling was not arrived and consequently no exceed of design limits in term of thermal hydraulic instability or DNB is observed. Hong Gao and Xuewu Cao 2011[4], developed a mathematical model for solving flow rate transient and pump speed transient during flow coast down period. The flow rate and pump speed solved analytically. The calculated non-dimensional flow rate and non-dimensional pump speed using the model compared with published experimental data of two nuclear power plants and a reactor model test on flow coast down transient. The comparison results showed a good agreement. As the flow rate approaches to zero, the difference between experimental and calculated values increases due to the effect of mechanical friction loss. A.D. Vasiliev et. al 2012 [5] simulated a severe LOCA (loss of coolant accident) in NPP (nuclear power plant)
sequence in which the overheated core up to 1700-2300k would be re- flooded from the bottom on ECCS (emergency cooling core system) recovery. After maximum cladding temperature of about 1900 k had been reached in the bundle during PARAMETER-SF4 (the name of facility) test, bottom flooding was initiated. The thermal hydraulic and SFD (severe fuel damage) best estimate computer modeling code (SOCRAT/V2) was used for the calculation of PARAMETER-SF4 experiment. The important feature of PARAMETER-PARAMETER-SF4 was the air ingress phase and the thermal hydraulic behavior during the reflood. The adequate modeling of thermal hydraulic and chemical phenomena that occurred during the test, including the convective and radiative heat transfer in the bundle, the oxidation during the air ingress phase and the two phase coolant behavior during the bottom reflood, has allowed to calculate the correct thermal behavior in the test.
2.
EXPERIMENTAL WORK
Proper heat source is designed in order to impart sinusoidal heat flux that used to heat up the flowing water in vertical downward direction in annulus that surround it, the test section shown in the schematic diagram of figure (2).
Figure (2): Test section schematic diagram.
The heat source consists of nickel-chrome wire is divided into 9 connected sub segments symmetrically in different wire resistance value in order to generate sinusoidal axial heat flux distribution, wounded as (O) shape coil surrounded by hollow ceramic discs inside stainless steel tube, in the ends of the coil two studs are connected to be its electrical terminals and the stainless steel tube is fitted with thermal cement to isolate this coil from the stainless steel tube as shown in figure (3a) and figure (3b).
[image:2.595.88.266.74.333.2] [image:2.595.339.499.312.589.2]Figure (3b): Half of symmetrical heat source parts.
The curve fitting tool of MatLabR2013a used to find the heat flux distribution expression as shown in figure (4) and given;
Where,
zi=Zi/L, a1= 0.2509, a2= 0.0837, b1= 2.934, b2= 4.895,
c1= 0.1226, c2=2.231
Figure (4): Curve fitting for sinusoidal heat flux profile.
The schematic diagram of the test rig is shown in figure (5), the length of the heater is (90 cm), while it’s heating active length is (70cm), the diameter is (1.8 cm), the maximum total power is 3000 W, resistance of heat source (16.133Ω) and the maximum applied voltage (180-220) Volt. The flowing channel is made of Teflon to minimize the heat lost to the surrounding air due to its low thermal conductivity (0.19 – 0.25 W/m.K) in addition to its suitable melting point (260 – 327 OC) to withstand the water temperature of the flow patterns during water phase change. The cylindrical channel thickness is (1 cm), its length is (75 cm), with inner diameter equals (2.2 cm) and outer diameter equals (4.2 cm). The cylindrical channel is insulated by glass fibers sheath. To ensure the gap between two concentric cylinders equal to (0.2cm), proper flanges made from Teflon are fitted in the both ends of the cylindrical channel to resist the high temperature caused by the effect of the heat source in the top and bottom of the annular channel. The temperature of the outside surface of the tube heat source is measured by using seventh alumel-chromel (type K) thermocouples installed in seven spaces (2, 13, 24, 35, 46, 57, and 68) cm arranged along the heated wall. The end of thermocouple wires connected with standard male plug in order to connect them with the digital thermometer. Circular holes of (d=1.27 cm) are drilled in the surface of the Teflon cylinder to provide a proper space for thermocouples welding operation on the tube surface, these holes are sealed by drilled pipe end plugs of (d=1.27 cm) to pass the
thermocouple wires through them and then covered by special epoxy that withstands 200 OC. The thermocouples are installed in equal space distances at seven positions.
Figure (5): Test rig schematic diagram.
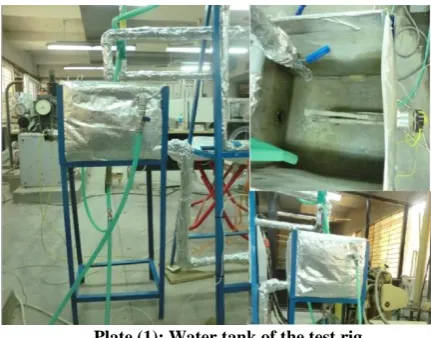
The supplied water to the annular test section is heated up to (80oC) in a rectangular cross section tank of (40×30×30) cm dimensions by electrical heater of 3000 W. The tank is shown photographically in plates (1).
Plate (1): Water tank of the test rig.
[image:3.595.315.531.114.456.2] [image:3.595.315.531.530.699.2]100% of flow reduction tests and serve as pressure drop element to stabilize the cooling flow and avoiding the backflow phenomena, see plate (2).
Plate (2): Check valve connected directly before the pipes bridge.
The positions of the control valve are marked in three locations that represent particular flow reduction (25%, 50%, and 75% from its nominal value) to ensure accurate step reduction change in the volumetric water flow rate during conducting coolant fluid reduction tests, see plate (3).
Plate (3): Downward flow outlet control valve.
The feed pipe contains of a flow meter (0.5-4 LPM) to read water flow rate in the test section channel, see plate (4). A pressure gage of (0-100 kPa.) range is used to measure the inlet pressure of the cooling water. The pressure through the annular channel measured by manometer manufactured locally, as shown in plate (5).
Plate (4): Water flow meter.
Plate (5): Manometer components.
Plate (6): Measurement devises.
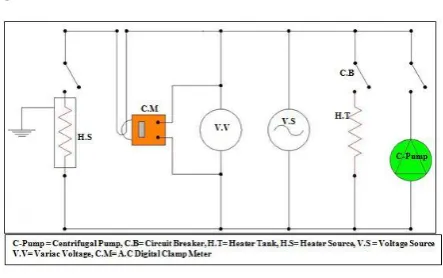
The electrical circuit diagram of the test rig is shown in
figure (6).
Figure (6): Electrical circuit diagram of the test
rig.
3.
THEORETICAL ANALYSIS
Flowing water in a vertical annulus subjected to transient forced convection effect in radial direction is presented for modeling. A one- dimensional model could be used to describe the transient forced convection heat transfer in a vertical annulus, with inner radius ri and outer radius ro. Water flow direction is assumed to be in the downward direction according to the experimental setup. The following assumptions are used in the modeling:
Incompressible fluid.
One dimensional in (z-axis) flow. There is only one non zero velocity component, namely that in the direction of flow, thus,
The axial velocity is independent of the angular location; that is,
Simultaneously developing hydrodynamic. No internal heat generation and heat dissipation. Neglecting viscous dissipation.
Variable fluid properties versus its temperature ( ).
The flow during steady state condition is single phase as water bulk temperature does not exceed the saturation temperature along the cooling channel, x=0.
The two phase flow and heat transfer during transient case at the upper part of the test section where water quality, x >0 is based on homogeneous model.
3.1
Formulas Used for Prediction Measured
Parameters during Steady State Condition.
To analyze the heat transfer process by forced convection from the heat source surface to the liquid water flowing along it through annular section adjacent to the heat source surface simplified steps were used by conducting mass and heat balance at specified cross sectional area in the channel. The heat transfer coefficient is one of the affective parameters that should be estimated using the proper correlation, Calculation procedure is conducted as follows:
The total input power supplied to the heat source can be calculated as;(1)
Total heat flux (W/m2) is calculated by using the following relation;(2)
(3)
The cross section area (m2) of annular tubes, in which the cooling water flowing inside it could be calculated as follows:
(4)
The average cooling water velocity (m/s) of water could be determined as follows:
(5)
To determine bulk water temperature at specified points and compare them with the four thermocouple read out fixed along the gap between heater wall and cooling channel wall during steady state condition, the following equation is derived for prediction it, the results of heat balance can express as;
Dependence of local Nusselt number on the distance could be written in the following form according to Petukhov, 1986 ; [A.D. Vasiliev et. al 2012].
[image:5.595.59.276.84.258.2] [image:5.595.58.280.290.429.2]
Where;
Thus, the local convective heat transfer coefficient could be evaluated as following;
To obtain the local heat transfer coefficient it is necessary to calculate the film temperature as shown below:
Where
The heat source surface temperature is calculated by using the following formula:
3.2
Derivation of Temperature Response to
Flow Reduction Transient According to
Step Disturbance Function
The derivation of bulk water and surface temperature to flow step reduction is based on the single phase flow (Liquid) and two phase flow (Liquid-Steam) along the cooling channel. The temperature response could be derived from the heat balance as shown in figure (7a) and (7b).
Heat balance for cooling water element;
Figure(7a): Heat balance for cooling water element
Figure(7b): Heat balance for heat source surface element
After substituting equation (15) in equation (14) to get ;
By solving equation (16) using the integration factor method and applying the initial condition to find the
following,
To obtain the water single phase flow (liquid phase) transient temperature value forTb(t,i) substitute the results of equation (17)in equation (15).
In case of two phase flow (water liquid -steam) take place, the water temperature may be obtained by;
The surface heater temperature during transient condition at any section of the surface heater length at any time could be derived from the following heat balance:
Divide both equation side by ( ) to get the following;
By solving equation (19) using integration factor method and applying the initial condition to find the
following;
For single phase (liquid) flow (Ts < TB and Tb < Tsat), equation (11) is used to evaluate the heat transfer coefficient. In the sub cooled nucleate boiling regime (Ts TB and Tb < Tsat.) the proposed correlation by Chen (Frank Kreith2011, [7] )is used which could be expressed as following;
Where;
Convective heat transfer coefficient (W/m2.oC) equation (11) is based on the following expression of Reynolds number:
The parameter could be calculated from
The parameter S is given by;
With Reynolds number defined as;
For film boiling (Tb = Tsat) region, the Bromleycorrelation is recommended and expressed as follows:
3.3
Sub-cooled Boiling Temperature and
Boiling Safety Factor Estimation
Sub-cooled nucleate boiling of the coolant starts when the heat source clad surface temperature reach to the boiling temperature ( ) at that position. The following correlation is used for estimation, [6].
Where, p in bar. Tsat. in (oC), and qz in (kW/m2).
To calculate the local static pressure (p) for single phase (liquid) flow the following equations could be used;
In case of two phase flow (water-steam) the local static pressure could be obtained from the following equations;
Zivi’s (1964) equation is used to evaluate the void fraction ( ) as the following;
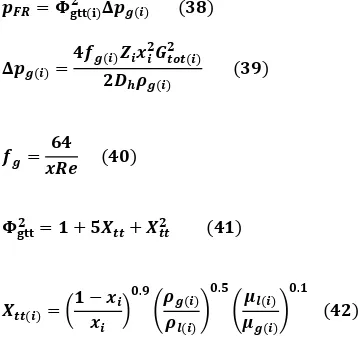
In order to calculate the friction pressure drop in two phase flow, the method of Lockhart and Martinelli (1949) for Re < 4000 is used as follows:
To avoid sub-cooled nucleate boiling at clad surface, the maximum clad temperature at the hot spot should be lower than boiling temperature. A boiling safety factor (K) given by the following equation is used to estimate this temperature;[6].
It’s clear from equation (43) that the thermal-hydraulic cooling system will stay in the safe operation condition as long as K value above 1.
4. RESULT AND DISCUSSION
Generally, the variation of the temperature along the heat source surface may be affected by many variables such as the local heat flux, water inlet temperature, water flow direction at low pressure low velocity system, water velocity inside the channel, gap between concentric cylinders and the distances of the test section at which the clad temperature is measured or calculated. Figures 8, 9, and 10 show the theoretical and
[image:8.595.53.232.350.520.2]for the bulk cooling temperature to reach its steady state versus flow reduction percentage, 25%, 50% and 75% respectively. The figure shows that both experimental and theoretical results have the same trend. The elapsed time increases with the flow reduction percentage when the cooling water temperature values are kept below its saturation temperature. However, when the flow reduction increases enough to bring the cooling water to its saturation the temperature the elapsed time is inversely proportional with the flow reduction. At such case the cooling fluid can increase up to its saturation temperature and can’t exceed it further more as long as the dryness quality (x) is around unity. Figure 29 illustrates the experimental and theoretical elapsed time for the heat source surface temperature to reach its steady state versus flow reduction percentage, 25%, 50% and 75% respectively. The figure shows both experimental and theoretical results have the same trend and that its response is faster than related to cooling water. Same justification related to bulk water temperature behavior is applied here.
5.
CONCLUSION
The results of the experimental and theoretical investigation are mainly described the thermal-hydraulic behavior of an electrical heat source cooled by forced convection ensured by water downward flow in vertical annulus during flow reduction transient conditions. As many other previous researches outputs and conclusions, such type of studies describes the safety margins of boiling crisis, necessary mitigating action required to be interfered by the engineering safety features systems, ESFS. The following conclusions could be made:
The maximum surface temperature is located at a normalized position above the location of maximum heat flux value away from the entrance of the cooling channel and affected by many factors such as, local bulk cooling temperature, heat source surface material, local heat flux value, geometry of the cooling channel, cooling flow rate, and the type of heat transfer coefficient (convective, nucleate boiling, film boiling).
A heat transfer process based on boiling safety factor, K keeps its value above unity versus flow reduction up to 50% flow reduction transient due to the effect of nucleate boiling, which depends on the local heat flux, cooling flow reduction percentage and other thermal hydraulic properties of the cooling channel. While it drops below unity at flow reduction percentage of 75% from its nominal value. As a result of the sharp reduction in the flow rate (75%)
accompanied with low pressure value of the cooling water inside the annular channel due the phase change in cooling water the phenomena of onset of flow instability (OFI) takes place and that leads to partial channel dry out at that location, (0.65).
The surface temperature response is faster than that related to bulk water temperature affected by flow reduction transient as long as the cooling water temperature value is kept blow it’s saturation temperature.
At the end of 100% flow reduction transient period, the heat transfer mode inside the cooling channel is divided into two parts mainly: conduction heat transfer part below
0.5 and free convection heat transfer part above it and that is recognized by the cooling temperature and heat source surface temperature distribution.
Installing the pressure drop element at the entrance of the cooling channel that cooled by downward flow direction has a significant effect to enhance the flow boiling stability and mitigate the backflow phenomena.
6.
NOMENCLATURE
Af Flow area of the cooling channel As Heat source surface area
Cp Specific heat of constant pressure Dh Hydraulic diameter
di Inner diameter of the heat source do Inner diameter of the cooling channel f Friction factor
F Parameter defined in equation 24 g Gravity acceleration
Gtot. Total mass flux (liquid + steam) h Heat transfer coefficient hlg Enthalpy of vaporization k Thermal conductivity K Boiling safety factor L Length of heat source mo Mass flow rate M Water nodal mass MS Stainless steel nodal mass p Pressure
pi Inlet pressure of cooling water pr Prantdl number
Q Heat power q Heat flux Re Reynolds number
S Parameter defined in equation 25 t Time
T Temperature vz Axial velocity x Dryness fraction Z Local axial position z Normalized axial position
6.1 Greek letters
α Void fraction µ Dynamic viscosity ρ Density
Фgtt Two phase flow friction pressure multiplier Xtt Lockhart and Martinelli parameter σ Surface tension
6.2 Subscript
av Average b Bulk B Boiling c Convective conv. Convection f Film FB Film boilingfr Friction pressure in single phase flow g Gas
NB Nucleate boiling r reduced
S Heat source surface st Steady state
stat Static pressure for single phase flow STAT Static pressure for two phase flow sp Single phase
t time domain tot. Total tp Two phase v Vapor
7. ACKNOELEDGMENTS
First of all thanks to Allah the most merciful, the most kind to give me the power and the patience to accomplish this work. I would like to express my profound gratitude and appreciation to my supervisor “Assist. Prof. Dr. Akram W. Ahmed “for his kind patronage, excellent scientific advice and motivation support throughout the steps of this work. It has been a privilege to have worked with him. I'm sure without his guidance; this work would not have taken this final shape. Thanks are extended to my colleagues, Engineer Mohammed Al-Azawy and Engineer Aws Al-Saffar for their assistance and help during conducting the experimental test. My deep gratitude is towards my parents, my brother, my sister for their incessant prayers, more supports, guidance, encouragement and patience during my studies. They are the source of power, inspiration and confidence in me.
Figure (8):Experimental and theoretical heat source surface temperature versus normalized distance
during steady state condition
Figure (9): Experimental and theoretical bulk water temperature versus normalized distance during steady
state condition.
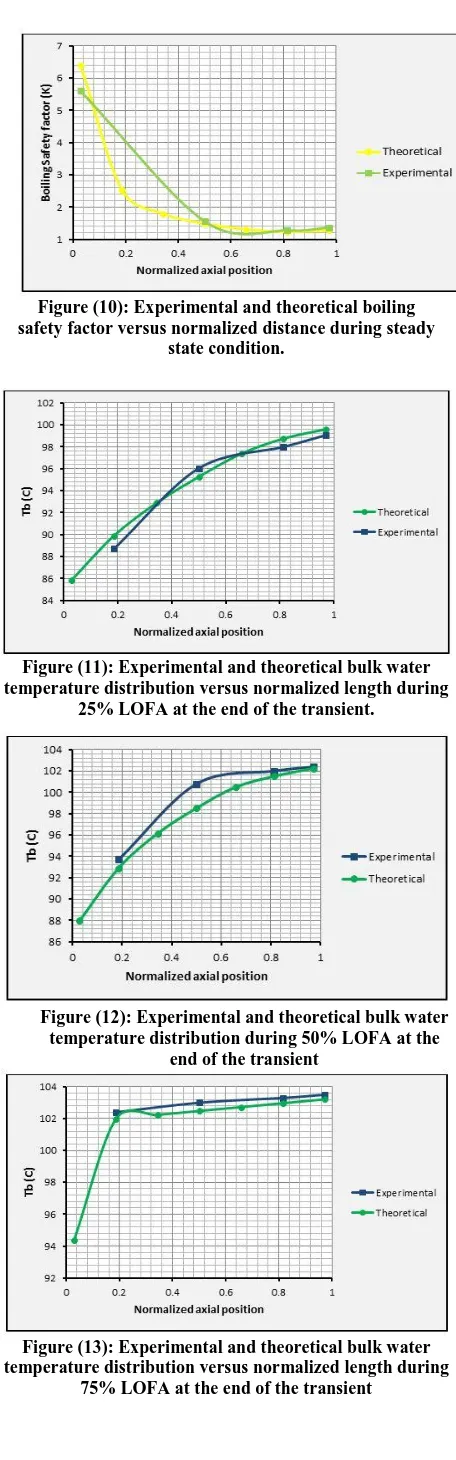
Figure (10): Experimental and theoretical boiling safety factor versus normalized distance during steady
state condition.
Figure (11): Experimental and theoretical bulk water temperature distribution versus normalized length during
25% LOFA at the end of the transient.
Figure (12): Experimental and theoretical bulk water temperature distribution during 50% LOFA at the
end of the transient
Figure (13): Experimental and theoretical bulk water temperature distribution versus normalized length during
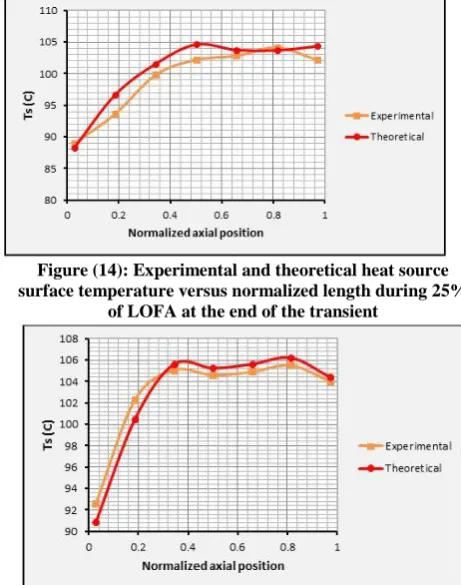
[image:10.595.315.543.58.788.2] [image:10.595.326.550.73.203.2] [image:10.595.316.542.253.389.2] [image:10.595.54.282.385.511.2] [image:10.595.315.541.400.725.2] [image:10.595.55.279.557.701.2]Figure (14): Experimental and theoretical heat source surface temperature versus normalized length during 25%
of LOFA at the end of the transient
Figure (15): Experimental and theoretical heat source surface temperature versus normalized length during 50%
of LOFA at the end of the transient.
Figure (16): Experimental and theoretical heat source surface temperature distribution during 75% of LOFA at
the end of the transient.
Figure (17): Experimental and theoretical boiling safety factor distribution during 25% of LOFA at the end of the
transient.
Figure (18): Experimental and theoretical boiling safety factor distribution during 50% of LOFA at the end of the
transient.
Figure (19): Experimental and theoretical boiling safety factor distribution during 75% of LOFA at the end of the
transient.
Figure (20): Theoretical and experimental surface temperature versus time at normalized distance, (0.81)
during 25% flow reduction transient.
Figure (21): Theoretical and experimental surface temperature versus time at normalized distance, (0.81)
[image:11.595.54.287.25.712.2] [image:11.595.312.541.74.204.2] [image:11.595.54.285.75.368.2] [image:11.595.312.541.83.379.2] [image:11.595.313.540.84.721.2] [image:11.595.55.280.385.720.2]Figure (22): Theoretical and experimental surface temperature versus time at normalized distance, (0.81)
during 50% flow reduction transient.
Figure (23): Theoretical and experimental bulk water temperature versus time at normalized distance, (0.97)
during 25% flow reduction transient.
Figure (24): Theoretical and experimental bulk water temperature versus time at normalized distance, (0.97)
during 50% flow reduction transient.
Figure (25):Theoretical and experimental bulk water temperature versus time at normalized distance, (0.97)
during 75% flow reduction.
Figure (26): Cooling water temperature versus time and length during 100% flow reduction
Figure (27): Surface temperature versus time and length during 100% flow reduction.
Figure (28): Experimental and theoretical elapsed time for bulk cooling water temperature to reach its steady state
versus flow reduction percentage.
Figure (29): Experimental and theoretical elapsed time for surface temperature to reach its steady state versus flow
[image:12.595.56.280.56.674.2] [image:12.595.55.279.72.215.2] [image:12.595.321.554.74.196.2] [image:12.595.54.279.75.368.2] [image:12.595.323.551.237.352.2] [image:12.595.317.541.390.501.2] [image:12.595.314.542.405.665.2]4.
REFERENCES
[1] Ahmed Mohammed El-Messiry. (2000) " Accident of loss of flow for the ETTR-2 reactor: dramatic analysis" ORIGNAL PAPER, NUKLEONIKA, Vol. 45, No. 4, PP. 229-233
[2] Qing Lu, Suizheng Qiu, G.H. Su. (2009) "Flow blockage analysis of a channel in a typical material test reactor core" Journal of Nuclear Engineering and Design, Vol. 239, PP. 45-50.
[3] Hainoun, N.Ghazi, B. Mansour Abdul-Moaiz. (2010)
"Safety analysis of the IAEA reference research reactor during loss of flow accident using the code MERSAT" Journal of Nuclear Engineering and Design, Vol. 240, PP.1132-1138.
[4] Hong Gao, Feng Gao, Xianchao Zhao, Jie Chen, Xuewu Cao. (2011) "Transient flow analysis in reactor coolant pump systems during flow coastdown period" Journal of Nuclear Engineering and Design, Vol. 241, PP.509-514. [5] A.D. Vasiliev, A.E Kisselev, V.F. Strihov. (2012)
"Application of thermal hydraulic and severe accident code SOCRAT/V2 to bottom water reflood experiment PARAMETER-SF4" Journal of Nuclear Engineering and Design, Vol. 246, PP.175-184.
[6] A.W.Ezzat and H.M.Taki. (1988) "Final safety report for 14th Tammuz 5000 KW reactor", INC, Iraq nuclear commission under the supervision of IAEA, paragraph 5.4.
[7] Frank Krieth, Raj M. Manglik, and Mark S. Bohn. (2011)
"PRICIPLIES OF HEAT TRANSFER" Cengage Learning Inc. , 7th Edition.
[8] Latif M. Jiji. (2006) "HEAT CONVECTION" Sipringer, 1st Edition.
[9] M.M.El.Wakil. (1962) "Nuclear Power Engineering " McGraw-Hill Book Company, New York.
[10]Michael J. Moran, Howard N. Shapiro, Daisie D. Boettner, and Margaret B. Bailey.(2011)"Fundamentals of Engineering Thermodynamics "JHON WILY and SONS Inc., 7th Edition.
[11]Fox and McDonald’s.(2011) "Introduction to Fluid Mechanics"JHON WILY and SONS, Inc., 8th Edition. [12]D.Butterworth and G.F. Hewitt. (1977)" TWO-PHASE
FLOW AND HEAT TRANSFER" Harwll Series, OXFORD UNIVERSITY PRESS.