Munich Personal RePEc Archive
Evaluation of Dutch election programs:
The impact of parameter uncertainty
Knoben, J. and Kerkhofs, M. and Graafland, J.J.
Tilburg University, Netherlands
2004
Evaluation of Dutch election programs:
The impact of parameter uncertainty
by Joris Knoben*, Marcel Kerkhofs and Johan Graafland Tilburg University
Keywords: Parameter uncertainty, policy evaluation, general equilibrium models, election programs
Abstract (UK)
Shortly before the national elections in the Netherlands, the Netherlands Bureau for Economic Policy Analysis (CPB) evaluates the economic effects of the policy proposals in election programs. This paper investigates the sensitivity of this analysis to the uncertainty of parameter estimates in the economic models that are used. For this purpose, a Monte Carlo analysis of five election programs is performed, using a core version of one of the CPB models. We find that the range of projected outcomes is surprisingly small. Nonetheless, caution remains needed, especially when the estimated effects of different parties are roughly similar.
Abstract (NL)
Kort voor de landelijke verkiezingen in Nederland rekent het Centraal Plan Bureau (CPB) de verkiezingsprogramma’s van de verschillende politieke partijen door. Bij deze doorrekening worden de economische effecten van de verschillende programma’s geschat. Dit paper onderzoekt de gevoeligheid van deze schattingen voor onzekerheid in de parameters die gebruikt worden in de economische modellen. Hiertoe wordt een Monte Carlo analyse uitgevoerd van vijf verkiezingsprogramma’s met behulp van een kleine versie van één van de CPB-modellen. De gevonden onzekerheid in de uitkomsten van het model is verrassend klein. Desalniettemin is voorzichtigheid bij het gebruiken van de resultaten op zijn plaats, zeker wanneer de uitkosten van verschillende politieke partijen dicht bij elkaar liggen.
* Corresponding author: Joris Knoben, Tilburg University, Room S158, Warandelaan 2, P.O. Box 90153, 5000 LE Tilburg, The Netherlands, phone:+31 13 4662111, E-mail: [email protected]
1 Introduction
Prior to national elections in the Netherlands, the Netherlands Bureau for Economic Policy Analysis (CPB) evaluates the economic effects of the policy proposals in election programs. This standing practice was the subject of a conference in April 2002 (Graafland and Ros, 2003). At this conference some participants expressed their concern about the fact that the uncertainty of the predictions is unknown and that model assumptions underlying the analysis cannot be tested. Despite this scholarly criticism, the analysis of election programs plays an important role in the political debate during the pre-election period. The strong influence of the CPB analysis is underlined in the following quotation:
“Since 1986 the larger Dutch political parties seek the CPB’s seal of approval
for their electoral programs. It is a unique phenomenon indeed that CPB
prognoses for employment, income (and its distribution) and the budget deficit
play an important role in the election campaigns. Astonishing as this may
seem to anyone who has ever built or used economic models, popular trust in
the CPB’s numerical precision is so great that a predicted difference of a few
thousand jobs can become the selling point of an election platform.” (Haffner
and Van Bergeijk, 1994)
The program evaluations published by the CPB are often used by politicians and the media as if they are completely certain and accurate, whereas they are in fact likely to be subject to a considerable degree of uncertainty and the predictions may be sensitive to some of the assumptions implicit in the models that are used. Recently some Belgian politicians have expressed their interest in this system and are considering implementing a similar system in Belgium (de Crem 2003). In this perspective this paper tries to evaluate the Dutch system by trying to gain insight into the effect of uncertainty on the CPB analysis of election programs.
This paper investigates parameter uncertainty as one source of uncertainty in the CPB analysis.1 The models usually contain parameters that are estimated in separate econometric analyses. Parameter uncertainty means that the estimated parameter values are surrounded by a confidence interval as expressed by their standard errors. As the predicted effects of economic policies depend on the quantitative values of these model parameters,
1
parameter uncertainty generates uncertainty in the policy effect simulated by the model. For example, the certainty that a tax reduction targeted at low skilled labour reduces low skilled unemployment depends largely on the robustness of the estimated value of the elasticity of substitution between high en low skilled labour. This means that the certainty that the programs of political parties that propose this kind of specific tax reductions is more effective in reducing low skilled unemployment than the programs of parties that propose more general tax reductions to fight unemployment depends on the confidence interval of this parameter.
Until now, the effects of this uncertainty has only been analysed for one parameter at a time and only for some of the possible values of this parameter (Graafland 2001). In this analysis, the effects of implementing the complete range of uncertainty for all parameters simultaneously will be studied. For this purpose, a Monte Carlo analysis is performed on the parameter set of the Mini-MIMIC model. This model is a small version of the MIMIC model, which focuses on long-term labour market effects of the political programs (Bovenberg et al., 2000). The Monte Carlo analysis is a method that calculates all possible ‘what-if’ scenarios by generating random values for uncertain variables (i.e. the model parameters of Mini-MIMIC) by using information of the probability distribution of these variables. Using standard errors (and correlations) of the parameter estimates, we analyze the robustness of the outcomes of the programs of political parties for key policy variables such as unemployment and employment.
2 The CPB analysis of the Dutch election programs and sources of uncertainty
A main task of CPB is to analyse the economic consequences of policy proposals (Donders and Graafland, 1988). The analysis of election programs by the CPB began in 1986. In that year the three largest political parties (CDA, PvdA and VVD)2, asked the CPB to analyse their election programs. Since then, five more parties have followed this initiative (CPB, 2002). The scope of the analysis has gradually widened over the years. In 1986 only the budgetary effects and the economic consistency of the proposed policies were evaluated. Nowadays the contents of the CPB analysis cover four areas:3
- effects on the public budget,
- estimated macroeconomic effects (for example, estimated (un)employment effects), - effects on the income distribution of different types of households,
- in-depth research of a specific topic (such as the reforms of the health care sector). The analysis is based on multiple methods, ranging from simple spreadsheet programs to large macroeconomic models. In this paper, we focus on the second part: the prediction of macroeconomic effects using large-scale economic models. JADE is the most important model that is used for this purpose.4 In order to take account of the effects of specific policies, the outcomes of JADE are adjusted and disaggregated on the basis of simulation outcomes of other large models. For this purpose, the CPB uses MIMIC to analyze the labour market effects of changes in the tax- and social security system (Graafland et al., 2001) and ATHENA to analyze policy that targets individual sectors.
2.1 Sources of uncertainty
The CPB analysis has several merits and limitations.5 One such limitation is that the analysis provides no insight in the robustness of the outcomes. We therefore do not know how conclusive the predictions of the relative performance of the political programs really are. The CPB itself emphasizes that the predictions are uncertain and warns not to focus on the exact outcomes of the analysis but rather on the relative positions of the political parties. However, one look in the Dutch newspapers during election time shows that this
2
See table 1 in section 3 for a brief description of the political parties considered.
3
For a description of the CPB analysis and the procedures followed, see Don (2003).
4
recommendation is widely ignored. Moreover, the impact of uncertainty may not only be restricted to the absolute size of policy effects, but may also affect conclusions about the relative performance of the election programs. Performing an ex-ante uncertainty analysis could provide insight into the uncertainty of the predicted effects.
Uncertainty about the macroeconomic effects predicted by large models has several sources. Graafland (2003) distinguishes five sources: the selection of economic mechanisms in the models, the specification of the economic theories that describe these mechanisms, the empirical specification of the models, the integration of the results of different models, and the uncertainty following from the fact that not all of the proposals and all of the effects can be analysed quantitatively by the CPB. With respect to the latter point, Bomhoff has criticized the CPB for not taking the economic effects of less crime or a better infrastructure into account (see Bomhoff (1994) and Bomhoff and Van der Geest (2003)). The effect of model selection can easily be seen by comparing the predictions from different models. The differences are often substantial (Graafland, 2003). The impact of economic theory can be seen from the evolution of economic models after the new-classical uprising against the dominant Keynesian paradigm in the 1970’s (e.g.: Diebold (1998), pp 175-192). The latter example also shows that a paradigm shift does not necessarily lead to more accurate predictions. Don (2001) further specifies the effect of model specification on forecast accuracy and distinguishes four elements: preliminary data, prediction of non-policy exogenous variables, model parameters and the model residuals. Don finds that the uncertainty in the predictions is rather large. The average forecast error in annual growth rates (four year ahead) is 1.7% for consumption and 1.1% for production enterprises. This uncertainty is predominantly caused by uncertainty about the values of non-policy exogenous variables and the model residuals in the model equations.
The CPB has regularly studied the (ex-post) forecast accuracy of their models. These studies do not indicate a decrease in the uncertainty of the predictions over the last decade (Donders and Kranendonk, 1999). Considerable progress has been made as compared to the first pioneering econometric models, but recent years show no further reduction of the forecast uncertainty. In fact, it will take a lot of effort to keep the error margins at its current level. Many economists have argued that we will not be able to reach a higher level of accuracy in the future (Klein, 1981). Since total model uncertainty is not very likely to decrease much further over time, it is essential to study the potential of an ex-ante uncertainty analysis.
5
In this paper we focus on the impact of parameter uncertainty and disregard the influence from other sources. This means that we abstract from the fundamental sources of model miss-specification mentioned by Graafland (2003). We only investigate the impact of parameter uncertainty on the economic outcomes of a given economic model. The standard errors and the correlation matrix of the estimates provide a quantitative assessment of the size of this uncertainty. The other sources of uncertainty with respect to forecast accuracy specified by Don (2001) - uncertainty in preliminary data, prediction of non-policy exogenous variables and the unobserved variation that constitutes the error terms - impact the base line prediction in a similar fashion as the policy scenarios. In linear models the uncertainty from these sources is irrelevant, because the change in the simulation path will be equal to the change in the baseline prediction, rendering no effect on policy simulation. In non-linear models there is some impact. However, it is usually of secondary importance. On the other hand, changing the parameters associated with the policy variables and the variables that are endogenous to the model will even in a linear model change the outcome of the policy scenario not in the same way as the baseline scenario, thus changing the predicted policy effect.6
2.2 Monte Carlo analysis
Focusing only on parameter uncertainty allows a very systematic analysis. For this purpose, we apply the so-called Monte Carlo method. A Monte Carlo analysis basically calculates all possible “what-if” scenarios, assuming that uncertainty can be characterized by a known probability distribution. The outcome of every scenario is weighed by the probability it occurs. To apply this to the case of parameter uncertainty, a joint probability distribution of all uncertain parameters is constructed. For every scenario a random draw is taken from this distribution and the model is solved using these parameter values. This process is repeated as many times as necessary. The result is a distribution of outcomes, in which the probability with which a certain outcome may occur is instantly clear. This is an important advantage over the “what-if” method of sensitivity analysis that tests the robustness of the outcomes for a limited set of alternative parameter values of which the probability is
6
unknown (Vose, 1996).7 For an application of this type of sensitivity analysis to the MIMIC model, see Graafland et al. (2001).
A disadvantage of the Monte Carlo method is that it may be time consuming and complicated for large economic models used by the CPB. Even though modern computers are capable of these computations, many practical and theoretical problems can arise. This might explain why CPB has never performed Monte Carlo analyses with large economic models such as JADE, MIMIC and Athena. For researchers from outside the CPB who do not have access to these models it is impossible to do so. For this reason, we use a smaller version model of one of the large CPB models. As the CPB has not developed a small version of JADE, we use a core version of MIMIC: the Mini-MIMIC model. The main building blocks are very similar to those in MIMIC and JADE and partly based on empirical research that was used for both models. The most important equation – the wage equation – is even exactly identical to the wage equation in MIMIC. As shown by a sensitivity analysis in Graafland et al. (2001), the wage equation produces most of the variation in outcomes. The Monte Carlo analysis of simulation results of Mini-MIMIC will therefore provide a good indication of the uncertainty of the analysis with large-scale CPB models.
3 Election programs in Mini-MIMIC
The Mini-MIMIC model is a small-scale applied general equilibrium model, and was developed by the CPB to make the structure of the full MIMIC model more transparent.8 Essentially, Mini-MIMIC describes the main relationships in the MIMIC model in a nutshell. In this section, we analyze whether Mini-MIMIC is also capable to reproduce the main results of the MIMIC analysis of election programs.
3.1 Main features of Mini-MIMIC
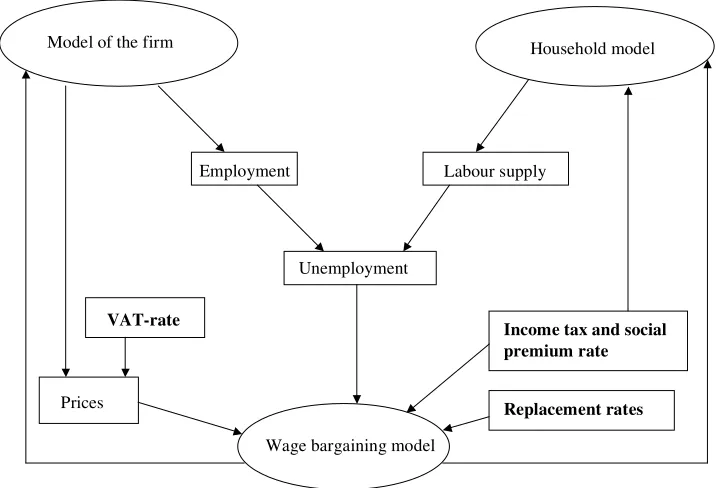
Mini-MIMIC distinguishes between various types of labour (skilled and unskilled labour). Figure 1 reviews the most important relations between institutions and the labour market in Mini-MIMIC that hold for both types of labour. An increase in the VAT rate raises the (consumer) price leading to higher wage claims in order to compensate for the loss in
7
For a discussion of other advantages of the Monte Carlo method, see Vose (1996).
8
purchasing power (so-called wage resistance). A similar wage effect results from a rise in the direct tax rate (defined as the sum of income tax and social premiums). On top of this, an increase in the marginal tax rate has a negative impact on labour supply because of the substitution effect, whereas an increase in the average tax rate has a positive impact because of the income effect. Furthermore, the replacement rate (defined as the ratio between net unemployment benefit and net wage) has a positive impact on wages by enforcing the threat point of employees in the wage bargaining process.
Figure 1: Main links in the Mini-MIMIC model
Replacement rates
Model of the firm Household model
VAT-rate
Income tax and social premium rate
Prices
Wage bargaining model
Employment Labour supply
Unemployment
The rise in gross wages deteriorates the competitiveness of Dutch companies and lowers employment. The confrontation of employment and labour supply yields the unemployment, which has a negative impact on wages because unemployment weakens the bargaining power of workers. The model implies that the equilibrium level of unemployment depends positively on the VAT rate, the direct tax rate and the replacement rate.
3.2 Applying Mini-MIMIC to election programs
the election programs. Since then, the CPB has not published the MIMIC results separately, nor the assumptions made about the policy proposals in the MIMIC-analysis. We will therefore use the 1998 evaluation of election programs for our analysis of parameter uncertainty.
Table 1: Main points of the electoral programs in 1998
Acronym
Name in
English Profile Main points of the election program
PvdA Labour party Social
democratic
Decrease the marginal tax rate in the first tax bracket Increase the high VAT rate
Replace basic allowance by labour based tax credit
Core: Tax reduction for lower incomes, stimulate labour supply of women
VVD People’s party
for freedom and democracy
Conservative liberal
Lower all marginal tax rates Increase the high VAT rate
Introduction of a tax credit for workers
Abolish specific payroll tax cuts for unskilled wages
Core: lower tax burden for all workers, more incentives to accept work
CDA Christian
Democratic Appeal
Christian democratic
Lengthen the first tax bracket Increase the low and high VAT rate Decrease all marginal tax rates slightly
Core: a slightly lower tax burden for workers
D66 Democrats 66 Social liberal Lower all marginal tax rates
Increase the high VAT rate Introduction of an EITC
Core: a lower tax burden for all workers, more incentives for unskilled labour supply by EITC
GroenLinks Green Left Progressive
environmentalist
Decrease the marginal tax rate in the first tax bracket Decrease the length of the second and third tax bracket Increase the high VAT rate
Introduce an EITC
Core: a far more progressive tax system, incentive for unskilled labour supply by EITC
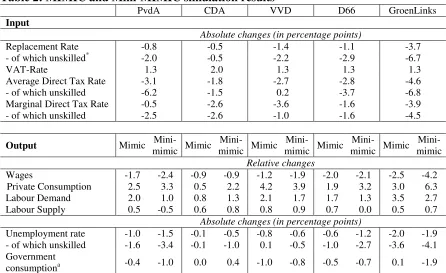
Mini-MIMIC. The long-term costs of the PvdA proposals for the government amount to 1% of GDP. The main explanation for the difference in the long-term costs between the two models lies in the difference in the tax revenues due to differences in labour supply.
[image:11.595.74.520.349.622.2]The effects of the policy proposals of the CDA are relatively small. In fact these “disappointing” results of the CDA policy proposals were used against them in the election campaign of 1998. The drop in the replacement rates (-0,5 %-points, which is quite small) results in a small decline in the wages (-0,9 %) and unemployment (-0,5 %-points). Net wages increase, due to the reduction of the average tax rate (-1,8 %-points), and private consumption grows (2,2 %). As a result of the decrease in the marginal tax rate, labour supply increases (0,8 %). The effect on government consumption is larger than that predicted by MIMIC since both the increase in labour supply and the decrease in unemployment generate higher tax revenues in Mini-MIMIC.
Table 2: MIMIC and Mini-MIMIC simulation results9
PvdA CDA VVD D66 GroenLinks
Input
Absolute changes (in percentage points)
Replacement Rate -0.8 -0.5 -1.4 -1.1 -3.7 - of which unskilled* -2.0 -0.5 -2.2 -2.9 -6.7 VAT-Rate 1.3 2.0 1.3 1.3 1.3 Average Direct Tax Rate -3.1 -1.8 -2.7 -2.8 -4.6 - of which unskilled -6.2 -1.5 0.2 -3.7 -6.8 Marginal Direct Tax Rate -0.5 -2.6 -3.6 -1.6 -3.9 - of which unskilled -2.5 -2.6 -1.0 -1.6 -4.5
Output Mimic
Mini-mimic Mimic
Mini-mimic Mimic
Mini-mimic Mimic
Mini-mimic Mimic Mini-mimic
Relative changes
Wages -1.7 -2.4 -0.9 -0.9 -1.2 -1.9 -2.0 -2.1 -2.5 -4.2 Private Consumption 2.5 3.3 0.5 2.2 4.2 3.9 1.9 3.2 3.0 6.3 Labour Demand 2.0 1.0 0.8 1.3 2.1 1.7 1.7 1.3 3.5 2.7 Labour Supply 0.5 -0.5 0.6 0.8 0.8 0.9 0.7 0.0 0.5 0.7
Absolute changes (in percentage points)
Unemployment rate -1.0 -1.5 -0.1 -0.5 -0.8 -0.6 -0.6 -1.2 -2.0 -1.9 - of which unskilled -1.6 -3.4 -0.1 -1.0 0.1 -0.5 -1.0 -2.7 -3.6 -4.1 Government
consumptiona -0.4 -1.0 0.0 0.4 -1.0 -0.8 -0.5 -0.7 0.1 -1.9
a
In % of GDP. Government consumption is adjusted to close the government budget. This is a standard procedure in MIMIC simulations (see Graafland et al, 2001).
Source: CPB (1998) and own computations
The effect of the VVD program on the unemployment levels is relatively small, especially for the unskilled (-0,5 %-points). As a result of the lower average tax rate for skilled labour (-2,7 %-points), skilled unemployment declines. Unskilled unemployment hardly changes,
9
since the drop of the replacement rate (-2,2 %-points) is balanced by a lower marginal tax rate (-1,0 %-points) (which raises unskilled wages, see above) and a rise in the average tax and social premium rate due to the abolishment of the payroll tax cut for unskilled labour (0,2 %-points). Labour supply is stimulated through the substitution effect (0,9 %). The long-term costs of these plans for the government amount to 0.8% of GDP.
The policy proposals of D66 are a mixture of the PvdA and VVD proposals. Just as in the case of the PvdA, the Mini-MIMIC model produces quite different labour supply effects than MIMIC. The main reason here is that D66 proposes an Earned Income Tax Credit (EITC) that is phased out between 115% and 150% of the Legal Minimum Wage, which generates a high marginal tax rate in this income range. In Mini-MIMIC the rise in the marginal tax rate decreases labour supply. In MIMIC, however, this negative labour supply effect does not arise, as MIMIC accounts for the fact that the EITC proposed by D66 is only related to the wage per hour and does not change with the number of hours supplied. GroenLinks targets mainly unskilled labour, both by an EITC and the introduction of a tax credit that encourages labour supply of part-timers. The effects of the GroenLinks policy are large, especially in the unskilled sector. The effects are quite similar to those of the other parties, except for the fact that the effects of the GroenLinks policy are bigger, due to the large changes in the model input.
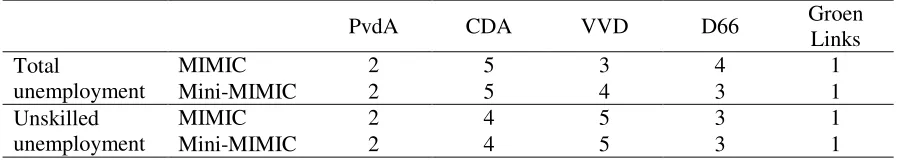
[image:12.595.73.527.700.780.2]On the whole, we can derive two conclusions from the comparison of the MIMIC and mini-MIMIC results. On the one hand, the trends predicted by the Mini-MIMIC model are similar to those of the MIMIC model. The two main differences lie in the higher level of aggregation of the labour market in Mini-MIMIC, and the fact that an EITC cannot be implemented in Mini-MIMIC in the same way as in MIMIC. These differences explain why Mini-MIMIC does not simulate the labour supply effects of PvdA and D66 accurately. For the unemployment rate, however, the trends are similar. This holds both for total unemployment and unskilled unemployment. For these important policy variables, the relative ranking of the different parties is almost identical for both models (see Table 3). The only difference between the two models is the position of D66 and VVD in the total unemployment ranking.
Table 3: Rankings compared between MIMIC and Mini-MIMIC
PvdA CDA VVD D66 Groen
Links Total
unemployment
MIMIC 2 5 3 4 1
Mini-MIMIC 2 5 4 3 1
Unskilled unemployment
MIMIC 2 4 5 3 1
On the other hand, the differences between Mini-MIMIC and MIMIC of the simulation effects are considerably if considered from a policy point of view. The absolute difference in unemployment reduction ranges from 6 thousand persons (for GroenLinks) to 36 thousand persons for D66. This illustrates a point discussed by Graafland (2003) that models based on the same empirical research can still yield very different results for complex packages of policy proposals because of differences in the details of the models.
4 Monte Carlo analysis
The Mini-MIMIC model contains 17 parameters.10 Eight of these parameters result from econometric estimation, one is a dummy variable, and the others are directly based on preliminary data. The estimated parameters concern the labour supply equation, the wage equation, the employment equation, the import equation and the export equation. The estimated parameters in the labour supply equation represent the relative preference for consumption over leisure (du and ds, for unskilled and skilled workers respectively). In
Mini-MIMIC these parameter values determine the elasticity of substitution between consumption and leisure. The estimated parameters in the wage equation represent the bargaining power of employers relative to unions ( ), the productivity in the informal sector relative to the formal sector ( ) and the relative importance of the formal sector relative to the informal sector ( w). These parameters determine the impact of the average and marginal
income tax and social premium rate, the VAT rate, replacement rate and unemployment rate on wages. The remaining three parameters are the elasticity of substitution between high-skilled and the low-high-skilled labour ( ), the elasticity of substitution between domestic and foreign goods ( ) and the price elasticity of export demand ( ). For the parameters that are econometrically estimated, standard errors are known (see Table 4). These standard errors (and correlations between parameters that were estimated simultaneously) determine the asymptotically valid normal distribution that is used to analyze the impact of parameter uncertainty in the Mini-MIMIC model. A thousand replications of the model were made using Eviews software. For each version of the model a different set of parameters was drawn at random from the joint parameter distribution. All other variables, parameters and exogenous variables were kept constant. By analogy with the calibration procedure of MIMIC, the Mini-MIMIC model contains scale factors that are automatically adjusted in
10
order to keep the baseline scenario the same for all parameter sets. In calibrating the model, this use of scale factors guarantees that for different values of the parameters (elasticities mostly) the outcomes match the preliminary data in the base year. For our analysis this has the advantage that the baseline scenario is the same in all replications. Similarly, all predicted policy effects are relative to the baseline scenario.
Table 4: Parameters and their standard errors
Equation Wage Demand for low/high skilled labour
Import Export Labour supply Parameter w ds du
Value 20.4 0.94 0.44 1.5 1.5 2.0 17.5*10-6 55.7*10-6 Standard error 6.5 a 0.02 a 0.23 a 0.04 b 0.36 b 0.12 b 4.4*10-6 c 13.8*10-6 c
a
Based on Graafland and Huizinga (1999) and Graafland et al. (2001)
b
Based on Draper (2000)
c
Based on the range of estimates reported in Table 4.1 in Graafland et al. (2001)
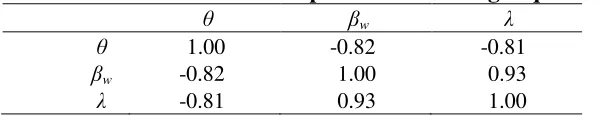
Table 5: Correlation between parameters of wage equation
w
1.00 -0.82 -0.81
w -0.82 1.00 0.93
-0.81 0.93 1.00
The effects of parameter uncertainty on the Mini-MIMIC predictions for all political programs are presented in Table 6. The table shows that political programs with little policy changes (CDA, VVD) have a relatively low level of uncertainty, whereas programs that propose many new policies (PvdA, D66, GroenLinks) have a relatively high level of uncertainty. This observation is in line with the expectations. In the extreme case that a party would propose no policy changes the policy scenario would be identical to the baseline scenario and thus would by definition have no uncertainty about the difference between the policy and baseline scenario. On average, the uncertainty is small but not negligible. The total unemployment effect for the program of GroenLinks for example, lies between -1.6% and -2% (90% confidence interval). On the whole the ranking of the parties is stable and the uncertainty margins on the absolute values is surprisingly small.
[image:14.595.73.373.391.449.2]correlations in the Monte Carlo analysis would lead to an incorrect assessment of the effect of parameter uncertainty.11
Table 6: Election programs with parameter uncertainty
Average changea PvdA CDA VVD D66 GroenLinks Unemployment rateb -1.4 -0.6 -0.7 -1.2 -1.9 - Skilled -0.7 -0.4 -0.8 -0.6 -1.0 - Unskilled -3.5 -1.2 -0.7 -2.8 -4.1 Employmentc 1.1 1.5 1.7 1.4 2.7 Private consumptionc 3.5 2.6 4.0 3.4 6.2 Lower/Upper bound (5%) L U L U L U L U L U Unemployment rate -1.7 -1.1 -0.7 -0.4 -0.8 -0.6 -1.4 -1.0 -2.0 -1.6 - Skilled -0.9 -0.4 -0.5 -0.3 -0.8 -0.7 -0.7 -0.5 -1.1 -0.9 - Unskilled -4.0 -3.1 -1.4 -0.9 -0.9 -0.5 -3.2 -2.4 -4.4 -3.7 Employment 0.8 1.3 1.2 1.7 1.4 2.0 1.2 1.6 2.5 2.9 Private consumption 3.1 4.0 1.8 3.4 3.5 4.6 2.9 3.9 5.7 6.7
a
Average change compared to baseline path.
b
Absolute change compared to baseline path.
c
Percentage change compared to baseline path.
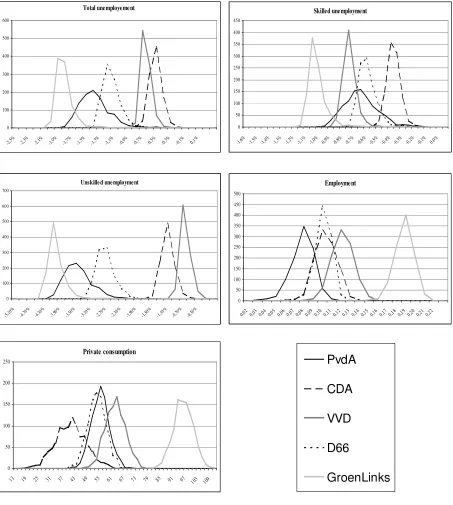
Figure 2 shows the probability densities of the total unemployment rate, skilled unemployment rate, unskilled unemployment rate, employment and private consumption. For total unemployment, the different distributions of PvdA and VVD overlap with other distribution functions, but the distribution function of Groen Links, D66 and CDA do not intersect, reflecting stochastic dominance. If the distributions of the outcomes of two election programs can be ordered by stochastic dominance it is possible – and in applications like these very likely – that the uncertainty has an effect on the levels of the outcome variable, but not on the rank order of the election programs with respect to that outcome. A more or less similar situation holds for the distributions of the unskilled and skilled unemployment rate. For private consumption the overlaps are larger – in particular between PvdA and D66 – but the distributions of CDA, VVD and Groen Links still have the property of stochastic dominance. For employment most distributions can no longer be ordered by stochastic dominance. Without knowing the correlation between the outcomes, it implies that for some pairs of parameter vectors the relative position of these parties must be different.
11
Figure 2: Distributions of predicted effects relative to the baseline scenario
In the probability distributions in Figure 2 uncertainty is introduced for all parameters simultaneously. This raises the question for which parameters the predictions are most sensitive. For this purpose we now look at the uncertainty caused by five subsets of parameters separately: the elasticity of substitution between products of the high-skilled and the low-skilled sector ( ), the price elasticity of export demand ( ), the elasticity of substitution between domestic and foreign goods ( ), the parameters in the labour supply equation (du and ds) and the parameters in the wage setting equation ( , w and ). Table 7
Total unemployement 0 100 200 300 400 500 600
-2,5% -2,3% -2,1% -1,9% -1,7% -1,5% -1,3% -1,1% -0,9% -0,7% -0,5% -0,3% -0,1% 0,1%
Skilled unemployment 0 50 100 150 200 250 300 350 400 450
-1,6% -1,5% -1,4% -1,3% -1,2% -1,1% -1,0% -0,9% -0,8% -0,7% -0,6% -0,5% -0,4% -0,3% -0,2% -0,1% 0,0%
Unskilled unemployment 0 100 200 300 400 500 600 700 -5,10 % -4,70 % -4,30 % -3,90 % -3,50 % -3,10 % -2,70 % -2,30 % -1,90 % -1,50 % -1,10 % -0,70 % -0,30 % Employment 0 50 100 150 200 250 300 350 400 450 500
0,02 0,030,04 0,05 0,06 0,070,08 0,090,100,11 0,120,13 0,140,15 0,16 0,17 0,18 0,19 0,200,210,22
Private consumption 0 50 100 150 200 250
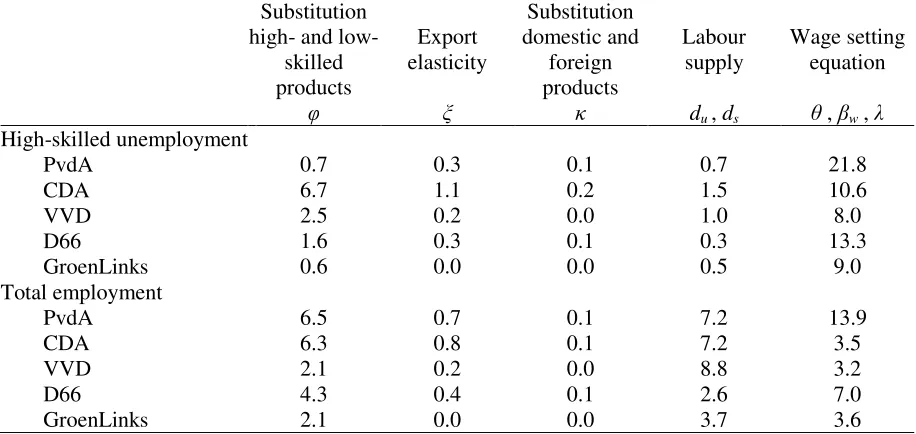
shows the results for the uncertainty of the predicted policy effects for the unemployment rate of skilled workers and for total employment. Uncertainty of the predictions is expressed as coefficients of variation (standard deviation divided by the mean of the policy effect). The results show that for skilled unemployment the uncertainty of the wage setting equation drives most of the uncertainty. The elasticity of substitution between high- and low-skilled labour has the second largest impact, followed by the parameters of the labour supply equation. The impact of the uncertainty about the other two parameters is negligible. Similar findings apply to the uncertainty with regard to total employment. The uncertainty of the wage setting equation is still the most important source of the total uncertainty. The parameters of the labour supply equation take the second place, whereas the elasticity of substitution between high- and low skilled labour takes the third place. Again, the other two variables have a negligible impact on the total uncertainty.
Table 7: Uncertainty of predicted policy effects for subsets of parameters (coefficients of variation, in %-points)
Substitution high- and
low-skilled products
Export elasticity
Substitution domestic and
foreign products
Labour supply
du , ds
Wage setting equation
, w,
High-skilled unemployment
PvdA 0.7 0.3 0.1 0.7 21.8
CDA 6.7 1.1 0.2 1.5 10.6
VVD 2.5 0.2 0.0 1.0 8.0
D66 1.6 0.3 0.1 0.3 13.3
GroenLinks 0.6 0.0 0.0 0.5 9.0
Total employment
PvdA 6.5 0.7 0.1 7.2 13.9
CDA 6.3 0.8 0.1 7.2 3.5
VVD 2.1 0.2 0.0 8.8 3.2
D66 4.3 0.4 0.1 2.6 7.0
GroenLinks 2.1 0.0 0.0 3.7 3.6
Table 8: Rankings and their probability of occurrence
Initial ranking Probability of
other ranking
PvdA CDA VVD D66 Groen-
Links
Unemployment rate 2 5 4 3 1 0 %
- high skilled 3 5 2 4 1 46 %
- unskilled 2 4 5 3 1 1 %
Employment 5 4 2 3 1 68 %
[image:17.595.75.521.633.751.2]Table 8 shows that the rankings of the different political programs with respect to the reduction of total unemployment and unskilled unemployment and the increase in private consumption are rather insensitive to changes in the parameter set. The main reason is that the effects of different parameter sets on the outcomes of the different policy proposals are highly correlated. As a result, the absolute values for all parties move in the same direction when the parameters set changes. The ranking for skilled unemployment and total employment are, however, very sensitive for changes in the parameters, because the average change in skilled unemployment rates and total employment for different parties were already close to each other in the base simulations reported in Table 2.
Table 9 reports the probabilities of the alternative rankings for these two targets. For the unemployment rate of high-skilled workers the uncertainty mainly affects the second, third and fourth position in the ranking. In the median ranking (no parameter uncertainty) PvdA comes third, but in 23 percent of the simulations it takes a second position and in another 23 percent it is in fourth or fifth place. For total employment the median ranking applies only to one third of the simulated rankings. In almost twice as many simulations the third and fourth position are interchanged.
Table 9: Alternative rankings for the high-skilled unemployment rate and total employmenta
High-Skilled Unemployment Rate
1 2 3 4 5 %
GroenLinks VVD D66 CDA PvdA 4,0
GroenLinks VVD D66 PvdA CDA 18,9
GroenLinks VVD PvdA D66 CDA 54,3
GroenLinks PvdA VVD D66 CDA 19,6
GroenLinks PvdA D66 VVD CDA 3,2
Total Employment
1 2 3 4 5 %
GroenLinks VVD CDA D66 PvdA 61,4
GroenLinks VVD D66 CDA PvdA 32,5
GroenLinks VVD D66 PvdA CDA 2,5
GroenLinks D66 VVD PvdA CDA 3,0
GroenLinks PvdA D66 VVD CDA 0,6
a
The initial ranking is presented in bold
5 Summary
[image:18.595.75.536.458.648.2]analyzed, so did the impact of the results of the analysis. Since the impact of the CPB analysis is large nowadays, it is very important to keep track of the advantages and disadvantages of the CPB analysis.
The literature shows that the CPB analysis has some major advantages, but some disadvantages as well. The main advantage is that political parties cannot make any false promises to the public. All parties have to explain what they want and how to raise the funds for their plans. Since all parties are compared to the same baseline scenario and the same procedure is used for all parties, comparability of results between parties is possible. The main disadvantage is the fact that there is no insight in the uncertainty that surrounds the CPB predictions, due to the fact that the CPB does not perform multiple scenario studies to visualize uncertainty.
This paper investigates one source of uncertainty in the CPB analysis, namely the uncertainty associated with the estimation of model parameters. This parameter uncertainty is studied by performing a Monte Carlo analysis of the electoral programs with the help of a small version of the MIMIC model of the CPB named Mini-MIMIC. For most parties the results of Mini-MIMIC are roughly similar to the ones of the MIMIC model.
Overall, our analysis indicates that the CPB analysis of the election programmes is rather robust. However, it should be noted that this paper only researches one source of uncertainty, namely the uncertainty in estimated parameters of a given economic model. The comparison between MIMIC and mini-MIMIC shows, for example, much larger divergences, because of differences in the more specific details of the models. Graafland (2003) shows that differences become even more pronounced if two or more economic independent institutes analyse the electoral programs with models that are developed by independent teams of economists. The overall uncertainty in policy analysis of election programmes is therefore larger than indicated by our Monte-Carlo analysis with the mini-MIMIC model.
References
Bomhoff, E.J., 1994. Het Centraal Plan Bureau en lagere belastingen, Economisch Statistische Berichten, 79, 3955, 289.
Bomhoff, E.J. and L. van der Geest, 2003. Food for Politicians, not for Voters, in: Graafland and Ros (Eds.), Economic Assessment of Election Programs; does it make sence?, Kluwer Academic Publishers, Dordrecht, 107-112.
Bovenberg, A.L., J.J. Graafland and R.A. de Mooij, 2000. Tax Reform and the Dutch Labour Market: An Applied General Equilibrium Approach, Journal of Public Economics, 78, 193-214.
CPB, 1998. De economische effecten van vijf verkiezingsprogramma’s, Sdu Uitgevers, The Hague.
CPB, 2002. Keuzes in kaart 2003-2006. Economische effecten van 8 verkiezingsprogramma’s, Sdu Uitgeverij, The Hague.
Crem, P. de, 2003. Pieter de Crem wil doorlichting van verkiezingsprogramma’s, Press Bulletin of the CD&V, available on www.cdenv.be/actueel/persberichten/2003/1/.
Derksen, A.A., 1996. Wetenschap of willekeur; wat is wetenschap?, Coutinho, The Hague.
Diebold, F.X., 1998. The past, present and future of Macroeconomic forecasting, Journal of Economic Perspective, 12, 2, 175-192.
Don, F.J.H., 2003. Economic analysis of election programs: What, how and why?, Economic Assessment of Election Programs; does it make sence?, Kluwer Academic Publishers, Dordrecht, 21-30.
Donders, J. and J.J. Graafland, 1998. CPB models and employment policy in the Netherland, Economic Modelling, 15, 341-56.
Donders, J. and H. Kranendonk, 1999. The accuracy of CPB forecasts, CPB-report, available on www.cpb.nl.
Draper, D.A.G., 2000. Towards an econometric model for the Netherlands: explaining unemployment, Phd thesis, Tilburg University, 77-78.
Graafland, J.J. and F.H. Huizinga, 1999. Taxes and benefits in a non-linear wage equation, De Economist, 147, 39-54.
Graafland, J.J., 2000. Child care subsidies, labour supply and government finance, Economic Modelling, 17, 209-46.
Graafland, J.J., R.A. de Mooij, A.G.H. Nibbelink and A. Nieuwenhuis, 2001. MIMICing tax policies and the labour market, North-Holland.
Graafland, J.J., 2003. Balancing information and uncertainty, Economic Assessment of Election Programs; does it make sence?, Kluwer Academic Publishers, Dordrecht, 61-80.
Graafland, J.J. and A.P. Ros, 2003. Economic Assessment of Election Programs; does it make sence?, Kluwer Academic Publishers, Dordrecht.
Haan, F., 2004. Iedereen scoort beter dan het kabinet, Volkskrant 21-09-2004.
Haffner, R.C.G. and P.A.G. van Bergeijk, 1994. The economic consequences of Dutch politics, De Economist, 142, 4, 497-505.
Klein, L.R., 1981. Econometric models as guides for decision-making, The Charles C. Moskowitz Memorial Lectures, New Your University.
Velthuis, O., 2004. Groeiverwachting is geen cijfer, maar een verhaal, Volkskrant 15-09-2004.
Appendix The Mini-MIMIC model
The core of the Mini-MIMIC model consists of the following equations (see Bovenberg, Graafland
and De Mooij (2000) for a detailed description and comparison to the MIMIC model). The variables
of the model are defined in table A.1. Subscripts s and u denote the skilled and unskilled sector
respectively.
Wages and labour costs
(1)
(
)
(
)
u s i R U TM TA TM P P P h W i i w i i i i c w i ii , ,
) 1 ( 1 1 1 1 1 ) 1 ( ) 1 ( 1 = − ⋅ − ⋅ − ⋅ − − ⋅ + − ⋅ ⋅ ⋅ − ⋅ + ⋅ ⋅ = β θ λ β θ
(2) i s u
S U L W Pl i i i i
i 1 , = ,
⋅ ⋅ ⋅ + ⋅
= ν ω
Price indices
(3) i s u
h Pl P i i i i
i , ,
1 ⋅ =
− = η η (4) ) 1 /( 1 1
1 (1 )
φ φ φ − − − + − ⋅ ⋅
= s u
y b P b P
P
(5) (1 ) (1 )
) 1 /( 1 1 1 TI P c P c
Pc = ⋅ y + − ⋅ m ⋅ +
− − − κ κ κ
Labour supply, labour demand and unemployment
(6) i s u
P TM W P TA W d d N S c i i c i i i i i
i , ,
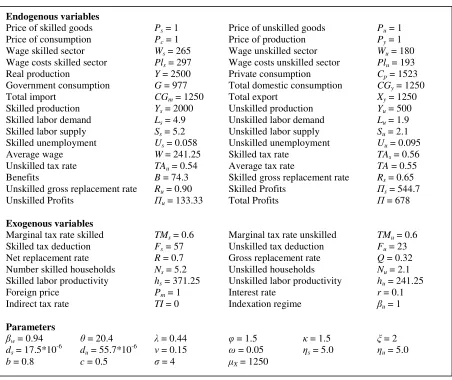
Endogenous variables
Price of skilled goods Ps = 1 Price of unskilled goods Pu = 1
Price of consumption Pc = 1 Price of production Py = 1
Wage skilled sector Ws = 265 Wage unskilled sector Wu = 180
Wage costs skilled sector Pls = 297 Wage costs unskilled sector Plu = 193
Real production Y = 2500 Private consumption Cp = 1523
Government consumption G = 977 Total domestic consumption CGy = 1250
Total import CGm = 1250 Total export Xy = 1250
Skilled production Ys = 2000 Unskilled production Yu = 500
Skilled labor demand Ls = 4.9 Unskilled labor demand Lu = 1.9
Skilled labor supply Ss = 5.2 Unskilled labor supply Su = 2.1
Skilled unemployment Us = 0.058 Unskilled unemployment Uu = 0.095
Average wage W = 241.25 Skilled tax rate TAs = 0.56
Unskilled tax rate TAu = 0.54 Average tax rate TA = 0.55
Benefits B = 74.3 Skilled gross replacement rate Rs = 0.65
Unskilled gross replacement rate Ru = 0.90 Skilled Profits s = 544.7
Unskilled Profits u = 133.33 Total Profits = 678
Exogenous variables
Marginal tax rate skilled TMs = 0.6 Marginal tax rate unskilled TMu = 0.6
Skilled tax deduction Fs = 57 Unskilled tax deduction Fu = 23
Net replacement rate R = 0.7 Gross replacement rate Q = 0.32 Number skilled households Ns = 5.2 Unskilled households Nu = 2.1
Skilled labor productivity hs = 371.25 Unskilled labor productivity hu = 241.25
Foreign price Pm = 1 Interest rate r = 0.1
Indirect tax rate TI = 0 Indexation regime u = 1
Parameters
w = 0.94 = 20.4 = 0.44 = 1.5 = 1.5 = 2
ds = 17.5*10-6 du = 55.7*10-6 = 0.15 = 0.05 s = 5.0 u = 5.0
b = 0.8 c = 0.5 = 4 X = 1250
(7) i s u
h Y L
i i
i = , = ,
(8) i s u
S L U
i i
i =1− , = ,
Profits
(9) Πi =Pi ⋅Yi −Pli⋅Li, i=s,u
[image:23.595.76.528.316.696.2](10) Π=Πs +Πu
Consumption and production (11) c u u u s s s u u u s s s p P B U S B U S TA Pl L TA Pl L
C = ⋅ ⋅(1− )+ ⋅ ⋅(1− )+ ⋅ ⋅ + ⋅ ⋅ +Π
(12) c u u u s s s p c u u u s s s P B U S B U S C P TI TI TA Pl L TA Pl L G ⋅ ⋅ − ⋅ ⋅ − ⋅ ⋅ + + ⋅ ⋅ + ⋅ ⋅ = 1
(13) (C G)
P P c CG p c Y
y = ⋅ ⋅ +
−κ
(14) (1 ) (C G)
P P c CG p c m
m = − ⋅ ⋅ +
−κ (15) ξ µ − ⋅ = m y x y P P X
(16) Y =CGy +Xy
(17) Y P P b Y y s
s = ⋅ ⋅
−φ (18) Y P P b Y y u
u = − ⋅ ⋅
−φ
) 1 (
Taxes and benefits
(19) i s u
L Pl F TM TA i i s i
i , = ,
⋅ − = (20) u u s s u u u s s s L Pl L Pl L Pl TA L Pl TA TA ⋅ + ⋅ ⋅ ⋅ + ⋅ ⋅ = (21) u s u u s s L L L W L W W + ⋅ + ⋅ =
In order to reproduce the MIMIC analysis of the electoral programs, three sets of equations were
slightly adapted. Firstly, equations (22) make a different replacement rate between skill levels
possible. This is necessary since some policy proposals explicitly target the replacement rate of a
certain skill level. Secondly, in equations (19) a separate marginal tax rate is introduced for each of
the two sectors. This was necessary since some parties targeted their tax proposals on a certain part
of the labour force. Thirdly, equations (5) and (12) implement changes in the VAT-tariff (BTW).
The average tax rate published by the CPB excludes changes in the VAT-tariffs. However, since
most parties propose changes in the VAT-tariffs, implementation of a VAT-tariff in Mini-MIMIC
was necessary.
For the translation of MIMIC input into Mini-MIMIC input a number of steps were followed:
1. Adjust the replacement rates for both high and unskilled types in accordance with CPB
(1998).
2. Adjust the VAT-tariff in accordance with policy proposals as described by the CPB.12
3. Adjust the marginal income tax rates. The change in the total marginal tariff is reported by
the CPB. The effect per skill type is derived from the detailed policy proposals as published
by the CPB.13
4. Adjust the average tax rates. The average tax rate for each political party is given by the
CPB in their publication. The tax deductions have been adjusted proportionally for both skill
types. Two exceptions have been made for D66 and GroenLinks. Since those parties
introduced an Earned Income Tax Credit (EITC), the tax deduction for the unskilled sector
was raised more than proportionally.
12
The Mini-MIMIC model only holds one VAT-tariff whereas the MIMIC model holds two. Therefore, policy proposals that change only one VAT-tariff have been modelled in Mini-MIMIC by adjusting the indirect tax level 0.25%-point less than the actual proposed change in the VAT-tariff.
13