London’s Creative Sector: 2004 Update
Freeman, Alan
Greater London Authority
April 2004
Online at
https://mpra.ub.uni-muenchen.de/52626/
London’s Creative Sector: 2004 Update
Alan Freeman
London Metropolitan University
(Produced while working for the Greater London Authority)
2004
Prepared for Repec on 29 December 2013
Abstract
This is a pre-publication version of London’s Creative Sector: 2004 Update, which was
published by the Greater London Authority (GLA) in 2002 and can be found, at the time of this report, at http://london.gov.uk/mayor/economic_unit/docs/creative_sector2004.pdf. It should be cited as Freeman, A. (2004). London’s Creative Sector: 2004 Update.. London: Greater London Authority.
The report was the first of four updates to Creativity: London’s Core Business which produced the first measurements, and a time-series, for employment and GVA in London’s Creative Industries. Like that report, it applied the methodology of the Department of Culture, Media and Sport (DCMS) who, in their 1999 and 2000 Mapping documents, established one of the earliest systematic methodologies for defining and measuring the creative industries.
JEL codes: Z1, Z11
Introduction ... 2
1. At a glance – key findings ... 5
2. How the figures are produced ... 13
3. Results ... 25
Appendix 1: Transition to SOC2000 ... 33
Appendix 2: SIC and SOC codes used ... 42
Executive summary
In October 2002 GLA Economics published Creativity: London’s Core Business,1 a
comprehensive survey of employment and wealth creation in London’s creative sector. The report adapted the methodology developed by the Department of Culture, Media and Sport to arrive at an approach suitable for London.
This report updates and extends the data that was published in Creativity: London’s Core Business. It also revises it to bring it in line with the latest official statistics. It contains a detailed statistical appendix and an explanation of how the data were arrived at. It confirms the October 2002 findings:
London is the UK’s creative capital, with 40 per cent of the jobs in the UK’s creative industries, and 29 per cent of jobs in the UK creative sector as a whole.2
London’s success is tightly bound to that of the Greater South East, which now contains 62 per cent of jobs in the UK creative industries and 53 per cent of UK creative sector jobs
London’s creative sector is a major driver of its growth. It is growing faster than any major industry except Financial and Business Services, and accounts for between a fifth and a quarter of job growth in London between 1995 and 2001
One in seven of London’s jobs is in the creative sector.
It also finds that:
London is the focus of a new trend in specialisation. Nearly half its creative industry employees are in creative occupations, in contrast to an average of 30 per cent in the rest of the UK.
Women are underrepresented in the creative sector. Only 36 per cent of creative industry employees in London are women compared to 45 per cent in industry as a whole. Only 25 per cent of creatively occupied workers are women, falling to 20 per cent or lower for four out of eleven creative subsectors – Architecture, Leisure Software, Crafts, Design, and Film and Video.
In London, black or ethnic minority workers are significantly less likely to be employed in the creative sector and this situation is worse than in the UK as a whole. Only 13 per cent of people in creative occupations are from black or ethnic minority origin, compared with 21 per cent for London’s workforce as a whole.
The recent slowdown particularly affected London’s creative sector. In 2002, 47 per cent of all London’s job losses were in the creative sector.
1 GLA 2002
2 Throughout this report, ‘creative sector’ refers to all sources of creative employment. This contains
Introduction
Creative activity defies measurement. Policy, however, demands it. In 1998 the Department of Culture, Media and Sport (DCMS) produced the first of two Mapping Documents,3 the first attempt systematically to measure the economic contribution of the
creative sector in the UK. This turned out to be the first step in a process leading to an evidence-based approach to the creative and cultural sectors. The Mapping Documents were developed into an annual statistical bulletin entitled Creative Industries Economic Estimates.4
In October 2002 GLA Economics published Creativity: London’s Core Business, a
comprehensive survey of employment in London’s creative sector and its contribution to London’s wealth. It used the methodology developed by the DCMS to arrive at an approach suitable for estimating the extent of creative activity in London.
The DCMS Evidence Toolkit
In April 2004 the DCMS launched its Evidence Toolkit – known during its planning stage as the Regional Cultural Data Framework (RCDF).5 This is designed to provide a
basis for fundamental improvements to the collection and use of data on the creative sector.
The Evidence Toolkit extends the original creative sector approach to Sport, Tourism and Heritage Management but incorporating the previous creative sector within a new classification. The Evidence Toolkit:
defines seven DCMS sectors (Audio-Visual, Visual Arts, Books and Press, Performance, Sport, Tourism, and Heritage Management)
brings all these sectors within a single, integrated system for preparing evidence related to analysis and policy
restructures the initial Mapping Document list of 11 creative subsectors, condensing them into the first four DCMS sectors listed above (Audio-Visual, Visual Arts, Books and Press, and Performance)
separates each of these four DCMS sectors into six stages of the creative production chain: Creation, Making, Dissemination, Exhibition/Reception,
Archiving/Preservation and Education/Understanding.
Although the basic methodology is the same, the new classification is expected to increase the estimates of the size of the creative sector, due to the more complete coverage of the creative production chain. DCMS is currently reviewing the impact of the new system and plan to adopt it for its next publication.
Hopefully data will eventually be produced using the Evidence Toolkit system covering the same time period as the data now available for the creative sector under the old classification.
The data in this report are consistent with the definitions used by DCMS in its Economic Estimates. DCMS plan to adopt the Evidence Toolkit definition of the creative sector but to continue releasing data for the 11 creative sub-sectors identified in the Economic Estimates. For reasons explained at greater length in section 3, primarily the need for continuity in identifying long-term trends in the sector, our results are not presented using the DCMS Evidence Toolkit classification.
The Creative Industry Data and Intelligence Framework
In 2003 the London Development Agency (LDA) and GLA Economics commissioned a major research study on the creative sector entitled the Creative Industry Data and Intelligence Framework. The work was undertaken to gain a better understanding of the availability and limitations of creative industry data obtainable in London and work towards developing a credible evidence base for policy-making for the creative sector, using the RCDF as starting point.6
As background to the LDA’s work, and as part of GLA Economics’ continued programme of providing creative sector data in collaboration with the LDA and with DCMS, this report updates and extends the data that was published in 2002 and revises it to bring it in line with the latest available official statistics.
What’s new in the report?
Since Creativity: London’s Core Business was published,there have been several important changes. Two years’ more data – including an economic slowdown – are available. The data itself has been revised and improved. The valued opinions of many other researchers and practitioners in the field have been collected. The GLA’s own methodology has improved in response. The standard classification of occupations (SOC) was changed in 2000 and consequently, the data had to be revised retrospectively to make it comparable with new data so that trends over time can be estimated.
Employment
This report contains an updated dataset on employment which revises and replaces the data originally published in Creativity:London’s Core Business, and extends it for a further two years. It has not been extended to the Evaluation Toolkit classification, although the methodology is completely consistent with it. A significant improvement compared with
Creativity:London’s Core Business is the inclusion of data on self-employment, which raises workforce employment (industry-based) estimates by between 10 and 20 per cent.
6 The work was conducted by a consortium made up of the University of Leeds, the Small Business
The data incorporate revisions to the Annual Business Inquiry published in February 2004. Data on London boroughs incorporate revisions to the Labour Force Survey which have been regrossed in line with the 2001 census. Other data was not revised because a long-term series dating back to 1994 was not available at the time of writing.
In line with recommended practice, data below the threshold of statistical reliability for London (8,000 jobs) have been suppressed.
Output
The Office for National Statistics (ONS) has not published new output data on the creative sector since the last report and therefore revised estimates of output are not published. Since the GLA’s employment estimates have changed slightly, the
corresponding estimates of productivity would be slightly different if published. However, the measurement of service sector and creative sector output is a source of considerable controversy and research, and for this reason further data on output is not being published at this point.
It should, however, be noted that since Creativity: London’s Core Business, all ONS
estimates of real output have transferred to a new methodology termed chain-linking, and rebased to the year 2000. Since the unit of measure is different and higher, in general these measures have risen. As a result, theestimates of real output are not compatible with chain-linked or otherwise rebased estimates of real output in the rest of the economy.
Continuity with the DCMS Evidence Toolkit
As already mentioned in the introduction, the DCMS Evidence Toolkit restructures the CI classification system which was the basis of Creativity: London’sCore Business. GLA Economics believes that continuity is important in data dissemination. Data under the original mapping has been available to practitioners for several years and is in widespread use. Therefore, during the transition period it is important that data be provided under the old system. The data in this report have been produced on the same basis as the original data, which was in turn based on the DCMS Economic Estimates (DCMS 2001b) approach. Data within the DCMS Evidence Toolkit framework will be produced as soon as this framework has been disseminated and has stabilised.
1. At a glance – key findings
1.1 London – the UK’s creative capital
Chart 1.1a: Regional shares in creative jobs – 2002
Rest of the Greater South
East 22%
Rest of the UK 38% London
40%
The majority of Britain’s creative jobs – 62 per cent – were inside the Greater South East (London, the South East, and the East).
Chart 1.1b: Creative employment growth rates – 1995-2002
Creative job growth is distributed unevenly between subsectors. Crafts, Publishing, Fashion and
Architecture actually declined in London between 1995 and 2001.
London’s growth was stronger than the UK in performance-related sectors: Radio and TV, Video, Film and Photography, and Music and the Visual and Performing Arts. Elsewhere the UK on average grew more (or declined less) than London.
-40 %
-20 %
0% 20% 40% 60% 80% 100 %
120 %
Interactive leisure software Radio & TV Music and the visual & performing arts Art/ antiques trade TOTAL Video, film & photography (Design) Advertising Architecture Fashion Publishing
(Crafts) UK growth
London growth
Chart 1.1c: Creative jobs in London and the SE 1995-2002 – thousands of creative sector jobs 400 450 500 550 600 650 700 750
1995 1996 1997 1998 1999 2000 2001 2002 London
Rest of the Greater South East
Over this period, job growth in London and in the rest of the Greater South East (South East and Eastern regions combined) have marched in step
1.2 Occupation and industry
Chart 1.2a: Components of creative employment in London – thousands of jobs
Creative employment comes from two sources: those who work in creative industries such as advertising, and those who have creative occupations outside the creative industries, such as music teachers.7 London’s creative
industries show a distinctive pattern. Creative industry jobs were 72 per cent of total creative jobs in 2002. The remaining 28 per cent were creatively occupied outside the creative industries. 0 100 200 300 400 500 600 700
1995 1996 1997 1998 1999 2000 2001 2002 Total
Creatively Occupied outside Industry Creative Industry Workforce
Chart 1.2b: Components of creative employment in the UK – thousands of jobs
0 500 1000 1500 2000 2500
1995 1996 1997 1998 1999 2000 2001 2002 Total
Creatively Occupied outside Industry Creative Industry Workforce
Outside London, this is reversed. On average in the UK, creative industry jobs accounted for 52 per cent of total creative jobs in 2002. Nearly half the UK’s creative sector employees do not work in creative industries. This suggests that London is a focus for specialisation; enterprises that produce only or mainly creative products are more prevalent and account for more employment. Outside London, the number of creatively occupied people is growing but they are not being
absorbed to the same extent by specialised companies
Chart 1.2c: Occupational and industrial employment
7 A third small source of creative employment is people who have a second, creative job, though their
This shows up in the distinctive growth pattern of London, compared with the rest of the country. In the rest of the UK outside London, creative
occupations grew twice as fast as in London between 1995 and 2002.
Creative industry jobs grew at the same speed, on average, inside and outside London. 0.0% 0.5% 1.0% 1.5% 2.0% 2.5% 3.0% Occupations Industry London Rest of UK
1.3 Creative intensity
Chart 1.3a: Creative intensity – proportion of creative industry workers in creative occupations
0% 10% 20% 30% 40% 50% 60% East Midlands
Scotland North East North West Yorkshire and The Humber Greater South East Great Britain Wales West Midlands South West
London London’s creative industries employ a higher proportion of creative specialists than anywhere else in the country.
48 per cent of Londoners working in the creative industries are also in creative occupations.
Chart 1.3b: Creative intensity in London’s subregions – proportion of creative industry workers in creative occupations
There is some evidence of a trend for Outer London to become a focus of growth for creatively-intensive industries.
Creative intensity has fallen since 1999 in Inner London. Central London’s creative intensity fell below the London average in 2000.
Outer London’s creative intensity overtook that of Inner London, including Central London, in 2002.
30% 35% 40% 45% 50% 55% 60% 65%
1994 1995 1996 1997 1998 1999 2000 2001 2002 200 Central London
Inner London (not central) Outer London
-40 -20 0 20 40 60 80 100
Growth 1995-2001 Losses 2001-2002 Creative sector employee jobs
Creative workers outside the creative industries
Creative occupations outside the creative industries proved the most vulnerable to the recent slowdown. Creative industry employee jobs grew by 88,000 during 1995-2001, of which 25,000 were lost in 2002.
1.4 A driver of London’s growth
Chart 1.4a: Job growth before the slowdown – thousands of jobs
-100 -50 0 50 100 150 200 250 300 350 400 Manufacturing
Energy and Water Construction Transport and communications Public services Creative Industries Distribution, hotels, restaurants Financial and Business
Growth 95-01 Growth 01-02
The creative industries continue to lead London’s job growth. In the growth years 1995 to 2001, creative sector employment added more jobs in London than all major industries except Distribution, and Financial and Business Services.8
Between 1995 and 2001, the creative sector was responsible for one new job in every 4.5 in
London. (Creative sector: workforce jobs+ occupational employment; All
other sectors: workforce jobs)
Chart 1.4b: Shares in London jobs, 2002 – Ratio of workforce employment to London total, per cent
One in every seven Londoners worked in London’s creative sector in 2002
The sector accounted in 2002 for 650,000 jobs, more than
Manufacturing and Construction combined.
The sector is also greater than health and education combined, which accounted for 632,000 jobs in 2002.
0% 5% 10% 15% 20% 25% 30% 35% Construction Manufacturing Transport and communications Creative Industries Public services Distribution, hotels, restaurants Financial and Business
Chart 1.4c: Total creative employment in London – thousands of jobs
500 520 540 560 580 600 620 640 660 680 700
1995 1996 1997 1998 1999 2000 2001 2002
The slowdown hit the creative sector. During 2002, 40,100 creative jobs were lost – nearly half of London’s job loss over this period.
Despite these losses, during the whole period from 1995 to 2002, London gained 88,000 creative jobs overall.
8 The growth which took place up to 2001 is separated from the job losses which occurred mainly
So, despite its losses in 2002, London’s creative sector grew by 15 per cent over these seven years.
1.5 Where it’s at in London
Statistical reliability decreases because of small sample sizes when studying borough totals, but some indications of the general pattern can be obtained. Data from two years are used to reduce this sample size problem.
Creative occupations are strongly concentrated in the north and west of London, with some indications (see Map 1.5a) of a trend away from Central London.
Map 1.5a: Creative occupations – average of 2001 and 2002
1.6 Gender
Chart 1.6a: Proportion of creatively occupied female employees in the UK
0% 20% 40% 60% 80% 100%
Crafts Interactive Leisure Software Architecture Film and Video Design (All creative) Publishing and Printing Music and the performing Arts Radio and TV (All Occupations) Fashion
Advertising In the UK as a whole, 46 per cent
of jobs are held by women. In creative occupations this proportion is 25 per cent.
In only two creative occupations is the employment of women higher than the general average:
advertising and fashion.
Chart 1.6b: Proportion of creatively occupied female employees in London
The situation is better in London, mainly because the proportion of women in creative occupations in London is higher than in the UK overall.
Women’s share of employment in Radio and TV, and Music and the Performing Arts, is above the average for the creative industries but below that for all industries in London.
The proportion of women in occupations in the Film and Video sector is so low as to be statistically insignificant.
0% 10% 20% 30% 40% 50% 60% 70% 80% 90% Film and Video
Crafts Interactive Leisure Software Architecture Design (All creative) Publishing and Printing (All Occupations) Music and the performing Arts Radio and TV Advertising Fashion
Chart 1.6c: Proportion of women working in creative industries in London
0% 20% 40% 60% 80% 100%
Interactive Leisure Software Architecture Film and Video (All creative) Music and the performing Arts Radio and TV Advertising (All Industries) Publishing and Printing
Fashion Fashion is the only sector where
1.7 Ethnicity
Chart 1.7a: BME employees in London’s creative industries
The proportion of workers of black or ethnic minority (BME) origin in London’s creative industries is 11.6 per cent, only around half the proportion in London’s workforce as a whole, which is 22.8 per cent. The same is true for creative occupations.
In the UK there is less under-employment of BME workers within the creative occupations although at 5.5 per cent the proportion is still below the national average of 6.5 per cent. In the creative industries in the UK, the proportion of BME workforce jobs, at 7.2 per cent, is above the national average of 6.5 per cent. These are quite marked differences for London relative to the UK, which we cannot yet fully explain.
0% 5% 10% 15% 20% 25% London
UK
2. How the figures are produced
2.1 An evidence-based approach to creativity
The DCMS Evidence Toolkit and mapping documents do not pretend to decide the intrinsic merit of a painting or performance. They set out to identify the resources which society puts into bringing them to their audience. This begins with a judgement about which activities are really involved in this process, and what money is really paid for their activities. The DCMS’s 2001 mapping document defined the creative sector as:
those industries which have their origin in individual creativity, skill and talent and which have a potential for wealth and job creation through the generation and exploitation of intellectual property (DCMS, 1998)
Working with stakeholders and experts in the field and in the Regional Cultural Consortia, DCMS drew up a procedure that has become the standard for identifying:
industries whose main business is creative (the creative industries)
people whose work is by its nature creative (creatively occupied workers)
On this basis it produced an initial list of 13 creative industries: Advertising, Architecture, Arts and Antiques, Crafts, Design, Designer Fashion, Software and Computer Services, Music, The Visual and Performing Arts, Publishing, Radio and TV, and Video, Film and Photography. It selected codes from the ONS’s Standard Industrial Classification (SIC) to identify the creative industries, and from the Standard
Occupational Classification (SOC) to identify the creative occupations.
In 2002 GLA Economics set out to measure London’s creative employment, output and productivity using these classifications and published its results in Creativity: London’s Core Business. Using definitions supplied by DCMS, it calculated how many people were working in London in each of the subsectors (industries) identified by the DCMS
mapping document. These were reduced to 11 subsectors to render them compatible with ONS output data. Music and the Performing Arts were grouped together and the
software sections were combined into one Interactive Leisure Software subsector. Using data from the ONS, GLA Economics estimated the output (value added) in these
industries and, in this way, made a first estimate of productivity (output per employee).
2.2 Previous findings
The results of Creativity:London’s Core Business provided strong support for the GLA group’s view that the creative sector is an important part of London’s economy and quality of life. Creativity:London’s Core Business’s view was that:
Where there is money, jobs are never far behind. The report found that:
The creative industries as a whole represent London’s third largest sector of employment, with 525,000 people working either directly in the creative industries or in creative occupations in other industries … [T]he creative industries are London’s second biggest source of job growth, contributing roughly one in every five jobs.
The report also found that London’s creative output per job was growing at rates that appeared to outstrip most of London’s other industries:
London’s creative industries are at the centre of a productivity revolution, expanding both jobs and wealth, with employment up by five per cent per year, output by 8.5 per cent and productivity by four per cent between 1995 and 2000.
London was the focus of this growth, with a job growth rate higher than any other region, except the South East, and accounting for over a quarter of the UK’s creative jobs. It was important for policy to know why such a high-cost area was the location of choice for creative industry investment and growth. GLA Economics noted that:
The success of the creative industries proves that London offers what is needed for a new high-growth, value-added sector. London’s costs are high; its winners are those who provide what the customer wants. The keys to achieving this are the supply side advantages that London offers. London’s prime asset is its social capital: a highly skilled, diverse and multicultural workforce. It does business in the world’s language – and speaks another 300. Only New York has comparable advantages. To utilise human capital
efficiently, proximity is decisive.
The report concluded that:
London is a creative factory; it gives access to the entire range of services required to deliver customised products on a large scale to tight deadlines.
London’s creative sector was evidently a major part of its future. Continued monitoring of its performance and needs was vital to its economic health.
2.3 Rethinking creativity
Creativity is a significant factor in London’s economic revival and is not confined to the consumer leisure industries. For example, Creativity: London’sCore Business noted the decision of Ford and Nissan to locate major automotive design centres in Soho.
Design, and design capacity, is in demand across the board in London’s high-value added industries. Therefore, although this report is confined to the creative sector as originally defined, it has implications for a wider range of activities. The working definition of creativity in Creativity: London’s Core Business’swas, therefore, an outcome of its results:
The capacity to produce customised products on a large scale to tight deadlines.
Two changes are perhaps needed. First, there is a case for adding ‘on the basis of an incomplete specification’. What distinguishes creative workers from mass producers is that they do not begin with a complete knowledge of the final result – only with an indication of the effect it is intended to have. The creativity consists not just in
originating the product and bringing it to its audience, but in matching its performance to a vision of how the audience is intended to react.
Second, the words ‘on a large scale’ need to be qualified. It is true that new creative industries realise economies of scale, often by applying sophisticated and costly
technology. However, what they often make is not large amounts of one thing, but small amounts of a large variety of things.
An emerging characteristic of the new sector is that, typically, it produces short runs with high value added. The architect is an archetype: each product – often each individual building – is a one-off project and, with modern computer techniques, are often fabricated from parts that are the very opposite of mass-produced. The same is true of the film-maker for whom a single film is the outcome. Or even more so for the performer or singer, for whom a single show is the outcome.
The clothing industry is segmenting in a way that illustrates this. The mass production, large-volume sector is almost entirely offshored and this lies behind the decline, for example, of the textile industry in the East Midlands. London is actually the region in which the clothing industry has declined the least. This is a lot to do with the growth of the designer fashion sector, which – as Italy’s success testifies – requires a very different type of manufacturer; one that can produce a very precise kind of cloth for a very small range of outputs but with great flexibility and precision, to produce the precise effect that the designer requires for one particular item.
But what distinguishes this kind of mass market is that its products stand or fall on their content, not their form. What matters is not the fact of making a television broadcast, but what the programme contains, and whether people watch it. In singling out the creative industries, the aim is to identify the precise segment of the industry which originates and delivers this content.
If the origination of creative content is at the heart of the creative sector, the role of intellectual property can also be put in perspective. Intellectual property is central to the way in which many activities in this sector are financed; in effect, it gathers the income streams arising from mass dissemination and channels them to the organisers of the process. However, it has a very different significance in different sectors, particularly when very short runs of product are involved so that duplication is not an issue.
Thus a pirate copy of an architect’s plans would be an unprofitable eccentricity. In the visual arts, copyright mainly serves not as a means of preventing intellectual theft but as a guarantee of authenticity; as a means that the consumer can be assured that the product really originates where it claims to. In designer fashion it serves more as a means of branding than a source of royalty income. It is only where origination feeds into a mass market in dissemination – particularly film, video, publication and software – that intellectual property as such is central to the actual definition of creative products.
The discussion above suggests a revised working definition of the creative factor in production as follows:
The capacity to deliver customised products to tight deadlines from incomplete or abstract specifications.
The purpose of this definition is not to change the definition of the creative sector as such, which refers to a specific set of mainly consumer-oriented products. It is to provide a way of thinking about creativity that goes beyond the creative sector – particularly in the process of devising further refinements to the SOC – which will provide researchers with quantitative tools for studying, and measuring, the more general impact of design, creativity, and innovative activity in modern production as a whole, so that we can study, on the basis of evidence, questions such as ‘what determines Nissan’s decision to locate its design headquarters in Soho?’.
2.4 Creativity as a factor of production
The creative industries reverse traditional thinking about industrial paradigms. The classic work of Joan Woodward on the relation between technology and structure
Table 2.4a: Joan Woodward’s classification of technology
Unit production Mass production Process
production
Management Low High Highest
Skill High Low High
Complexity Low High Low
Woodward’s underlying conception, for many decades received opinion, is that small scale production is at the low-tech end of production requiring high skill but not much else, while the locus for large-scale capital investment in new technology is in large-scale production. Revising this in the light of what is now happening in the creative industries, the first column would have ‘high’ in every entry.
The creative industries now probably involve greater complexity, and greater
management input, than any traditional sector. They are the antithesis of ‘Fordism’ – traditional mass production for a uniform consumer market – and, increasingly, the focus of large-scale capital investment. This suggests that important as are creative industries outputs – creative products – what may in the long-term be most notable are the creative industries processes involving innovation and customisation. Creative industries inputs – notably creative labour itself – may be the key factor.
This is why it is important to categorise, identify and quantify creative labour – a problem that preoccupies many researchers.9 A more careful study of the occupational
element of the DCMS shows that it can provide additional information, which we study in this report in addition to the ground covered in Creativity:London’s Core Business.
What emerges is a clear difference between the pattern in London and the pattern outside London, which shows that London uses its creative workers in a distinctive way. Outside London, creatively occupied people outnumber creative industry jobs, by as much as eight to one in some regions. In London this is reversed, and creative industries account for 20 per cent more jobs than creative occupations in total. This difference shows up also in what is called creative intensity – the proportion of workers in the industry that are also creatively occupied. At one end of the scale, in the North-East, only 28 per cent of the workforce in the creative industries is actually engaged in creative occupations. This proportion, broadly, becomes higher and higher the closer to London, where it reaches 48 per cent. This ratio also distinguishes London from the rest of the Greater South East where creative sector employment is large and growing, but creative intensity is only 37 per cent.
This reverses the Fordist model, in which the factory is often associated with deskilling. The skills requirements of the traditional factory may be highly specialised but not highly qualified. In the creative sector, the premium is flexibility and diversity, since creative companies live or die on their ability to produce variety. London’s creative industries
appear to be turning into specialist employers of creative labour – a trend which this report has attempted to quantify.
2.5 Industries and occupations
Creative sector employment has two components: industrial and occupational.
Industrial employment comprises people that work for enterprises in creative subsectors, such as advertising agencies, film companies, architectural partnerships, and so on. Occupational employment comprises people that have creative jobs, such as musicians, artists, games programmers, camera operatives, and so on.
The same job should not be counted twice. If, for example, a musician works in a music company then simply adding up the total industrial jobs and the total occupational jobs will count the job as part of both groups, once as a musician and again as a music employee.10
Creative sector employment in the DCMS and GLA framework is made up of two main parts:
1. Workforce jobs in the creative industries
2. Creatively occupied people who do not work for any creative industry.
Workforce employment is made up of two components
1. Employee (waged or salaried) jobs 2. Self-employed workers.
Creative occupations also include second jobs – for example, artists, writers or musicians that do not earn enough money from their creative activities to support themselves.
2.6 Where the data comes from
The data comes from three primary sources. Jobs and output data are available from the Annual Business Inquiry (ABI).11 Job data also come from the Labour Force Survey
(LFS). Output data for the Creative Sector is provided by the ONS as an annual supplement to the input-output (I-O) tables.
The ABI is an employer survey. It contains no information about occupations. The LFS is a household survey. It reports both occupation and industry; unfortunately, its estimates of workplace employment are inconsistent with those from the ABI, particularly for London (see The GLA’s Workforce Employment Series, GLA 2003). If, therefore, the LFS is
10 A subtle point is that if the musician has a second job (for example, gigs by night) then this is
included in the final count. Employment in the creative sector refers to the numbers of jobs rather than numbers of people. On average, about three per cent of London’s workers have two jobs
used to estimate London’s workforce jobs, the results could not be compared with figures on workforce employment that use the ABI. For this reason the ABI is used as the sole source of information on the employee component of industrial employment. The LFS is used to calculate self-employment, and the occupational component of overall creative sector employment.12
The GLA’s estimates of workplace employment in the creative industries therefore differ from those of DCMS, which are derived entirely from the LFS. The GLA’s estimates further differ from the DCMS estimates because they are workforce-based, not residential. They measure the number of people that work in the creative sector in London, not the number of Londoners that work in the creative sector.
Output data presents particular problems. The input-output data is preferable in principle, because it is prepared according to the rigorous standards of the System of National Accounts (SNA), which reconciles and cross-checks data from a variety of sources. However, its definition of the creative industries is less precise than those of the DCMS and does not include exactly the same companies (in general it tends to include more).
ABI data matches the DCMS categories precisely, but the data is less reliable as it merely reports what employers say and is not reconciled with information from any other source. Furthermore ABI data on output is available only for a few years, whereas the ONS’s creative industry I-O series dates back to 1992. Since the GLA is particularly interested in long-term trends in productivity, it has chosen to use the ONS estimates of output.
It should be noted that DCMS and the GLA have published different estimates of creative industry output in the past. DCMS, the GLA and the ONS are working to resolve this and DCMS publishes comparisons from the two sources of information. As noted in the introduction, the GLA has not included any revised estimates of output or productivity in this report.
Of SICs and SOCs
The starting point of the whole analysis is a classification of industries and occupations which is used to decide which industries, and which activities, will be treated as creative. This is specified in detail by DCMS. For industries, the codes used are from the Standard Industrial Classification (SIC); for occupations, from the Standard Occupational
Classification (SOC). They are listed in appendix 3.
During the period covered by the GLA figures, SIC classifications have not changed. The last change was in 1992; the next will be in 2007. The main reasons that creative
industries data cannot be published for any earlier years is that SIC codes before 1992 did
12 An important exception is the calculation of creative intensity. The LFS is the source for both our
not disaggregate service sector industries sufficiently to be able to identify creative industries with adequate precision.
Occupational classifications changed in 2000 and became operative in the 2001 LFS. Unfortunately there was no overlap period in which both classifications were available simultaneously; therefore the GLA and DCMS have taken special measures to ensure that estimates prepared from the two different classifications are compatible. This is explained in Appendix 2.
2.7 Estimating industrial employment
Table 2.7a: Employment estimates from the ABI and the LFS – employee jobs,2002
Thousands of jobs
ABI LFS
Advertising 33,100 41,800
Architecture 59,800 65,400
Art/antiques trade (Missing from LFS data because of
coding inadequacies) 2,800 -
(Crafts) - -
(Design) - -
Fashion 52,100 40,100
Interactive leisure software 61,100 75,000 Video, film and photography 20,900 14,800
Radio and TV 64,000 69,200
Music and the visual and performing arts 40,500 54,700
Publishing 39,900 83,400
TOTAL 374,500 444,400
Table 2.7a shows the primary estimates of industrial employment from the ABI and the LFS respectively.
The results are sometimes quite different, for example for Publishing where the LFS estimate for London is nearly twice as large.13 Since all other workforce data for London
is compiled from the ABI, using the LFS estimates of industrial employment would be inconsistent and lead to estimates of employment that could not be compared with other sectors.
13 Confirming the discrepancies between the two primary sources which was referred to earlier.
The LFS data is therefore not directly used as such, but is printed here for information. For two sectors (crafts and design) there is no industrial component at all; these sectors are defined only by their occupational components.
The starting point for the GLA calculation is the leftmost column of Table 2.7a – the ABI estimate of creative industry employment. These are the figures published in the tables and charts as ‘employee jobs’ in the creative industries.
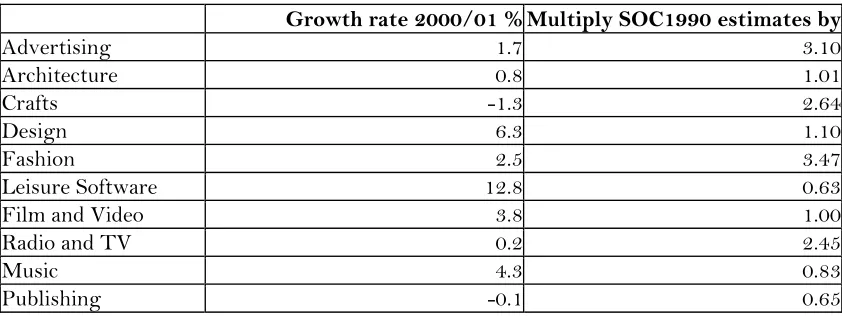
[image:24.612.108.519.283.547.2]A further adjustment is made to include the self-employed, which are added from the LFS. This is because the ABI, as an employer survey, contains no information about self-employment and this must be obtained from the LFS. Table 2.7b shows the self-employed component of workforce employment in the creative sector for 2002.
Table 2.7b: Workforce employment in the creative industries
Thousands of jobs Employees
(ABI)
Self-employed (LFS)
Total
Advertising 33,100 - 39,400
Architecture 59,800 11,100 70,900
Art/antiques trade - - -
(Crafts) - - -
(Design) - - -
Fashion 52,100 - 57,300
Interactive leisure software 61,100 9,600 70,800 Video, film and photography 20,900 - 27,900
Radio and TV 64,000 13,800 77,900
Music and the visual and performing
arts 40,500 29,000 69,500
Publishing 39,900 12,000 51,900
TOTAL 374,500 94,200 468,700
Counts and coefficients: restricting the subsectors
The existing SIC codes are insufficiently precise to identify creative subsectors without including, in at least some of them, activities that are not creative. A typical example is the Designer Fashion subsector, which includes the SIC codes shown in Table 2.7c.14
Table 2.7c: some SIC codes entering the definition of ‘Fashion’
18.1 Manufacture of leather clothes 18.21 Manufacture of workwear
14 Both the GLA and the DCMS definition of Designer Fashion is derived from a substantially larger
18.22 Manufacture of other outerwear 18.23 Manufacture of underwear
These are clearly not all part of the designer fashion industry. If the SIC codes
discriminated enough between different parts of the clothing industry, they could be used to single out only those enterprises belonging to designer fashion. Instead, DCMS assumes that only 0.5 per cent of these workers are actually employed in the designer fashion sector as such. It multiplies each of the ABI estimates of employment shown above by 0.5 per cent, and then adds them up to arrive at ‘designer fashion’ employment.
GLA Economics does not apply the same coefficients as DCMS in every case, because of London’s specificities. The bulk of the clothing trade in London is judged as part of the production chain for creative fashion as costs in London are so high.
This judgement is obviously subject to refinement and is one of the reasons that GLA Economics worked with the LDA to produce the extensive report on the creative sector referred to in the introduction. However, it remains the case that GLA estimates of industrial employment differ from those of the DCMS. This approach is taken to reflect, as accurately as possible, the specific conditions of London.
In order to compare London with other regions, and to estimate UK creative
employment, the coefficients provided by DCMS are applied outside London, since the specific conditions of London are unlikely to hold in the other regions.
This means that estimates of London’s creative employment are likely to be higher than would be the case, if the DCMS coefficients were applied. This is the most significant in the Fashion and Music sub-sectors. However, the qualitative relations between London and the regions identified in this report hold good whichever set of coefficients are applied.
Creative occupations
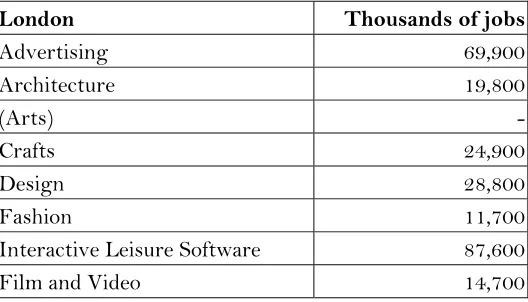
[image:25.612.95.359.586.737.2]Table 2.7d shows the number of people that were creatively occupied in London in 2002, according to the LFS.
Table 2.7d: Number of creatively occupied persons in London in 2002
London Thousands of jobs
Advertising 69,900
Architecture 19,800
(Arts) -
Crafts 24,900
Design 28,800
Fashion 11,700
Interactive Leisure Software 87,600
Radio and TV 26,900 Music and the performing Arts 48,200 Publishing and Printing 37,500 TOTAL 370,300
However, many of these people have already been accounted for in the industry
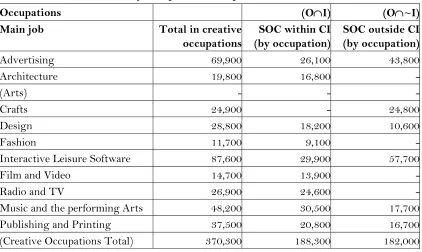
employment figures, since they may actually work in a creative industry. Therefore, the LFS is queried separately to find out those people that are creatively occupied but do not work in any creative industry. Table 2.7e provides estimates, taken from the LFS, of:
[image:26.612.107.529.289.541.2]1. Creatively-occupied people inside the creative industries (O~I, in logical notation) 2. Creatively-occupied people outside the creative industries (OI, in logical notation).
Table 2.7e: Creative industry occupational component, 2002
Occupations (OI) (O~I)
Main job Total in creative
occupations
SOC within CI (by occupation)
SOC outside CI (by occupation)
Advertising 69,900 26,100 43,800
Architecture 19,800 16,800
-(Arts) - -
-Crafts 24,900 - 24,800
Design 28,800 18,200 10,600
Fashion 11,700 9,100
-Interactive Leisure Software 87,600 29,900 57,700
Film and Video 14,700 13,900
-Radio and TV 26,900 24,600
-Music and the performing Arts 48,200 30,500 17,700 Publishing and Printing 37,500 20,800 16,700 (Creative Occupations Total) 370,300 188,300 182,000
The first of these (the third column in table 2.7e) is already included in the industrial component of employment and is therefore not included in final employment figure. It is however used to estimate what we have termed ‘creative intensity’ – the proportion of workers in the creative industries that are themselves creatively occupied. The second part (the last column in table 3.4) shows everyone that has not been so far included, since they work outside the industry. This is the occupational component, and is added to the industrial component to estimate the employment total.
One small further addition is made: people whose second job is creative, but whose main job is not in a creative industry.
Workforce jobs: 374,535 employees + 94,265 self-employed = 468,799 In creative occupation outside creative industry in main job: 163,233 In creative occupation outside creative industry in second job: 10.676
Total
642,708
Several of the estimates fall below the threshold of statistical reliability for LFS data, which for this dataset is 8,000, and have been suppressed. Sectoral estimates of the occupational component cannot be relied on. Where this occupational element is small in relation to the industrial component, estimates of sectoral employment (industrial plus occupational) may remain within the limits of statistical validity. Most importantly, when the results are aggregated to a total, this total is itself well above the reliability threshold, so that we consider this final result (the total occupational component of creative sector employment) to be statistically admissible.
A warning on double counting
The method used above ensures that no creative job is counted twice. However, in the national statistics, creative industries are not (yet) separated out from all other sectors in the way that, for example, manufacturing or finance and business services are. Every creative job is therefore included somewhere or other in one of the main SIC
classifications such as manufacturing, finance and business and public services.
GLA Economics 25
3. Results
In the tables below, figures below the threshold of statistical reliability have been suppressed. #N/A signifies that the data is not available.
Summary UK
1994 1995 1996 1997 1998 1999 2000 2001 2002 2003
LFS workplace employees 1,313,600 1,371,700 1,415,900 1,470,700 1,549,600 1,584,100 1,581,100 1,604,700 1,574,800 1,590,500 ABI workplace employees #N/A 681,500 700,400 735,900 744,000 790,300 822,300 854,300 823,100 #N/A Self-Employed 304,500 315,900 324,900 351,800 371,800 379,700 351,500 351,500 350,500 379,900 Industry (I): ABI workplace
employees + self-employed
#N/A 997,500 1,025,300 1,087,800 1,115,800 1,170,000 1,173,900 1,205,800 1,173,600 379,900
Creative occupations (O) 1,295,400 1,337,300 1,337,800 1,390,400 1,414,900 1,498,200 1,519,700 1,570,800 1,555,300 1,618,800 Occupations outside industry
(O~I) 889,300 912,700 898,900 929,000 924,500 958,300 968,200 1,067,800 1,071,000 1,104,500 Sector (I+O~I): Industry plus
occupations outside industry)
#N/A 1,910,300 1,924,200 2,016,800 2,040,400 2,128,300 2,142,200 2,273,700 2,244,600 #N/A
Creatively occupied within industry
(OI) 471,200 493,200 507,900 527,500 556,700 605,900 607,700 589,200 581,200 612,100
Intensity (OI/I) 36% 36% 36% 36% 36% 38% 38% 37% 37% 38%
Summary London
1994 1995 1996 1997 1998 1999 2000 2001 2002 2003
LFS workplace employees 336,400 359,400 388,500 411,000 443,100 437,900 418,500 461,900 444,400 432,600 ABI workplace employees #N/A 311,200 324,400 346,900 352,400 367,000 380,000 399,200 374,500 #N/A Self-Employed 86,700 87,500 99,800 102,200 120,900 121,500 95,500 95,700 94,200 103,700 Industry (I): ABI workplace
employees + self-employed
#N/A 398,700 424,300 449,100 473,400 488,500 475,600 495,000 468,700 103,700
Creative occupations (O) #N/A 562,700 565,700 597,300 639,100 667,600 640,900 690,800 650,800 #N/A Occupations outside industry
(O~I) 304,100 336,200 327,400 331,000 368,200 393,300 364,800 394,900 370,300 378,300 Sector (I+O~I): Industry plus
occupations outside industry)
26 GLA Economics Creatively occupied within industry
(OI) 169,500 183,300 196,900 194,100 214,500 225,800 210,700 214,200 207,100 206,500
GLA Economics 27
Employee jobs (ABI): UK
1994 1995 1996 1997 1998 1999 2000 2001 2002
Advertising #N/A 67,400 75,900 77,600 83,700 84,500 94,500 90,800 84,300 Architecture #N/A 131,100 125,200 121,300 115,000 116,500 120,000 122,100 119,800 Art/antiques trade #N/A 14,700 16,600 15,500 16,000 16,300 17,500 18,800 19,300
(Crafts) #N/A #N/A #N/A #N/A #N/A #N/A #N/A #N/A #N/A
(Design) #N/A #N/A #N/A #N/A #N/A #N/A #N/A #N/A #N/A
Fashion #N/A 86,300 80,600 110,800 104,200 108,000 111,900 109,500 106,100 Interactive leisure software #N/A 69,400 77,200 78,700 90,700 102,400 115,300 123,700 116,400 Video, film and photography #N/A 36,700 43,100 44,400 44,600 45,100 46,300 49,300 49,300 Radio and TV #N/A 54,000 55,900 147,300 150,000 153,200 151,200 157,100 153,100 Music and the visual and
performing arts
#N/A 87,100 82,700 85,200 85,000 95,600 97,100 104,600 104,800
Publishing #N/A 134,500 142,900 54,800 54,300 68,200 68,100 77,900 69,700 TOTAL #N/A 681,500 700,400 735,900 744,000 790,300 822,300 854,300 823,100
Employee jobs (ABI): London
1994 1995 1996 1997 1998 1999 2000 2001 2002
Advertising #N/A 26,400 32,000 35,700 35,700 34,400 38,200 38,000 33,100 Architecture #N/A 58,600 57,900 59,600 56,100 55,200 59,000 60,100 59,800
Art/antiques trade #N/A - - - -
(Crafts) #N/A #N/A #N/A #N/A #N/A #N/A #N/A #N/A #N/A
(Design) #N/A #N/A #N/A #N/A #N/A #N/A #N/A #N/A #N/A
Fashion #N/A 49,100 47,400 63,000 60,700 59,900 59,700 57,500 52,100 Interactive leisure software #N/A 36,700 41,100 40,200 47,100 51,700 62,500 67,000 61,100 Video, film and photography #N/A 16,000 17,700 20,100 21,500 23,600 20,500 22,200 20,900 Radio and TV #N/A 30,600 31,500 60,300 62,700 64,300 63,100 66,000 64,000 Music and the visual and
performing arts
#N/A 35,600 34,400 33,900 34,300 40,100 39,000 43,500 40,500
Publishing #N/A 55,500 59,400 31,300 31,700 34,800 35,100 41,500 39,900 TOTAL #N/A 311,200 324,400 346,900 352,400 367,000 380,000 399,200 374,500
28 GLA Economics
Self-employment UK
1994 1995 1996 1997 1998 1999 2000 2001 2002
Advertising 13,400 15,400 19,100 16,100 13,500 16,700 13,400 12,900 15,700 Architecture 77,500 86,100 87,700 87,800 92,000 90,400 86,800 84,000 78,500 Art/antiques trade #N/A #N/A #N/A #N/A #N/A #N/A #N/A #N/A #N/A
(Crafts) #N/A #N/A #N/A #N/A #N/A #N/A #N/A #N/A #N/A
(Design) #N/A #N/A #N/A #N/A #N/A #N/A #N/A #N/A #N/A
Fashion 37,600 37,700 29,200 32,000 33,500 37,000 33,000 33,600 28,700 Interactive Leisure Software 23,200 22,900 29,900 38,300 46,400 50,400 45,500 43,600 45,700 Film and Video 9,400 10,600 - 11,400 12,500 9,300 10,000 10,500 13,300 Radio and TV 34,700 28,700 26,300 29,100 35,500 34,800 31,500 33,600 35,700 Music and the performing Arts 74,200 82,300 90,900 102,700 100,300 105,600 100,100 105,100 100,700 Publishing and Printing 34,000 32,000 34,200 34,100 37,700 35,300 30,900 27,900 31,900 Creative Industries 304,500 315,900 324,900 351,800 371,800 379,700 351,500 351,500 350,500
Self-employment London
1994 1995 1996 1997 1998 1999 2000 2001 2002
Advertising - - - -
Architecture 16,300 20,100 20,900 13,000 16,500 17,100 14,200 12,000 11,100 Art/antiques trade #N/A #N/A #N/A #N/A #N/A #N/A #N/A #N/A #N/A
(Crafts) #N/A #N/A #N/A #N/A #N/A #N/A #N/A #N/A #N/A
(Design) #N/A #N/A #N/A #N/A #N/A #N/A #N/A #N/A #N/A
Fashion 8,700 10,700 - 8,700 13,700 11,900 - - -
Interactive Leisure Software - - 9,100 10,200 11,300 14,600 9,900 10,200 9,600
Film and Video - - - - 9,500 - - - -
Radio and TV 10,100 10,000 10,900 9,900 16,000 16,900 13,300 12,600 13,800 Music and the performing Arts 26,900 24,900 32,600 36,400 35,000 36,100 31,300 36,200 29,000 Publishing and Printing 12,500 9,300 11,300 12,200 15,300 13,500 11,200 8,700 12,000 Creative Industries 86,700 87,500 99,800 102,200 120,900 121,500 95,500 95,700 94,200
GLA Economics 29
Workforce UK
1994 1995 1996 1997 1998 1999 2000 2001 2002
Advertising #N/A 82,800 95,000 93,700 97,200 101,200 108,000 103,800 100,000 Architecture #N/A 217,200 213,000 209,100 207,100 206,900 206,900 206,200 198,300 Art/antiques trade #N/A #N/A #N/A #N/A #N/A #N/A #N/A #N/A #N/A
(Crafts) #N/A #N/A #N/A #N/A #N/A #N/A #N/A #N/A #N/A
(Design) #N/A #N/A #N/A #N/A #N/A #N/A #N/A #N/A #N/A
Fashion #N/A 124,100 109,900 142,800 137,700 145,100 144,900 143,100 134,800 Interactive Leisure Software #N/A 92,300 107,100 117,100 137,100 152,800 160,900 167,300 162,100 Film and Video #N/A 47,300 50,300 55,800 57,200 54,400 56,300 59,800 62,600 Radio and TV #N/A 82,700 82,200 176,500 185,600 188,100 182,700 190,700 188,800 Music and the performing Arts #N/A 169,500 173,600 188,000 185,300 201,200 197,300 209,800 205,500 Publishing and Printing #N/A 166,500 177,200 88,900 92,100 103,500 99,000 105,900 101,700 Creative Industries #N/A 997,500 1,025,300 1,087,800 1,115,800 1,170,000 1,173,900 1,205,800 1,173,600
Workforce London
1994 1995 1996 1997 1998 1999 2000 2001 2002
Advertising #N/A 28,400 36,100 39,600 39,000 39,600 41,500 42,100 39,400 Architecture #N/A 78,800 78,800 72,600 72,700 72,400 73,200 72,200 70,900 Art/antiques trade #N/A #N/A #N/A #N/A #N/A #N/A #N/A #N/A #N/A
(Crafts) #N/A #N/A #N/A #N/A #N/A #N/A #N/A #N/A #N/A
(Design) #N/A #N/A #N/A #N/A #N/A #N/A #N/A #N/A #N/A
Fashion #N/A 59,900 54,500 71,700 74,500 71,900 67,700 63,600 57,300 Interactive leisure software #N/A 41,000 50,200 50,500 58,400 66,300 72,400 77,300 70,800 Video, film and photography #N/A 22,000 21,400 27,800 31,000 29,600 24,800 27,900 27,900 Radio and TV #N/A 40,700 42,500 70,200 78,700 81,200 76,400 78,700 77,900 Music and the performing arts #N/A 60,500 67,100 70,400 69,300 76,200 70,300 79,800 69,500 Publishing #N/A 64,800 70,700 43,600 47,000 48,400 46,300 50,300 51,900 Creative Industries #N/A 398,700 424,300 449,100 473,400 488,500 475,600 495,000 468,700
30 GLA Economics
Creative Occupations in the UK (Total)
1994 1995 1996 1997 1998 1999 2000 2001 2002
Advertising 185,900 197,900 190,900 188,700 192,000 228,800 208,900 211,200 195,700 Architecture 68,000 73,500 68,500 67,100 71,700 62,700 76,200 76,700 73,500
(arts) #N/A #N/A #N/A #N/A #N/A #N/A #N/A #N/A #N/A
Crafts 373,200 358,400 346,300 338,300 339,800 341,500 321,100 314,200 314,300 Design 134,100 134,300 126,900 141,100 147,000 160,400 174,300 183,600 183,300 Fashion 28,700 40,900 42,200 43,100 39,800 32,100 38,900 38,500 42,400 Interactive Leisure Software 156,800 171,000 190,700 226,100 259,200 296,000 316,400 357,900 379,300 Film and Video 53,000 47,100 45,500 47,600 45,400 42,600 52,700 54,000 45,300 Radio and TV 55,400 55,500 62,100 56,300 38,000 48,900 54,800 54,700 54,500 Music and the performing Arts 91,700 108,200 111,800 124,100 127,300 134,600 126,700 130,800 127,100 Publishing and Printing 148,100 150,100 152,600 157,600 154,400 150,100 149,100 148,900 139,500 All creative occupations 1,295,400 1,337,300 1,337,800 1,390,400 1,414,900 1,498,200 1,519,700 1,570,800 1,555,300
Creative Occupations in London (Total)
1994 1995 1996 1997 1998 1999 2000 2001 2002
Advertising 85,200 100,100 80,000 79,100 81,800 100,600 79,400 74,900 69,900 Architecture 11,700 15,000 19,700 11,200 17,500 14,500 17,800 17,100 19,800
(arts) #N/A #N/A #N/A #N/A #N/A #N/A #N/A #N/A #N/A
Crafts 29,300 35,000 22,100 18,900 29,900 31,900 24,800 27,200 24,900 Design 43,000 37,200 35,600 40,600 50,300 48,600 48,200 37,500 28,800 Fashion 9,600 20,700 23,400 16,500 17,300 16,100 17,100 10,600 11,700 Interactive Leisure Software 32,100 36,800 44,300 53,600 60,600 70,000 67,100 92,100 87,600 Film and Video 17,300 13,600 14,700 16,400 16,700 14,200 14,500 18,300 14,700
Radio and TV 11,000 - 8,800 - - - - 24,200 26,900
Music and the performing Arts 28,600 35,400 38,800 42,800 46,000 50,200 44,200 57,100 48,200 Publishing and Printing 35,700 35,900 39,500 45,900 43,300 41,600 45,400 35,400 37,500 All creative occupations 304,100 336,200 327,400 331,000 368,200 393,300 364,800 394,900 370,300
GLA Economics 31
Creative occupations in the UK outside the creative industries
1994 1995 1996 1997 1998 1999 2000 2001 2002
Advertising 108,700 123,900 109,200 125,300 120,400 134,900 129,500 164,300 150,900 Architecture 28,400 26,600 27,600 26,000 25,800 22,600 26,500 23,800 25,900
(Arts) #N/A #N/A #N/A #N/A #N/A #N/A #N/A #N/A #N/A
Crafts 347,600 339,300 331,300 322,500 330,200 333,600 314,200 317,700 318,300 Design 54,600 54,300 47,500 52,800 57,200 58,200 67,600 97,500 106,000 Fashion 14,600 11,700 11,900 - - - 11,900 18,700 19,600 Interactive Leisure Software 108,000 111,100 120,300 147,500 163,400 176,200 194,400 241,600 254,800 Film and Video 12,600 17,400 18,700 16,900 12,100 11,700 17,700 17,200 11,800 Radio and TV 52,700 52,800 58,200 54,800 38,900 45,100 46,500 21,300 14,400 Music and the performing Arts 63,800 73,100 70,600 69,600 71,300 74,700 67,900 68,700 80,200 Publishing and Printing 97,800 102,200 103,200 105,400 96,800 94,200 91,400 96,600 88,600 All creative occupations 889,300 912,700 898,900 929,000 924,500 958,300 968,200 1,067,800 1,071,000
Creative occupations in London outside the creative industries
1,994 1,995 1,996 1,997 1,998 1,999 2,000 2,001 2,002
Advertising 36,700 52,700 39,600 48,100 44,500 50,100 38,300 50,500 43,800
Architecture - - - -
(Arts) #N/A #N/A #N/A #N/A #N/A #N/A #N/A #N/A #N/A
Crafts 30,500 36,500 23,000 18,400 31,000 33,800 25,100 26,600 24,800 Design 9,500 8,500 8,400 8,800 12,000 12,700 13,300 8,600 10,600
Fashion - - - -
Interactive Leisure Software 23,900 23,300 26,600 31,300 35,800 40,100 42,000 63,800 57,700
Film and Video - - - -
Radio and TV 8,700 - - - -
32 GLA Economics
Creative Sector Employment Total UK
1,994 1,995 1,996 1,997 1,998 1,999 2,000 2,001 2,002
Advertising #N/A 206,700 204,300 219,100 217,700 236,100 237,600 268,100 250,900 Architecture #N/A 243,800 240,600 235,100 232,900 229,500 233,500 230,000 224,200 (Arts) #N/A 14,700 16,600 15,500 16,000 16,300 17,500 18,800 19,300 Crafts #N/A 339,300 331,300 322,500 330,200 333,600 314,200 317,700 318,300 Design #N/A 54,300 47,500 52,800 57,200 58,200 67,600 97,500 106,000 Fashion #N/A 135,900 121,800 150,500 145,700 151,600 156,900 161,900 154,400 Interactive Leisure Software #N/A 203,500 227,500 264,700 300,600 329,100 355,300 408,900 417,000 Film and Video #N/A 64,700 69,100 72,800 69,300 66,200 74,100 77,100 74,500 Radio and TV #N/A 135,600 140,500 231,300 224,500 233,200 229,200 212,000 203,300 Music and the performing Arts #N/A 242,700 244,200 257,700 256,700 276,000 265,300 278,500 285,700 Publishing and Printing #N/A 268,700 280,400 194,400 189,000 197,800 190,500 202,500 190,300 All creative sector #N/A 1,910,300 1,924,200 2,016,800 2,040,400 2,128,300 2,142,200 2,273,700 2,244,600
Creative Employment Total London
1,994 1,995 1,996 1,997 1,998 1,999 2,000 2,001 2,002
Advertising #N/A 81,100 75,800 87,800 83,500 89,800 79,800 92,600 83,300 Architecture #N/A 81,000 82,300 75,200 75,900 74,900 77,600 74,900 74,200
(Arts) #N/A - - - -
Appendix 1: Transition to SOC2000
Introduction
In 2000 the ONS revised its standard classification of occupations (Standard Occupational Codes – SOC2000), superseding the previous (SOC1990) classification.
The re-classification affects the measurement of employment in the creative sector. A robust indicator of sector employment should not reflect changes which arise only because jobs have been reclassified. This appendix assesses some of the problems arising from the adoption of SOC2000 and examines possible solutions.
Where discrepancies arise
The GLA estimates creative sector employment using the standard introduced by the DCMS in its year 2001 mapping document, documented in its July 2002 Fact File and in
Economic Estimates. This has two components:
1. Jobs in the creative industries
2. People with creative occupations who work outside the creative industries.
The first component is measured using DCMS-defined SIC (Standard Industrial Classification) codes. The second is measured using DCMS-defined SOC codes. The primary source for the first component is the ABI; for the second, it is the LFS.
[image:36.612.110.528.503.725.2]From the first quarter of 2001 onwards, the LFS started using SOC2000 and stopped using SOC1990. DCMS supplies a list of codes that map both SOC1990 and SOC2000 classifications into its creative sub-sectors, as shown in Table A1.1
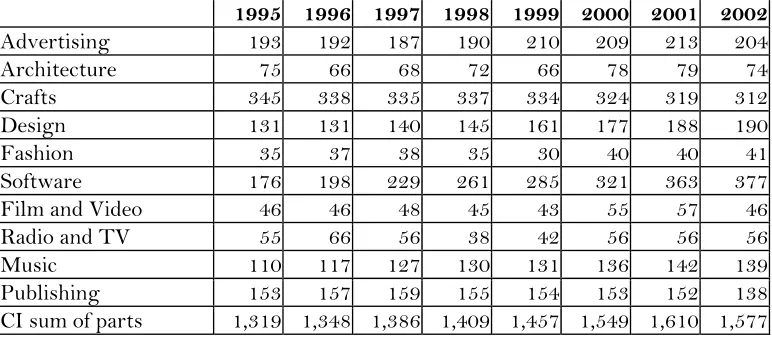
Table A1.1: Creative Occupational Employment [COE] (‘000s).
SOC 1990 SOC 2000
1995 1996 1997 1998 1999 2000 2001 2002
Advertising 62 62 60 61 68 68 213 204
Architecture 74 65 67 71 66 77 79 74
Crafts 131 128 127 127 126 122 319 312
Design 119 119 128 132 146 162 188 190
Leisure Software 280 316 364 415 454 512 363 377
Fashion 10 11 11 10 9 11 40 41
Music 133 142 153 157 159 164 142 139
Publishing/
Printing 236 242 244 239 237 235 152 138
Radio and TV 23 27 23 16 17 23 56 56
It is clear the codes do not precisely map onto each other. The shaded cells show
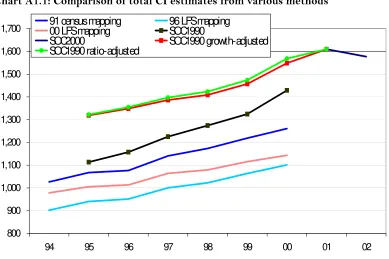
[image:37.612.90.523.173.460.2]significant jumps up or down. Table A1.2 shows the growth rates in these same years and also the annualised growth over the years before the transition. Again, anomalous growth rates are shaded grey. A classification change which to be corrected in order to construct consistent time series data.
Table A1.2: COE annual growth rates (anomalous growth shaded grey)
1996 %
1997 %
1998 %
1999 %
2000 %
Annualised growth 1995 to 2000 %
2001 %
2002 %
Advertising -1 -2 2 10 0 1.7 215 -4
Architecture -12 3 7 -8 18 0.8 2 -6
Crafts -2 -1 1 -1 -3 -1.3 161 -2
Design 0 7 3 11 10 6.3 17 1
Leisure
Software 13 15 14 9 13 12.8 -29 4
Fashion 6 2 -8 -13 30 2.5 256 2
Music etc 7 8 3 1 4 4.3 -14 -2
Publishing
etc 3 1 -2 -1 -1 -0.1 -35 -10
Radio and
TV 19 -15 -32 10 32 0.2 146 0
Film and
Video 1 4 -5 -5 27 3.8 4 -19
(Creative
Total) 4 6 4 4 8 5.1 13 -2
The ONS cross-mapping exercise
At the time of the changeover, no arrangements were made for transitional reporting. There are no LFS quarters in which both SOC1990 codes and the SOC2000 codes were directly recorded. However, an ONS study (ONS 2000b) sought to measure the relation between the two codes by retrospectively recoding the original responses in primary data. The study estimates the proportion of each SOC1990 category which, had it been code using SOC2000 criteria, would have been allocated to each SOC2000 category. It
provides this information for three sets of primary data: the 1991 census, to a single LFS quarter in 1996, and to a single LFS quarter in 2000.15
In principle the classification error arising from the transition could be corrected using the ONS study. However, as Table A1.3 shows, this results in estimates of COE whose growth rates, in the transition year, diverge even more from the past average than untransformed estimates based on the DCMS’s SOC1990 codes.

![Table A1.1: Creative Occupational Employment [COE] (‘000s).](https://thumb-us.123doks.com/thumbv2/123dok_us/8096829.786452/36.612.110.528.503.725/table-a-creative-occupational-employment-coe-s.webp)