© 2018, IRJET | Impact Factor value: 6.171 | ISO 9001:2008 Certified Journal | Page 2980
Study on the Seismic Response of a Steel Building with Viscous Fluid
Dampers – Chevron Configuration
J.Premalatha
1, M.Mrinalini
2, M.Palanisamy
31
Professor, Department of Civil Engineering, Kumaraguru College of Technology, Tamil Nadu, India
2
P.G Student Department of Civil engineering, Kumaraguru College of Technology, Tamil Nadu, India
3
Balaji Institute of Technology and science, Lakenpally, Narsampet, Warangal TamilNadu , India
---***---Abstract -
A 20-Storey benchmark steel moment resistingframe [1]Ohtori, Y (2004) is taken for study of seismic response reduction by providing viscous fluid dampers for chevron mechanisms. The model time history analysis of the frame subjected to four types of earthquake loads with chevron dampers is carried out. The Linear time history analysis (LTHA) was carried out and responses such as absolute acceleration, displacements, drifts, damper displacements and damper forces are found for all six models of chevron mechanism dampers for four different time histories considered for analysis such as El Centro, Kobe, Northridge and S_Monica with PGAs normalized to of 0.35g. LTHA was carried out for six different types of chevron mechanism damper with 40% damping coefficient. The effective placement of damper in the bare frame is found by comparing the peak average response reduction values of six different models of chevron dampers. CH_M_5 model damper placements are found to be more effective and cost effective compared to other types of damper placement and distribution. The peak average response reduction values for CH_M_5 are 63.5 for absolute acceleration, 43.2 for displacements and 39.8 for drifts.
Key Words: Linear Time History analysis, Chevron configuration, Viscous fluid dampers, Displacements, Absolute acceleration, Drifts
1. INTRODUCTION
In the present day scenario, the necessity of more flexible civil engineering structures such as tall buildings and long span bridges is increased and they are subjected to undesirable vibration, deformation and accelerations due to strong earthquakes, blasts, wind, moving loads, machines and large ocean waves. Excessive vibration in structures is an unwanted phenomenon which causes human discomfort, waste of energy, partial collapse of structural parts, transmits unnecessary forces and also poses a threat to structural safety and, sometimes leads to collapse.
In order to eliminate the undesirable effects of vibrations in structures, it is necessary to understand the behavior and response of structural systems subjected to dynamic loads such as earthquake and wind loads. One of the main challenges the structural engineers of the present decade are facing, is towards the development of innovative design concepts to protect the civil engineering structures from damages, including the material contents and human
occupants from the hazards of strong winds and earthquakes. Traditionally, the structural systems relied on their inherent strength and ability to dissipate energy to survive under severe dynamic loading and blast loads. The energy dissipation in such systems may occur by the inelastic cyclic deformations at the specially detailed plastic hinge regions of structural members. This causes localized damages in the structure as the structure itself must absorb much of the input energy from dynamic forces and this involves high cost of repair. But, for essential structures such as hospitals, police and fire stations must remain functional even after an earthquake. For a structure to remain functional after the earthquake, the conventional design approach is inappropriate as it allows a structure to undergo considerable damages.
Tall buildings are a special class of structures with their own peculiar characteristics and requirements. Tall buildings are often occupied by a large number of people. Therefore, their damage, loss of functionality, or collapse can have very severe and adverse consequences on the life and limb and on the economy of the affected regions. Each tall building represents a significant investment and as such tall building analysis and design is generally performed using more sophisticated techniques and methodologies. Furthermore, typical building code provisions are usually developed without particular attention to tall buildings, which represent a very small portion of the construction activity in most regions.
Therefore, understanding modern approaches to seismic analysis and design of tall buildings can be very valuable to structural engineers and researchers who would like to have a better grasp on design and performance of these icons of a modern megacity.
© 2018, IRJET | Impact Factor value: 6.171 | ISO 9001:2008 Certified Journal | Page 2981 In the few decades, the use of energy dissipation
devices in structural system has gained momentum. To keep the vibration of these structural systems within the functional and serviceability limits and to control and reduce structural and architectural damage caused by the extreme loads, different passive-, semi active-, active- and hybrid- devices and design methodologies are being developed. Addition of supplemental passive devices and semi active energy devices such as VFDs and MR dampers are considered to be viable strategies for enhancing the seismic performance of building structures. Several researchers have carried out theoretical and experimental studies on passive and semi-active vibration control systems.
The lateral loads mainly consist of seismic forces, blast load, wind load, mooring load, tsunami etc., amongst which the seismic force and the wind force are the common ones. The application of these forces and the behavior of the structure vary.
In order to design a structure to resist wind and earthquake loads, the forces on the structure must be specified. The exact forces that will occur during the life of the structure cannot be anticipated. Most national building codes identify some factors according to the boundary conditions of each building considered in the analysis to provide for life safety[2] (Khaled, M H., 2012).
The placing of fluid dampers to a structure does not significantly alter its natural period, but it increases damping from about 2 to 5% (internal damping) to between 20% and 40%, and sometimes even more[3] (Haskell and lee, 2007). It is found that external damping beyond 30% results in small decrease in responses, and such increases lead to usage of more dampers [4](Hanson and soong, 2001).
An analytical study was carried out on three new configurations of toggle braced dampers about their configurations, placements, equation, magnification factors and efficiency . Experimental verification was done on these toggle dampers [5] Constantinou MC, et.al, (2001).
Ohtori, Y (2004) [1] proposed a guideline for set of benchmark control problems for seismically excited nonlinear buildings for 3-, 9- and 20- storey steel frame structures and developed various structural control strategies.
In the present study, G+19 storey steel frame structure are considered for linear time history analysis subjected to four types of time history earthquakes such as Elcentro, Kobe, Northridge and S_Monica with their PGAs normalized to 0.35 using SAP2000. For a steel frame structure, a lateral force resisting system namely viscous damper in Chevron configuration is implemented while analyzing the building.
The following are the objective of the present work.
To study the responses such as displacements, acceleration, inter-storey drifts in 20-storey moment resistant steel frame subjected to four types of earthquake loadings for bare frame structure, and chevron damped structures.
To study the response reduction in steel frame structure for different types of damper configuration and damper type in comparison with bare frame structure.
To study about the damper responses such as damper displacements and damper forces for the viscous fluid dampers placed in the building during earthquake excitation.
To find the effective damper configurations to be provided in a steel frame structure.
DESCRIPTION OF MODEL
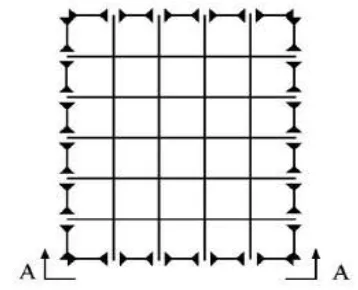
[image:2.595.342.521.386.531.2]The plan, and elevation of the 20-storey bench mark building considered in the present study are shown in Fig 1 and Fig 2.
© 2018, IRJET | Impact Factor value: 6.171 | ISO 9001:2008 Certified Journal | Page 2982 Fig 2 Elevation of Twenty storey benchmark building,
1.1 CHEVRON BRACE CONFIGURATION
[image:3.595.49.270.88.443.2]In Chevron configuration (Fig-3 and Fig-4) the energy dissipation devices are fixed parallel to beam element in structure. The magnification factor for chevron braced configuration is equal to one. The magnification factor depends on the angle of inclination and placement of dampers. The magnification factor is defined as the ratio of damper displacement to inter-storey drift. It is denoted as f. For chevron bracing the magnification factor (f) = 1.
[image:3.595.47.270.593.749.2]Fig -3 Chevron configuration above ground floor
Fig- 4 Chevron configuration for ground floor
The damping coefficient (C0) values for chevron damper to be used as input in SAP2000 are given in Table 1. There are six different types of chevron mechanism damper configuration (CH_M1, CH_M2, CH_M3, CH_M4, CH_M5, and CH_M6)to distribute along the height of the frame. The corresponding detail of placing dampers along the frame are as shown in Fig-5.
2 TYPES OF CHEVRON CONFIGURATION DAMPER
MODELS
Six different types of chevron mechanism damper models (CH_M1, CH_M2, CH_M3, CH_M4, CH_M5, and CH_M6)are considered for analysis to find the effective placements and distribution of lower toggle mechanism system. The chevron mechanism systems are distributed along the height of the frame. The corresponding models of placing dampers along the frame are as shown in Figure 3. The following six models are used for the study.
1. Model_1 (CH_M1): Dampers are placed in all stories along the height of the building and distributed as 5 chevron along with dampers per storey. So that total number of dampers placed throughout the height is 100. The distributions of dampers are as shown in Fig-5 (a).
2. Model_2 (CH_M2): Dampers are placed in G+9 stories throughout the bay length such as 5chevronconfigurations dampers in each stories and from 10th to 20th storey dampers are placed in 2nd, 3rd and 4th bay length such as 3chevron configuration dampers per story. So that, total numbers of dampers placed along the height of the building are 80. The distributions of dampers are as shown in Fig-5 b).
© 2018, IRJET | Impact Factor value: 6.171 | ISO 9001:2008 Certified Journal | Page 2983 the height of the building are 80. The distributions of
dampers are as shown in Fig- 5 c).
4. Model_4 (CH _M4): Dampers are placed in G+9 stories throughout the bay length such as 5chevron configuration dampers in each stories and from 10th to 20th storey dampers are placed in 3rd bay length alone, such as 1chevron configuration dampers per story. So that, total numbers of dampers placed along the height of the building are 60. The distributions of dampers are as shown in Fig- 5 d).
5. Model_5 (CH _M5): Dampers are placed in G+4 stories throughout the bay length such as 5chevron configuration dampers in each stories and from 5th to 20th storey dampers are placed in 1st, 3rd and 5th bay length, such as 3chevron configuration dampers per story. So that, total numbers of dampers placed along the height of the building are 70. The distributions of dampers are as shown in Fig- 5 e).
6. Model_6 (CH _M6): Dampers are placed in ground story alone for the bay length such as 5chevron configuration dampers in that storey and from 1th to 19th storey dampers are placed in 1st, 3rd and 5th bay length, such as 3 chevron configuration dampers per story. So that, total numbers of dampers placed along the height of the building are 62. The distributions of dampers are as shown in Fig-5 f).
[image:4.595.328.538.59.650.2]For six different types of chevron mechanism damper configuration linear time history analysis are made and 40% of damping are used for present study based upon base shear graphs. So, damping coefficient values of 40% is used for analyzing all models.
Table 1 Damping coefficients (C0) for chevron dampers in kN
zeta Entire building storey
Distribution of damping coefficient
5 dampers per storey
3 dampers per storey
1 dampers per storey
0.1 87865 4393 879 1464 4393
0.2 175730 8787 1757 2929 8787
0.3 263600 13180 2636 4393 13180
0.4 351460 17573 3515 5858 17573
0.5 439330 21966 4393 7322 21966
0.6 527190 26360 5272 8787 26360
0.7 615060 30753 6151 10251 30753
0.8 702920 35146 7029 11715 35146
0.9 790790 39539 7908 13180 39539
1 878650 43933 8787 14644 43933
a) CH_M1 b) CH_M2
© 2018, IRJET | Impact Factor value: 6.171 | ISO 9001:2008 Certified Journal | Page 2984 e) CH_M5 f) CH_M6
Fig- 5 Six different models of chevron placements in bare frame
3 LINEAR TIME HISTORY ANALYSIS FOR CHEVRON
MECHANISM AND ITS RESPONSES
Linear time history analysis was carried out and responses such as absolute acceleration, displacements, drifts, damper displacements and damper forces are found for all six models of chevron mechanism dampers for four different time histories considered for analysis such as El Centro, Kobe, Northridge and S_Monica with PGAs normalized to of 0.35g.
[image:5.595.306.553.225.490.2]The responses of absolute acceleration (a), displacements (d), The responses of inter-storey drifts (dr) for all six models are presented in Table-2, Table-3, Table-4, Table-5, Table-6, and Table-7 and represented as graphs in Fig-6, Fig-7, Fig-8, Fig-9, Fig-10 and Fig-11.
Table -2 Peak Response Reduction b/w BF and CH_M_1 for peak absolute acceleration, displacements and drifts
S A d Drifts % difference
BF CH_M_1 BF CH_M_1 BF CH_M_1 a d drifts
20 9.57 2.05 0.39 0.34 0.034 0.012 78.6 13.9 65.3
19 5.24 1.72 0.38 0.33 0.021 0.013 67.2 13.9 36.4
18 4.95 1.52 0.36 0.31 0.028 0.015 69.2 12.6 46.1
17 4.85 1.35 0.33 0.30 0.029 0.016 72.1 9.8 45.9
16 4.14 1.22 0.30 0.28 0.028 0.016 70.5 6.3 43.4
15 4.62 1.11 0.30 0.27 0.024 0.017 76.0 10.4 28.7
14 4.89 1.10 0.29 0.25 0.015 0.018 77.6 15.5 18.8
13 4.55 1.38 0.29 0.23 0.016 0.016 69.6 21.5 0.2
12 5.85 1.72 0.30 0.21 0.021 0.017 70.6 29.6 19.9
11 6.12 2.02 0.31 0.20 0.023 0.017 67.1 35.9 24.9
10 5.98 2.25 0.30 0.18 0.017 0.017 62.4 40.6 0.9
9 6.13 2.41 0.29 0.16 0.020 0.017 60.6 43.7 15.4
8 6.44 2.53 0.27 0.15 0.026 0.018 60.6 45.9 31.9
7 6.49 2.62 0.24 0.13 0.024 0.018 59.7 47.3 26.6
6 5.88 2.72 0.22 0.11 0.026 0.018 53.7 49.6 32.0
5 5.54 2.86 0.20 0.09 0.030 0.017 48.4 53.1 42.0
4 5.68 3.03 0.17 0.08 0.034 0.017 46.7 55.0 51.8
3 5.21 3.27 0.13 0.06 0.038 0.016 37.1 55.9 57.1
2 5.76 3.61 0.10 0.04 0.041 0.017 37.3 55.4 59.5
1 4.609 4.04 0.056 0.03 0.056 0.027 12.2 52.3 52.3
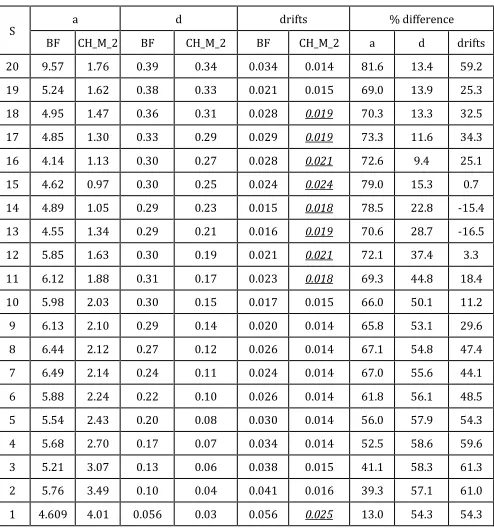
Table-3 Peak Response Reduction b/w BF and CH_M_2 for peak absolute acceleration, displacements and drifts
S a d drifts % difference
BF CH_M_2 BF CH_M_2 BF CH_M_2 a d drifts
20 9.57 1.76 0.39 0.34 0.034 0.014 81.6 13.4 59.2 19 5.24 1.62 0.38 0.33 0.021 0.015 69.0 13.9 25.3 18 4.95 1.47 0.36 0.31 0.028 0.019 70.3 13.3 32.5 17 4.85 1.30 0.33 0.29 0.029 0.019 73.3 11.6 34.3
16 4.14 1.13 0.30 0.27 0.028 0.021 72.6 9.4 25.1
15 4.62 0.97 0.30 0.25 0.024 0.024 79.0 15.3 0.7 14 4.89 1.05 0.29 0.23 0.015 0.018 78.5 22.8 -15.4 13 4.55 1.34 0.29 0.21 0.016 0.019 70.6 28.7 -16.5 12 5.85 1.63 0.30 0.19 0.021 0.021 72.1 37.4 3.3 11 6.12 1.88 0.31 0.17 0.023 0.018 69.3 44.8 18.4 10 5.98 2.03 0.30 0.15 0.017 0.015 66.0 50.1 11.2 9 6.13 2.10 0.29 0.14 0.020 0.014 65.8 53.1 29.6 8 6.44 2.12 0.27 0.12 0.026 0.014 67.1 54.8 47.4 7 6.49 2.14 0.24 0.11 0.024 0.014 67.0 55.6 44.1 6 5.88 2.24 0.22 0.10 0.026 0.014 61.8 56.1 48.5 5 5.54 2.43 0.20 0.08 0.030 0.014 56.0 57.9 54.3 4 5.68 2.70 0.17 0.07 0.034 0.014 52.5 58.6 59.6 3 5.21 3.07 0.13 0.06 0.038 0.015 41.1 58.3 61.3 2 5.76 3.49 0.10 0.04 0.041 0.016 39.3 57.1 61.0 1 4.609 4.01 0.056 0.03 0.056 0.025 13.0 54.3 54.3
Table 4 Peak Response Reduction b/w BF and CH_M_3 for peak absolute acceleration, displacements and drifts
S
a d drifts % difference
BF CH_M_3 BF CH_M_3 BF CH_M_3 a d drifts
20 9.57 1.76 0.39 0.34 0.034 0.014 81.6 13.4 59.2
19 5.24 1.62 0.38 0.33 0.021 0.015 69.0 13.9 25.3
18 4.95 1.47 0.36 0.31 0.028 0.019 70.3 13.3 32.5
17 4.85 1.30 0.33 0.29 0.029 0.019 73.3 11.6 34.3
16 4.14 1.13 0.30 0.27 0.028 0.021 72.6 9.4 25.1
15 4.62 0.97 0.30 0.25 0.024 0.024 79.0 15.3 0.7
14 4.89 1.05 0.29 0.23 0.015 0.018 78.5 22.8 -15.4
13 4.55 1.34 0.29 0.21 0.016 0.019 70.6 28.7 -16.5
12 5.85 1.63 0.30 0.19 0.021 0.021 72.1 37.4 3.3
11 6.12 1.88 0.31 0.17 0.023 0.018 69.3 44.8 18.4
10 5.98 2.03 0.30 0.15 0.017 0.015 66.0 50.1 11.2
9 6.13 2.10 0.29 0.14 0.020 0.014 65.8 53.1 29.6
8 6.44 2.12 0.27 0.12 0.026 0.014 67.1 54.8 47.4
[image:5.595.34.564.557.788.2]© 2018, IRJET | Impact Factor value: 6.171 | ISO 9001:2008 Certified Journal | Page 2985
6 5.88 2.24 0.22 0.10 0.026 0.014 61.8 56.1 48.5
5 5.54 2.43 0.20 0.08 0.030 0.014 56.0 57.9 54.3
4 5.68 2.70 0.17 0.07 0.034 0.014 52.5 58.6 59.6
3 5.21 3.07 0.13 0.06 0.038 0.015 41.1 58.3 61.3
2 5.76 3.49 0.10 0.04 0.041 0.016 39.3 57.1 61.0
[image:6.595.32.299.215.475.2]1 4.609 4.01 0.056 0.03 0.056 0.025 13.0 54.3 54.3
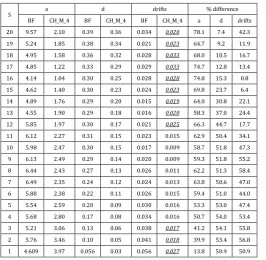
Table 5 Peak Response Reduction b/w BF and CH_M_4 for peak absolute acceleration, displacements and drifts
S a d drifts % difference
BF CH_M_4 BF CH_M_4 BF CH_M_4 a d drifts
20 9.57 2.10 0.39 0.36 0.034 0.020 78.1 7.4 42.3
19 5.24 1.85 0.38 0.34 0.021 0.023 64.7 9.2 11.9
18 4.95 1.58 0.36 0.32 0.028 0.033 68.0 10.5 16.7
17 4.85 1.22 0.33 0.29 0.029 0.033 74.7 12.8 13.4
16 4.14 1.04 0.30 0.25 0.028 0.028 74.8 15.3 0.8
15 4.62 1.40 0.30 0.23 0.024 0.023 69.8 23.7 6.4
14 4.89 1.76 0.29 0.20 0.015 0.019 64.0 30.8 22.1
13 4.55 1.90 0.29 0.18 0.016 0.020 58.3 37.0 24.4
12 5.85 1.97 0.30 0.17 0.021 0.025 66.3 44.7 17.7
11 6.12 2.27 0.31 0.15 0.023 0.015 62.9 50.4 34.1
10 5.98 2.47 0.30 0.15 0.017 0.009 58.7 51.8 47.3
9 6.13 2.49 0.29 0.14 0.020 0.009 59.3 51.8 55.2
8 6.44 2.43 0.27 0.13 0.026 0.011 62.2 51.3 58.4
7 6.49 2.35 0.24 0.12 0.024 0.013 63.8 50.6 47.0
6 5.88 2.38 0.22 0.11 0.026 0.015 59.4 51.0 44.0
5 5.54 2.59 0.20 0.09 0.030 0.016 53.3 53.0 47.4
4 5.68 2.80 0.17 0.08 0.034 0.016 50.7 54.0 53.4
3 5.21 3.06 0.13 0.06 0.038 0.017 41.2 54.1 55.8
2 5.76 3.46 0.10 0.05 0.041 0.018 39.9 53.4 56.8
1 4.609 3.97 0.056 0.03 0.056 0.027 13.8 50.9 50.9
Table 6 Peak Response Reduction b/w BF and CH_M_5 for Peak absolute acceleration,
displacements and drifts
S a d drifts % difference
BF CH_M_5 BF CH_M_5 BF CH_M_5 a d drifts 20 9.57 1.46 0.39 0.30 0.034 0.011 84.8 22.7 67.8 19 5.24 1.32 0.38 0.29 0.021 0.013 74.9 22.8 38.5 18 4.95 1.19 0.36 0.28 0.028 0.017 75.9 21.9 40.0 17 4.85 1.03 0.33 0.26 0.029 0.017 78.7 20.4 42.4 16 4.14 0.91 0.30 0.25 0.028 0.018 78.0 18.2 35.9 15 4.62 0.89 0.30 0.23 0.024 0.019 80.7 23.2 19.6 14 4.89 0.96 0.29 0.21 0.015 0.017 80.3 29.2 10.4 13 4.55 1.21 0.29 0.19 0.016 0.016 73.5 34.8 2.6 12 5.85 1.47 0.30 0.18 0.021 0.018 74.8 42.4 17.8 11 6.12 1.72 0.31 0.16 0.023 0.013 72.0 48.8 43.6 10 5.98 1.89 0.30 0.15 0.017 0.014 68.4 52.0 19.4 9 6.13 2.03 0.29 0.13 0.020 0.015 66.8 53.9 26.5 8 6.44 2.17 0.27 0.12 0.026 0.015 66.3 55.4 41.1 7 6.49 2.34 0.24 0.11 0.024 0.015 64.0 56.6 39.2 6 5.88 2.58 0.22 0.09 0.026 0.015 56.1 58.4 42.2 5 5.54 2.86 0.20 0.08 0.030 0.013 48.3 61.5 57.4
4 5.68 3.11 0.17 0.06 0.034 0.012 45.2 62.3 64.1 3 5.21 3.39 0.13 0.05 0.038 0.013 35.0 61.8 65.2 2 5.76 3.72 0.10 0.04 0.041 0.015 35.4 60.5 64.4 1 4.609 4.13 0.056 0.02 0.056 0.024 10.4 57.5 57.5
Table 7 Peak Response Reduction b/w BF and CH_M_6 for peak absolute acceleration, displacements and drifts
S
A d drifts % difference
BF M_6 CH_ BF CH_M_6 BF CH_M_6 a d drifts
20 9.57 1.48 0.39 0.30 0.034 0.011 84.5 22.9 67.4
19 5.24 1.34 0.38 0.29 0.021 0.013 74.4 23.1 37.8
18 4.95 1.21 0.36 0.28 0.028 0.017 75.6 22.2 39.3
17 4.85 1.03 0.33 0.26 0.029 0.017 78.7 20.8 41.9
16 4.14 0.87 0.30 0.24 0.028 0.017 78.9 18.7 39.0
15 4.62 0.86 0.30 0.23 0.024 0.015 81.4 23.4 37.6
14 4.89 0.91 0.29 0.21 0.015 0.014 81.4 27.9 7.1
13 4.55 1.15 0.29 0.20 0.016 0.018 74.8 32.6 7.7
12 5.85 1.39 0.30 0.18 0.021 0.017 76.1 40.8 19.4
11 6.12 1.61 0.31 0.16 0.023 0.013 73.7 47.1 43.5
10 5.98 1.75 0.30 0.15 0.017 0.014 70.7 49.4 19.7
9 6.13 1.86 0.29 0.14 0.020 0.015 69.6 50.8 27.3
8 6.44 1.95 0.27 0.13 0.026 0.015 69.8 51.7 41.2
7 6.49 2.05 0.24 0.12 0.024 0.014 68.5 52.1 41.3
6 5.88 2.21 0.22 0.10 0.026 0.015 62.3 53.2 43.8
5 5.54 2.44 0.20 0.09 0.030 0.014 55.9 55.5 54.1
4 5.68 2.69 0.17 0.07 0.034 0.015 52.6 55.7 55.1
3 5.21 3.00 0.13 0.06 0.038 0.018 42.3 55.8 53.1
2 5.76 3.51 0.10 0.04 0.041 0.018 39.1 56.9 57.1
1 4.609 4.06 0.056 0.02 0.056 0.024 12.0 56.8 56.8
© 2018, IRJET | Impact Factor value: 6.171 | ISO 9001:2008 Certified Journal | Page 2986 Fig-7 Peak absolute accelerations and their response
[image:7.595.316.542.88.323.2]reduction compared to BF for six models of CHD
[image:7.595.68.265.313.504.2]Fig-8 Peak Displacements
Fig-9 Peak displacements and their response reduction compared to BF for six models of CHD
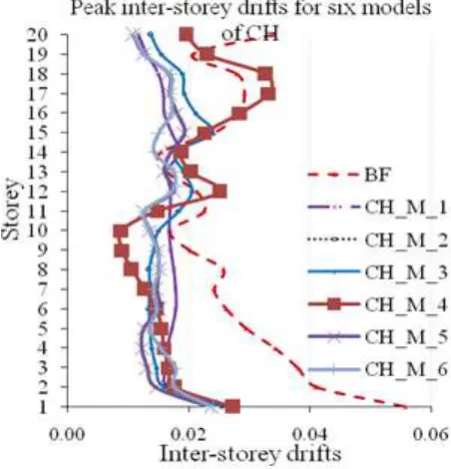
[image:7.595.309.555.358.588.2]Fig-10 Peak Inter-storey drifts for six models
Fig-11 Peak inter-storey drifts and their response reduction compared to BF for six models of CHD
4 RESULTS AND DISCUSSIONS
[image:7.595.66.266.507.736.2]© 2018, IRJET | Impact Factor value: 6.171 | ISO 9001:2008 Certified Journal | Page 2987 The effective placement of damper in the bare frame
is found by comparing the peak average response reduction values of six different models of chevron dampers. CH_M_5 model damper placements are found to be more effective and cost effective compared to other types of damper placement and distribution. The peak average response reduction values of CH_M_5 are 63.5 for absolute acceleration, for displacements 63.5 ,43.2 and 39.8 for drifts.
5 CONCLUSIONS
The study on a 20 storey steel model frame with six different configuration of chevron dampers was carried out under various LTHA. Based on the seismic performance , the optimum position of chevron dampers in the model frame is arrived .The effective placement of damper in the bare frame is found by comparing the peak average response reduction values of six different models of chevron dampers. CH_M_5 model damper placements are found to be more effective and cost effective compared to other types of damper placement and distribution. The peak average response reduction values of the frame model CH_M_5 for absolute acceleration, storey displacements and drifts are 63.5 , 43.2and 39.8 respectively.
REFERENCES
[1] Y. Ohtori, R. E. Christenson, B. F. Spencer, S. J. Dyke
(2004) Bench mark control problems for seismically excited non linear buildings”, jornal of Engineering mechanics, volume 130 Issue 4 April 2004 pp.366-385.
[2] Khaled, M H., and Magdy, A T., “Comparative Study of
The Effects of Wind and Earthquake Loads on High-rise Buildings”, Concrete research letters (www.crl.issres.net), Vol. 3(1), March 2012.
[3] Haskell G and Lee D. Fluid Viscous Damping as an
Alternative to Base Isolation.
http://www.taylordevices.com/FluidViscousDamping.h tm accessed on 7.05.2007
[4] Hanson RD and Soong TT Seismic design with
supplemental energy dissipation devices, EERI Publication No. MNO-8, 2001.
[5] Constantinou MC, Tsopelas P, Hammel W and Sigaher