An Extended Density based Clustering Algorithm for
Large Spatial 3D Data using Polyhedron Approach
Hrishav Bakul Barua
Research Scholar,Dept. of Computer Science and Engineering, Jorhat Engineering College, Jorhat-785007,
Assam
Sauravjyoti Sarmah
Assistant Professor,Dept. of Computer Science and Engineering, Jorhat Engineering College, Jorhat-785007,
Assam
ABSTRACT
Discovering the meaningful patterns and trends out of large datasets needs a very special attention now a days, and one of the most prevalent and widely studied problems in this area is the detection and formation of clusters accurately and correctly. Previous works on this field does not meet the problem of 3D spatial datasets with minimization of Input Parameters. The objective of this paper is to present a Tetrahedron-density based clustering technique for large 3D datasets which we have named as 3D-CATD (Three Dimensional-Clustering Algorithm using Tetrahedron Density), for efficient clustering of 3D spatial data. This algorithm is capable of identifying embedded clusters of arbitrary shapes as well as multi-density clusters over large 3D spatial datasets. The polyhedron approach is being incorporated to perform the clustering where the number of points inside a tetrahedron (tetrahedron density) of a polyhedron is calculated using barycentric formulae for tetrahedron. This is because of the fact that partitioning of the data set can be performed more efficiently in tetrahedron shape than in any other 3D shape due to its smaller space dimension. The ratio of number of points between two tetrahedrons can be found out which forms the basis of nested clustering of 3D data. Experimental results establish the superiority of the technique in terms of cluster quality and complexity.
General Terms
Clustering Algorithms, Design, Experimentation, Performance
Keywords
Clustering, Density- based, Density Confidence, Polyhedron approach, Tetrahedron-density
1.
INTRODUCTION
In this paper, the technique of data clustering has been examined, specially 3D extended data clustering, which is a particular kind of data mining problem in KDD (Knowledge Discovery from Data).The process of grouping a set of physical or abstract objects into classes of similar objects is called clustering. A cluster is a collection of data objects that are similar to one another within the same cluster and are dissimilar to the objects in other clusters [1]. Given a large set of data
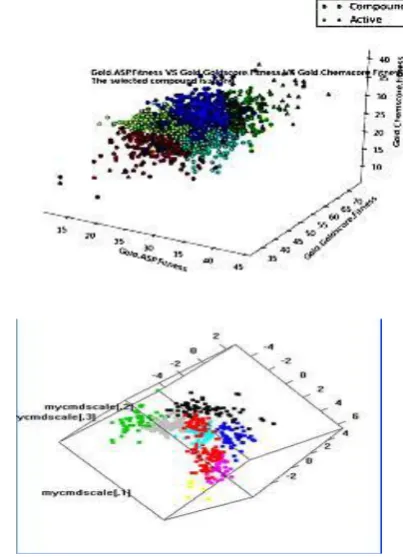
[image:1.595.329.531.420.699.2]points (data objects); the data space is usually not uniformly occupied. Data Clustering identifies the sparse and the crowded places, and hence discovers the overall distribution patterns of the data set.Besides, the derived clusters can be visualized more efficiently and effectively than the original dataset. Mining knowledge from large amounts of spatial data is known as spatial data mining. It becomes a highly demandingfield because huge amounts of spatial data have been collected in various applications ranging from geo-spatial data to bio-medical knowledge. The amount of spatial data being collected is increasing exponentially and has far exceeded human’s ability to analyze them. Recently, clustering has been recognized as a primary data mining method for knowledge discovery in spatial database. The development of clustering algorithms has received a lot of attention in the last few years and new clustering algorithms are proposed.
Figure 1- Formation of clusters in 3D spatial datasets-an overview
the density-based approach is famous for its
capability of discovering arbitrary shaped clusters
of good quality even in noisy datasets [2]. Density
Based Spatial Clustering of Applications with
Noise (DBSCAN) and Ordering Points to Identify
the Clustering Structure (OPTICS) are two of the
most popular density based clustering algorithms.
In density-based clustering algorithms, a cluster is
defined as a high-density region partitioned by
low-density regions in data space. They can find
out the clusters of different shapes and sizes from
the large amount of data containing noise and
outliers.Fig. 1 depicts the formation of clusters of
similar data in 3D spatial dataset. This project,
which is primarily motivated by Density Based
Clustering, aims at proposing a new density based
clustering technique for efficient clustering of
spatial data.The rest of the paper is organized as
follows. Section 2 provides a selected literary
review on density based, grid based and other
multi-density as well as variable density data
clustering techniques. Section 3 illustrates the
background of the proposed work and section 4
gives the final proposed algorithm. In section 5,
we present the experimental results and the
performance analysis of the work. Lastly, we
conclude with a summary in section 6.
2. RELATED WORKS (Previous works in
the field)
This section portrays a selected literary review on some of the previous works in this field specially some relevant density based as well as grid based clustering techniques that works on 2D datasets but their principles can be used inextended 3D data sets.
2.1. Density Based Approach
Most partitioning methods cluster objects based on the distance between the objects. Such methods can find only spherical-shaped clusters and encounter difficulty at discovering clusters of arbitrary shapes. Other clustering methods have been developed based on the notion of the density. Their general idea is to continue growing the given cluster as long as the density(number of objects or data points) in the neighborhood exceeds some threshold; that is for each data point within a given cluster, the neighborhood of a given radius has to contain at least a minimum number of points. Such a method can be used to filter out noise (outliers) and discover clusters of arbitrary shape.To discover clusters with arbitrary shape, density based clustering methods have been developed. These typically regard clusters as dense regions of objects in the data space that are separated by regions of low density. DBSCAN [2] grow
clusters according to a density-based connectivity analysis. OPTICS extends DBSCAN [2] to produce a cluster ordering obtained from a wide range of parameter settings.The idea behind density based clustering approach is that the density of points within a cluster is higher as compared to those outside of it. DBSCAN [2] is a density based clustering algorithm capable of discovering clusters of various shapes even in presence of noise. The key idea of DBSCAN is that for each point of a cluster, the neighborhood of a given radius (ε) has to contain at least a minimum number of points and the density in the neighborhood has to exceed some threshold. It is efficient for large spatial databases but, for massive datasets, it becomes very time consuming, even if the use of R* tree is made. Another drawback of DBSCAN is that due to the use of the global density parameters, it fails to detect embedded or nested clusters.
2.2. Grid Based Approach
of dimensions in the data increases. However, the accuracy of the clustering result may bedegraded at the expense of simplicity of the method. pMAFIA [7] is an optimized and improved version of CLIQUE. It uses the concept of adaptive grids for detecting the clusters. It scales exponentially to the dimension of the cluster of thehighest dimension in the data set.
2.3. Clustering Over Multi Density Data Space:
One of the main applications of clustering spatial databases is to find clusters of spatial objects which are close to each other. Most traditional clustering algorithms try to discover clusters of arbitrary densities, shapes and sizes. Very few clustering algorithms show preferable efficiency when clustering multi-density datasets. This is also because small clusters with small number of points in a local area are possible to be missed by a global density threshold. Some clustering algorithms that can cluster on multi-density datasets are Chameleon [8], SNN [9] (shared nearest neighbor), and the multi-stage density-isoline algorithm [10] and so on. Chameleon [8] can handle multi-density datasets, but for large datasets the time complexity is too high. SNN [9] algorithm can find clusters of varying shapes, sizes and densities and can also handle multi-density dataset. The disadvantage of SNN is that the degree of precision is low on the multi-density clustering and finding outliers. The multi-stage density-isoline algorithm [10] clusters datasets by the multi-stage way and the idea of density-isoline. The disadvantage of the algorithm is that each cluster cannot be separated efficiently. DGCL [11] is based on density-grid based clustering approach. But, since it uses a uniform density threshold it causes the low density clusters to be lost.
2.4. Clustering Over Variable Density Space:
Most of the real life datasets have a skewed distribution and may also contain nested cluster structures the discovery of which is very difficult. Therefore, we discuss two density based approaches, OPTICS [12] and EnDBSCAN [13], which attempt to handle the datasets with variable density successfully. OPTICS can identify embedded clusters over varying density space. However, its execution time performance degrades in case of large datasets with variable density space and it cannot detect nested cluster structures successfully over massive datasets. In EnDBSCAN [13], an attempt is made to detect embedded or nested clusters using an integrated approach. Based on our experimental analysis in light of very large synthetic datasets, it has been observed that EnDBSCAN can detect embedded clusters; however, with the increase in the volume of data, the performance of it also degrades. EnDBSCAN is highly sensitive to the parameters MinPts and ε. In
addition to the above mentioned parameters, OPTICS requires an additional parameter i.e. ε'.
2.5. Clustering High- Dimensional Data:
Most of the clustering methods stated above are implemented in 2D spatial datasets. The need for clustering in 3D spatial datasets is highly demanded. In case of space research and Geo-Spatial data or 3D object detection an efficient clustering algorithm is required. CLIQUE is a dimension-growth subspace clustering method [21]. Here, process starts at single dimensional subspace and extends to higher dimensional ones. CLIQUE is a combination of density and grid based clustering method. Here the data space is portioned into non overlapping rectangular units, identifying the dense units out of them.
2.6. Based on our selected literature survey and experimental analysis, it has been observed that:
1) Density based approach is most suitable for quality cluster detection over massive datasets as well as 3D datasets.
2) Grid based approach is suitable for fast processing of large datasets in 2D and 3D domain.
3) Almost all clustering algorithms require input parameters, accurate determination of which are very difficult, especially for real world data sets containing high dimensional objects. Moreover, the algorithms are highly sensitive to those parameters.
4) None of the techniques discussed above, is capable in handling multi-density datasets as well as multiple intrinsic or nested clusters over massive datasets qualitatively.
5) Only a few of the above techniques can handle higher dimensional datasets and mostly concentrated at 2D spatial datasets.
2.7. Motivation
shapes. These typically regard clusters as dense regions of objects in the data space that are separated by regions of low density (representing noise). DBSCAN grow regions with sufficiently high density into clusters and discover clusters of arbitrary shape in spatial database with noise according to a density-based connectivity analysis. It defines a cluster as a maximal set of density-connected points.
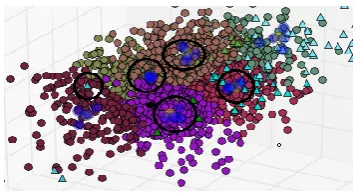
[image:4.595.385.494.421.636.2]The major drawback in such clustering approaches is the processing time. The time to scan the whole database and cluster accordingly is a major area of concern. This paper is motivated by the density-based clustering approaches to discover nested clusters and clusters of arbitrary shapes over 3D data space. Fig. 2 displays a nested cluster as well as a multi-density cluster. The basic idea is to reduce the processing time and enhance the efficiency henceforth. For the fulfillment of the requirements of the undertaken research the sampling technique is proposed. It is used as a data reduction technique because it allows a large data set to be represented by a much smaller random sample (or subset) of the data. An advantage of sampling for data reduction is that the cost of obtaining a sample is proportional to the size of the sample, as opposed to the whole data set size. Other data reduction techniques can require at least one complete pass through. Sampling is a natural choice for progressive refinement of a reduced data set. Such a set can be further refined by simply increasing the sample size. This technique of clustering can be efficiently used in a spatial database, where we can choose to define clusters geographically based on how closely different areas are located. Better cluster quality and more acceptable complexity are the major features of the proposed approach of 3D clustering.
Figure 2- Multi-density and nested clusters (those highlighted by black circles are nested clusters)
3. THEORITICAL BACKGROUND OF
THE PROPOSED WORK
The distribution of data in a data set is not uniform in general. Some portions of the data space are highly densewhile some portions are sparse. The problem associated here is efficient clustering of spatial data
points to discover nested clusters and clusters of arbitrary shapes using density based clustering technique.
3.1. Definitions
Here, we introduce some definitions which are used in the proposed algorithm of 3D spatial data clustering:
Definition 1Tetrahedron Density: The number of 3D spatial point objects within a particular tetrahedron of a particular polyhedron.
Definition 2Useful Tetrahedron: Only those tetrahedrons which are populated i.e., which contain data points will be treated as useful tetrahedrons.
Definition 3Neighbor Tetrahedron: Those tetrahedrons which have a common side (side neighbors) to the current tetrahedron are the neighbors of the current tetrahedron. Fig. 3 (a) shows a regular tetrahedron (with three of its triangular sides in yellow, blue and green shades respectively and one in red lines i.e. the one facing the reader). Fig. 3 (b) shows the four neighbor tetrahedrons of tetrahedron shown in 3 (a) which together form a polyhedron.
Figure. 3(a) & 3(b) - Neighbor tetrahedrons of the current tetrahedron
[image:4.595.78.257.552.650.2]cluster in 3D. Therefore the following condition should be satisfied: β ≤ dn (TP1) / dn (Tp2) where
dn represents the density of the particular
tetrahedron.
Definition 5 Reachability of a tetrahedron: A tetrahedron p is reachable from a tetrahedron q if p is a neighbor tetrahedron of q and tetrahedron p satisfies the density confidence condition w.r.t. tetrahedron q.
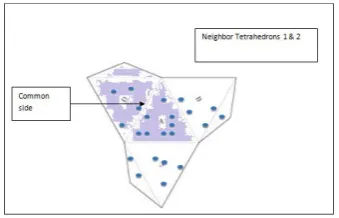
[image:5.595.62.275.293.464.2]Definition 6Neighbor Polyhedron: Those polyhedrons which are formed from classified data points (points which lie in merged tetrahedrons) of the current polyhedron as its center are called as neighbor polyhedrons of the current polyhedron. Fig. 4 shows a neighbor polyhedron 2 of polygon 1.
Figure 4- Neighbor polyhedron 2 of polyhedron 1
Definition 7 Reachability of a polyhedron: A polyhedron 2 is reachable from polyhedron 1 if 2 is neighbor polyhedron of 1.
Definition 8 Cluster: A cluster is defined to be the set of points belonging to the set of reachable tetrahedrons and polyhedrons. A cluster C is a non-empty subset satisfying the following conditions,
For all u, v: if u belongs to C and v is reachable from u then v belongs to C where u and v are polyhedrons and,
For each u, v belonging to C, for all p and q that belongs to u or v and p belongs to C and q is reachable from p w.r.t.βthen q also belongs to C, where p,q are tetrahedrons of an polyhedron . Tetrahedron reachable relation follows symmetric and transitive property within a polyhedron of ancluster C.
Definition 9 Noise: Noise is simply the set of points belonging to the polyhedrons (or
tetrahedrons) not belonging to any of its clusters. Let C1, C2, ....C3 be the clusters w.r.t.
β, then noise = {no_ p| p belongs to dataset, for all i no_ p does not belong to C where no_ p is the set of points in tetrahedron p or polyhedron u and Ci (i=1,..., k).
3.2. Density Confidence
The density confidence for a given set of triangles reflects the general trend and distribution of the data pointsof that set. If the density of one triangle varies greatly from the others it will not be included in the set. If the density confidence of a current triangle with one of its neighbor triangle does not satisfy the density confidence condition than that neighbor triangle is not included into the currently considered dense area. On the contrary, if it satisfies the condition than we treat the neighbor triangle as a part of the considered dense area and merge the triangle with the dense area. In comparison to other methods of setting a global threshold, this method has the ability to recognize the local dense areas in the data space where multi-density clusters exist.
With correspondence to the above definitions, three lemmas are stated:
Lemma 1: Let C be a cluster w.r.t. βand let u be any polyhedron in C and p be any tetrahedron in u. Then C can be defined as a set, S= {s and st|s is polyhedron-reachable
from u andstis tetrahedron-reachable from pw.r.t.β within every u of C}
Proof: Suppose Tis a tetrahedron, where T belongs to
standT is not tetrahedron-reachable from pw.r.t. βor G is
an polyhedron, where G belongs to s and G is not polyhedron-reachable from u. But, a cluster according to Def. 8 will be the set of points which are tetrahedron-reachable from p and polyhedron-reachable from u.
Therefore, we come to a contradiction and hence the proof.
Lemma2: A tetrahedron of a polyhedron or a polyhedron corresponding to noise points is not tetrahedron-reachable or polyhedron-reachable from any of the clusters respectively. For a tetrahedron pwe have,
all
p: p is not reachable from any tetrahedron in C i.e. pdoes not belong toC and for a polyhedronu we have, all u: u is not reachable from any polyhedron in C i.e. u does not belong to C.tetrahedron-reachable or polyhedron-reachable from any of the clusters respectively. Therefore, we come to the conclusion that p is not reachable from any tetrahedron in
C and u is not reachable from any polyhedron in C.
Lemma 3: A tetrahedronT or a polyhedron G can be tetrahedron-reachable and polyhedron-reachablefrom only a single unique cluster.
Proof: Let C1 and C2 are two clusters w.r.t. βand let p be
any tetrahedron and u be any polyhedron in C1 and q is
any tetrahedron and v is any polyhedron in C2. Suppose a
tetrahedronTis tetrahedron-reachable from both p and q or apolyhedron G is polyhedron-reachable from both u and v, then Tbelongs toC1 and Tbelongs toC2 or G belongs to C1and G belongs to C2. This will mean that the clusters C1
and C2 should be merged. This violates the basic notion
that clusters are unique sets. Thus, we can conclude that if
T is tetrahedron-reachable from p w.r.t. β, T is not tetrahedron-reachable from q w.r.t. β and if G is polyhedron-reachable from u, then G is not polyhedron-reachable from v,i.e. T belongs to C1 and T does not belong to C2 or G belongs to C1 and G does not belong
to C2. Therefore the lemma has been proved.
4. THE PROPOSED ALGORITHM
There are functional components like creating the polyhedron (combination of tetrahedrons), finding the number of points in each tetrahedron of a polyhedron (density), traversal of neighboring tetrahedrons from the center tetrahedron, merging two tetrahedrons and finding the farthest point of each merged tetrahedrons that are needed to be implemented to give out quality 3D clusters .
4.1. CREATING A POLYHEDRON
-
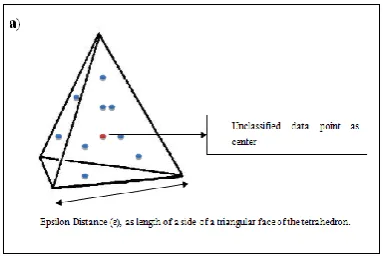
Since we are using the polyhedron approach, we need to consider a data point as a center of the polyhedron. Any arbitrary unclassified point can be used to start with. We are considering a polyhedron of five regular tetrahedrons, one at the center and four at each side of the center one. Thus we have five equal tetrahedrons after sub-division of the regular polyhedron. By increasing the number of tetrahedrons of the polyhedrons from five to higher we can have higher number of tetrahedral sub-divisions that can lead to more accurate clustering. The polyhedron is formed by creating five equal tetrahedrons. The center one is made from a point and an initial distance (considered as the side of one triangular face of our tetrahedron) using trigonometric and geometric formulae, explaining them is out of the scope of this paper. This initial distance is called the Epsilon Distance, ε given as an input parameter by the user. Fig. 5 shows the polyhedron formed with ε as distance.Figure 5(a) - Tetrahedron created from a center point (red) and side length as ε
Figure 5(b) - The four neighbor tetrahedrons of tetrahedron shown in 5(a) in red, green, blue and
yellow
[image:6.595.314.531.64.625.2] [image:6.595.333.525.70.201.2]Figure 6- Density of each tetrahedron of the polyhedron
4.3. TRAVERSAL OF NEIGHBOURING TETRAHEDRONS
-
From the center tetrahedron we traverse the neighboring tetrahedrons in all directions (shown by all three side arrows). First we can start with all the tetrahedrons in all the side faces of the central tetrahedron, when completed we may go to the tetrahedron above the central tetrahedron (one facing the reader and shown by the central arrow). The basic purpose of traversing is to find the ratio between two adjacent tetrahedrons (central tetrahedron and one of its neighbor tetrahedrons) which share the same side among them (neighbor tetrahedrons).Fig. 7 given below shows the possible ways of traversal.Figure 7- Traversal of neighbor tetrahedrons from central tetrahedron
4.4. MERGING TWO TETRAHEDRONS
-
A tetrahedron can be merged with its neighbor tetrahedron if the ratio of densities between them is greater than a threshold set by the user i.e. the tetrahedron satisfies the density confidence condition w.r.t its neighbor. Thus these reachable tetrahedrons can be considered as the same cluster. This process is performed iteratively till no more tetrahedrons of a polyhedron can be merged in [image:7.595.334.504.120.229.2]any direction. Fig. 8 shows a case in which two neighboring tetrahedrons are merged into one cluster satisfying the density confidence condition.
Figure 8- Merging of tetrahedrons (in light grey) if density confidence is fulfilled
However, two cases can be considered with regard to density confidence of a triangle
Case 1:If TP1& TP2 are two tetrahedrons of a polyhedron
such that dn (TP1)>dn (TP2), where dn represents the
density of a particular tetrahedron, then:β≥dn (TP1) / dn
(Tp2)and β is set any value in the interval [2.5,1.43]
which is found after rigorous experimentation.
Case 2: If TP1&TP2are two tetrahedrons of a polyhedron
such that dn (TP1)<dn (TP2), where dn represents the
density of a particular tetrahedron, then : β≤dn (TP1) / dn
(Tp2) and β is set any value in the interval
[0.4,0.7]which is found after rigorous experimentation.
[image:7.595.63.272.476.607.2]Figure 9- Formation of the next polyhedron from one of the farthest points (in green) of current
polyhedron (shaded)
4.6 Procedure of 3D-CATD:
The execution of the proposed algorithm includes the following steps:
1. Creating the polyhedron (by making five tetrahedrons) taking an arbitrary unclassified point as center and epsilon distance (ε) as side length of a tetrahedron.
2. Compute the number of points in each tetrahedron of a polyhedron (density).
3. Traverse the neighboring tetrahedrons starting from the central tetrahedron in all directions and finding the ratio between two tetrahedrons w.r.t. points in them.
4. Merging two tetrahedrons if ratio is greater than a certain threshold (β) and mark them as classified.
5. Find the farthest points of the merged tetrahedrons and creating the next polyhedron out of them.
6. Repeat step 2 through 6 till we can classify no more into a 3D cluster and assign cluster_id.
7. Repeat step 1 through 7 till whole dataset is classified and all 3D clusters are formed.
5. RESULTS AND PERFORMANCE
ANALYSIS
To evaluate the technique in terms of quality of clustering, the algorithm was also applied on some synthetic and readymade 3D data sets found from website of The Field Robotics Center [http://www.frc.ri.cmu.edu]. Fig.10 shows the results of clustering in the self- made 3D datasets which shows that our algorithm is successful enough to handle large and multi shaped clusters without single linkage
problem. Fig.11 shows the results of application of our clustering algorithm on existing datasets from web. From our experiments it has been found that the clustering result is dependent on the threshold βwhich varies in the interval [0.4, 0.7]. The epsilon distance εis set between 2 to 3.8 for optimized results.
[image:8.595.330.526.163.436.2]Figure 10- 3D clustering on self made 3D spatial data
[image:8.595.313.530.428.743.2]From the experimental results given above, we can conclude that 3D-CATD is highly capable of detecting intrinsic as well as multi-density clusters over three- dimensional data space qualitatively. However, using the idea of grid-based clustering along with 3D-CATD can result in more accurate results which is again a future scope of research.
5.1. Input Parameter Validation
The two input parameters of our algorithm i.e.
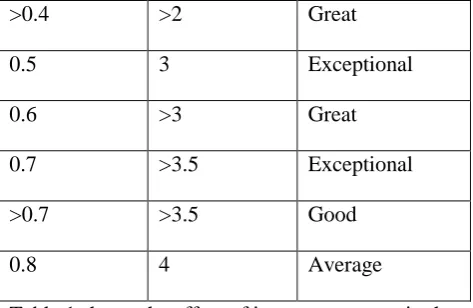
the threshold ‘β’and the epsilon distance ‘ε’ are validated after rigorous experimentation and analysis. Numerous numbers of values are being checked with the algorithm but the table below shows some of the values that display the important transitions in performance of the algorithm.Input Parameter : Threshold β
Input Parameter : Epsilon distanceε
Performance
0.1
1
Average
0.2
>1
Average
0.3
>1
Good
>0.3
2
Average
0.4
>2
Great
>0.4
>2
Great
0.5
3
Exceptional
0.6
>3
Great
0.7
>3.5
Exceptional
>0.7
>3.5
Good
[image:9.595.311.548.72.226.2]0.8
4
Average
Table 1 shows the affect of input parameters in the
varying nature of performance of the proposed
algorithm.
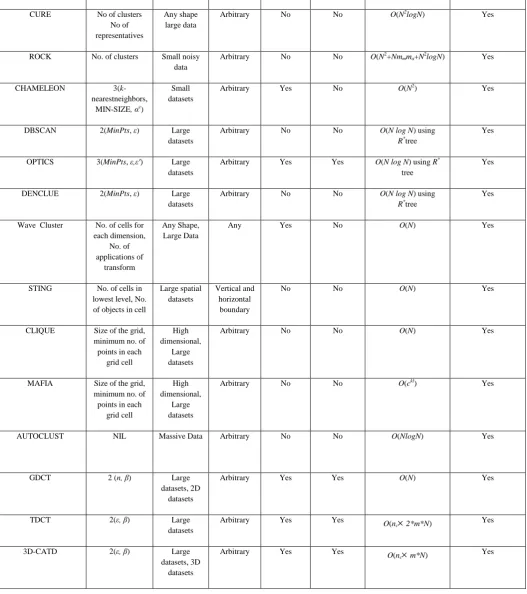
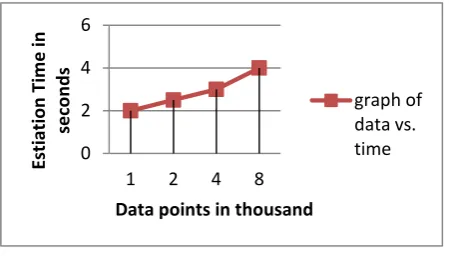
5.2. Complexity Analysis
The partitioning of the neighborhood of an arbitrary data point into a polyhedron containing m non-overlapping tetrahedron result in a complexity of O(m). The expansion of the cluster results in O(N*m) time complexity, where Nis the number of data points in the cluster formed and m <<Nin the average case. If the number of clusters obtained is ncthen, the overall time
complexity for the clustering will be O(nc
m*N).Algorithms No. of Parameters
Optimized for
Structure Multi-Density Cluster
Embedded Clusters
Complexity Noise Handling
K-means No. ofclusters Separated Clusters
Spherical No No O(ltkN) No
K-modes No. ofclusters Separated Clusters,
Large Datasets
Spherical No No O(ltkN) No
FCM No of clusters Separated
Clusters
Non-convex shapes
No No O(N) No
PAM No. of clusters Separated
Clusters, Large Datasets
Spherical No No O(ltk(N-k)2) No
CLARA No. of clusters Relatively Large Datasets
Spherical No No O(ksz2+k( N-k)) No
CLARANS No. of clusters, Max no. of
neighbors
Better than PAM, CLARA
Spherical No No O(kN2) No
BIRCH Branching
Factor, Diameter,
Threshold
CURE No of clusters
No of representatives
Any shape large data
Arbitrary No No O(N2logN) Yes
ROCK No. of clusters Small noisy data
Arbitrary No No O(N2+Nmmma+N2logN) Yes
CHAMELEON 3(k
-nearestneighbors, MIN-SIZE, αc)
Small datasets
Arbitrary Yes No O(N2) Yes
DBSCAN 2(MinPts, ε) Large
datasets
Arbitrary No No O(N log N) using
R*tree
Yes
OPTICS 3(MinPts, ε,ε') Large datasets
Arbitrary Yes Yes O(N log N) using R*
tree
Yes
DENCLUE 2(MinPts, ε) Large
datasets
Arbitrary No No O(N log N) using
R*tree
Yes
Wave Cluster No. of cells for each dimension,
No. of applications of
transform
Any Shape, Large Data
Any Yes No O(N) Yes
STING No. of cells in lowest level, No. of objects in cell
Large spatial datasets
Vertical and horizontal
boundary
No No O(N) Yes
CLIQUE Size of the grid, minimum no. of points in each
grid cell
High dimensional,
Large datasets
Arbitrary No No O(N) Yes
MAFIA Size of the grid, minimum no. of points in each
grid cell
High dimensional,
Large datasets
Arbitrary No No O(ckl) Yes
AUTOCLUST NIL Massive Data Arbitrary No No O(NlogN) Yes
GDCT 2 (n, β) Large
datasets, 2D datasets
Arbitrary Yes Yes O(N) Yes
TDCT 2(ε, β) Large
datasets
Arbitrary Yes Yes O(n
c
2*m*N) Yes3D-CATD 2(ε, β) Large
datasets, 3D datasets
Arbitrary Yes Yes O(n
[image:10.595.28.556.84.679.2]c
m*N) YesTable 2: Comparison of the Proposed Algorithm (3D-CATD) with its counterparts
DBSCAN requires two input parameters MinPtsandβ. Moreover, it cannot detect embedded clusters and 3D
clusters but no 3D clusters. However, its performance degrades while detecting multiple nested clusters over massive datasets. Again, GDLC and Density-isoline algorithms can detect multi-density clusters but fail to detect intrinsic cluster structures. GDCT [14] requires the number of grid cells, i.e.nand threshold βas input parameters. TDCT needs epsilon distance, ε and threshold β as input parameter and can work on large 2D datasets [23] .3D-CATD needs epsilon distance, ε
[image:11.595.187.412.215.343.2]and threshold β as input parameter Moreover, from our experiments we conclude that the threshold βdoes not vary significantly with different datasets so it can be set beforehand and need not be entered by the user. The algorithm can effectively detect embedded clusters over variable density space as well as multiple nested clusters in a 3D data set. A detailed comparison is given in Table 1.
Figure 12- Running time vs. data points
5.2. Advantages of proposed algorithm (3D-CATD):
The advantages of the proposed algorithm are:
1) Embedded cluster Detection over 3D data space
2)O(nc m*N) complexity
3) Handling of huge datasets
4) Handling of single linkage problem
5) Lesser number of parameters than its counterparts
6. CONCLUSION
This paper presents a clustering technique for massive numeric three- dimensional (3D) datasets. The clustering algorithm is based on density approach and can detect global as well as embedded clusters. Experimental results are reported to establish the superiority of the algorithm in light of several synthetic data sets. In this paper we have only considered three-dimensional objects. But, some or more of the real life problems deals with higher dimensionalities rather than 2D /3D datasets. Therefore, there is scope for scaling the proposed algorithm to detect clusters in such datasets with minor modifications, research of which is in progress. From a proper analysis of the designed technique, it can be safely concluded that the algorithm developed is working properly to a great extent.
7. REFERENCES
[1] J. Han and M. Kamber, Data Mining: Concepts and Techniques. India: Morgan Kaufmann Publishers, 2004.
[2] M. Ester, H. P. Kriegel, J. Sander and X. Xu, “A Density-Based Algorithm for Discovering Clusters in Large Spatial Databases with Noise”, in
International Conference on Knowledge Discovery inDatabases and Data Mining (KDD-96), Portland, Oregon, 1996, pp. 226-231.
[3] C. Hsu and M. Chen, “Subspace Clustering of High Dimensional Spatial Data with Noises”, PAKDD, 2004, pp. 31-40.
[4] W. Wang, J. Yang, and R. R. Muntz, “STING: A Statistical Information Grid Approach to Spatial data Mining”, in Proc. 23rd
InternationalConference on Very Large Databases, (VLDB), Athens, Greece, Morgan Kaufmann Publishers, 1997, pp. 186 - 195.
[5] G. Sheikholeslami, S. Chatterjee and A. Zhang, “Wavecluster: A Multiresolution Clustering approach for very large spatial database”, in
SIGMOD'98, Seattle, 1998.
[6] R. Agrawal, J. Gehrke, D. Gunopulos and P. Raghavan, “Automatic subspace clustering of high dimensional data for data mining applications”, in
SIGMOD Record ACM Special Interest Group onManagement of Data, 1998, pp. 94–105.
[7] H. S. Nagesh, S. Goil and A. N. Choudhary, “A scalable parallel subspace clustering algorithm for 0
2 4 6
1 2 4 8
Esti
ation
Ti
m
e
in
sec
o
n
d
s
Data points in thousand
massive data sets”, in Proc.International Conference on Parallel Processing, 2000, pp. 477.
[8] L. Ertoz, M. Steinbach and V. Kumar, “Finding Clusters of Different Sizes, Shapes, and Densities in Noisy, High Dimensional Data”, in
SIAMInternational Conference on Data Mining
(SDM '03), 2003.
[9] G. Karypis, Han and V. Kumar, “CHAMELEON: A hierarchical clustering algorithm using dynamic modeling”, IEEE Computer, 32(8), pp 68-75, 1999.
[10] Y. Zhao, S. Mei, X. Fan, S. Jun-de. 2003. Clustering Datasets Containing Clusters of Various Densities. Journal of Beijing Universityof Posts and Telecommunications, 26(2):42-47.
[11] H. S. Kim, S. Gao, Y. Xia, G. B. Kim and H. Y. Bae, “DGCL: An Efficient Density and Grid Based Clustering Algorithm for Large Spatial Database”,
Advances in Web-Age Information Management
(WAIM'06), pp. 362-371, 2006.
[12] M. Ankerst, M. M. Breuing, H. P. Kriegel and J. Sander, “OPTICS: Ordering Points To Identify the Clustering Structure”, in ACMSIGMOD, pp. 49-60, 1999.
[13] S. Roy and D. K. Bhattacharyya, “An Approach to Find Embedded Clusters Using Density Based Techniques”, in Proc. ICDCIT, LNCS 3816, pp. 523-535, 2005.
[14] S. Sarmah, R. Das and D. K. Bhattacharyya, “Intrinsic Cluster Detection Using Adaptive Grids”, in Proc. ADCOM'07, Guwahati, 2007.
[15] S. Sarmah, R. Das and D.K. Bhattacharyya, “A Distributed Algorithm for Intrinsic Cluster Detection over Large Spatial Data” A grid-density based clustering Technique (GDCT), World Academy of Science, Engineering and Technology 45, pp. 856-866, 2008.
[16] RajibMall ,”Software Engineering”.
[17] Available: http//steve.hollasch.net /cgindex/math /barycentric.html
[18]Available:http://en.wikipedia.org/wiki/Barycentric_ coordinate_system_(mathematics)
[19] J. Pocol, R. Etemadpour, F.V. Paulovich1, T.V. Long, P. Rosenthal, M.C.F. Oliveira1, L. Linsen and R. Minghim, “A Framework for Exploring Multidimensional Data with 3D Projections”, Eurographics / IEEE Symposium on Visualization 2011 (EuroVis 2011), Volume 30 (2011), Number 3.
[20] Rakesh Agrawal, Johannes Gehrke, Dimitrios Gunop-ulos, and Prabhakar Raghavan.Automatic subspace clustering of high dimensional data for data mining applications. In Proceedings of the 1998 ACM SIGMOD international conference on Management of data, pages 94{105. ACM Press, 1998.
[21] Raghunath Kar&Susant Kumar Dash “A Study On High Dimensional Clustering By Using Clique”, International Journal of Computer Science and Informatics, pp. 22-25, Volume-I, Issue-II, 2011.
[22] Lance Parsons, Ehtesham Haque, Huan Liu, “Evaluating Subspace Clustering Algorithms” Supported in part by grants from Prop 301 (No. ECR A601) and CEINT 2004.