Munich Personal RePEc Archive
Creativity: London’s Core Business
Freeman, Alan
London Metropolitan University, Greater London Authority
November 2002
Online at
https://mpra.ub.uni-muenchen.de/52548/
Creativity: London’s Core Business
Alan Freeman
London Metropolitan University (Produced while working at the Greater London Authority November 2002)
This version with minor amendments for ease of access prepared for the Repec open-access site on 30 December 2013
Abstract
This is a pre-publication version of Creativity: London’s Core Business which was published by the Greater London Authority (GLA) in 2002 and can be found at
http://www.london.gov.uk/mayor/economic_unit/docs/create_inds_rep02.pdf.
This version omits the technical appendix and foreword in the original and is provided to ensure there is a single location with a historical record of the evolution of the subject. Nothing else has been changed.
The report should be cited as Freeman, A. (2002). London’s Core Business. London: Greater London Authority. This version is made available for convenience in searching and the use of graphics. A powerpoint version of the slides, containing most of the graphics, is available at http://www.slideshare.net/alanfreeman777/2002i-core-business-creativity-colour-slides; a second, given at the LSE, explains some of the background and method. This is at http://www.slideshare.net/alanfreeman777/2002i-core-business-supplementary-slides-for-lse-15-122003
The report produced the first measurements, and a time-series, for employment and GVA in London’s Creative Industries. It was subsequently updated four times, the last full update being published in 2010, and available on Repec.at http://mpra.ub.uni-muenchen.de/id/eprint/52548
It applied the methodology of the Department of Culture, Media and Sport (DCMS) who, in their 1999 and 2000 Mapping documents, established one of the earliest systematic methodologies for defining and measuring the creative industries.
The author’s contribution to this report, for which he was the lead author, led to many subsequent developments in theorising and measuring the creative industries, such as Creativity in the Age of the Internet, A Dynamic Mapping of the UK’s Creative Industries, and the collaborations which led to Measuring Intrinsic Value, Not Rocket Science, and State of Uncertainty, date from the production of this report.
I would like to acknowledge the contribution of John Ross, the mayor’s economic advisor, Bridget Rosewell, the consultant chief economist for GLA Economics, and the production team Production team: David Cannington, and Ian Harris for their invaluable input into this report. Its errors, which are many, are of course mine.
JEL codes: Z1, Z11
Creativity: London’s Core Business
Contents
Creativity: London’s Core Business Alan Freeman ... 0
Contents ... 1
Introduction ... 2
Section 1: Creative Industries: an expansion-driven productivity revolution ... 4
Section 2: London and the South East: motors of UK Creative Industries growth ... 12
Section 3: The demand for creativity: growing the market for diversity ... 16
Section 4: Harnessing London’s capital: the new productive structure and the resources it needs ... 22
Section 5: Clustering and diversity: the spatial distribution of London’s Creative Industries ... 29
Introduction
London has always been a creative city, based on innovation and ideas. It has been in the forefront of new technologies and new markets. Over the past few decades, it has been the turn of business service industries – accountants, lawyers and consultants – to drive forward the economy. But alongside this a more subtle process has been underway which is now beginning to take centre stage.
Since the Second World War a mass consumer market has developed for a wide range of diverse and highly differentiated products. At the same time the creative input required has expanded and diversified in its turn. As a result we have seen the dramatic growth of those industries directly associated with the creative process – from architecture and advertising to the performing arts and publishing. As we have become richer and more selective – and gained more leisure time – so has our demand for the products of these industries increased.
London is playing a vital role in the success of this diversification. Creative Industries require interaction, inspiration and face-to-face stimulation. London provides all these and as a result, the Creative Industries now represent one of the biggest sectors in the capital, with more output and employment than any sector except business services. Moreover, over the five years from 1995 to 2000 it grew faster in terms of output than any other sector in the London economy. In this report Section 1 gives more detail of what has happened, while Section 2 looks at how London interacts with the rest of the UK. Section 3 explores the way in which this market has grown and how a global market for creativity has developed in which London is a key player.
By raising productivity, the Creative Industries sector has remained successful, growing output even faster than it has increased employment. Its component
industries have made a virtue of their high cost location, which gives them inspiration by raising their game.
Of course, the Creative Industries are highly diverse. The needs of the software industry are unlike those of the fashion industry and their supply chains naturally differ. Section 4 examines the different supply side structures and uses some case studies to look at how individual industries have responded – with varying degrees of success – to the demand and supply conditions they face.
So far, the Creative Industries have been fairly heavily clustered in Central London and along a Western Corridor out towards Heathrow. However, recent years have seen various individual industries spreading out, with Hoxton becoming a centre for artists, and publishing expanding in Islington and Tower Hamlets. Section 5 looks at the spatial distribution of these industries within London.
Creativity exists in many places and is expressed in many ways. This report
As a final point, it is important to note that the data used in this report largely covers the period from 1995 to 2000. The current economic downturn has affected the Creative Industries in the same way as it has had an impact on the full range of industrial sectors. Some industries have been more affected than others – the advertising industry for example will always take a hard knock during a time of economic downturn, as advertising budgets are often the first to be trimmed. We believe however, that the underlying drivers of change outlined in this report remain unchanged. Whilst some companies within the Creative Industries will see reductions in profits, show losses and in the worst cases suffer closures, the potential for
sustained employment and output growth remains, particularly once growth in the economy picks up again, as inevitably it will do.
London is a vital centre for a broad range of creative activities, not just in the UK, but also in the world. The real challenge for the future is to ensure that it keeps this lead.
Defining the Creative Industries
The first attempt to measure the economic contribution of the Creative Industries in the UK was made by the Department of Culture, Media and Sport (DCMS) in their first ‘Creative Industries Mapping Document’ in 1998. This exercise was repeated and a second mapping document produced in 2001.
The DCMS defines Creative Industries as ‘those industries which have their origin in individual creativity, skill and talent and which have a potential for wealth and job creation through the generation and exploitation of intellectual property’. This report expands on this definition by taking the decisive linking factor in Creative Industries to be intellectual and creative input, producing goods and services that are distinguished by brand, identity and difference.
Thirteen individual industries have been defined by the DCMS as covering the Creative Industries: advertising; architecture; the art & antiques market; crafts; design; designer fashion; film & video; interactive leisure software; music; the performing arts; publishing; software & computer services; and television & radio.
Detailed study of the Creative Industries is still in its infancy and measuring the size and growth of the Creative Industries using official statistical sources is problematic. On the whole, these industries do not correspond neatly to the employment categories provided by the Office of National Statistics (ONS) in the Standard Industrial Classification (SIC). The DCMS has therefore had to be pragmatic in mapping a set of best-fitting SIC codes to a refined list of Creative Industries. There are eleven of these: advertising; architecture; the art & antiques market; computer games, software & electronic publishing; crafts; design; designer fashion; music and the visual & performing arts; publishing; radio & TV; and video, film & photography. In addition they have mapped a set of best-fitting Standard Occupational Classification (SOC) codes to the same list of eleven industries.
categories, whilst no suitable matches amongst the SOC codes are found with the advertising and art/antiques trade categories.
Implicit in DCMS estimates of employment in the Creative Industries in the UK are some assumptions based on an understanding of the industries at a UK level. Analysing UK estimates, GLA Economics felt that London required a slightly different set of assumptions to avoid underestimating the extent of creative employment in London. As a consequence the GLA Economics estimates show significantly larger numbers than DCMS for employment in the fashion industry (Box 2.1), architecture, and the computer games, software & electronic publishing industry. The radio & TV, advertising, and art & antiques industries remain entirely unchanged.
For reference, the data used in this report are contained in a Technical Appendix at the back.
Section 1: Creative Industries: an expansion-driven
productivity revolution
The Creative Industries add £21 billion annually to London’s output, more than all the production industries combined and second only to Business Services at £32 billion.
The Creative Industries as a whole represent London’s third largest sector of employment, with 525,000 people working either directly in the Creative Industries or in creative occupations in other industries.
The Creative Industries are London’s second biggest source of job growth, contributing roughly one in every five new jobs.
London’s Creative Industries are at the centre of a productivity revolution, expanding both jobs and wealth, with employment up by 5 per cent per year, output by 8.5 per cent and productivity by 4 per cent between 1995 and 2000.
London’s Creative Industries have seen a powerful surge of output growth…
In the second half of the last decade London’s Creative Industries were the focus of a powerful surge of growth in output, as a result of which they are now London’s second largest source of wealth after Business Services.
The scale of this expansion is exemplified by the absolute growth in output to which it has given rise. In 1995, London’s Creative Industries added £12 billion to London’s GDP. By 2000, at the peak of the last decade’s expansion, this had nearly doubled to £21 billion. The rate of growth in output of the Creative Industries as a whole in real terms outperformed all other sectors, achieving an annual rate of 8.5 per cent.
…with some of the fastest growth rates around.
Although the sector as a whole has grown rapidly, there are some significant
variations in growth rates between individual Creative Industries. Publishing, fashion, music & the visual & performing arts, and radio & TV experienced lower growth rates in output than London’s Creative Industries average, yet all of them exceeded the UK all-industry average. For the remainder of the Creative Industries,
Services as a whole, recording average annual growth rates ranging from 11 to 18 per cent (Chart 1.1).
Chart 1.1: London’s annual output growth 1995-2000
-5% 0% 5% 10% 15% 20%
Video, film & photography Computer games, software, electronic publishing Art/ antiques trade Architecture Advertising London Creative Industries total Business services Transport & comms Radio & TV Retail Fashion Construction Other services Financial services Wholesale Music and the visual & performing arts Publishing UK total Health & education Hotels & restaurants Manufacturing
Percentage annualised real output growth (constant 1995 prices)
Source: Cambridge Econometrics and GLA estimates based on ONS input-output and ABI data
This is part of a fundamental transformation of London’s economy… The growth of the Creative Industries is at the cutting edge of a fundamental transformation in London’s economy that has been happening for the last three decades. Planning for London’s Growth showed how Business Services have become the dominant sector within the city over this period, but alongside this a second process has been going on, which is now poised to take centre stage. The growth of the Creative Industries is the outcome of this second process, creating a major new source of economic expansion for the capital.
…with rapid growth in consumer demand for a diverse range of products…
As incomes rise we demand more goods and services. As we become richer still we want the goods and services we buy to be individual, different from other people’s. This qualitatively new and rapidly growing world and domestic market for consumer services and goods has created the demand conditions for the explosive growth of a new sector geared to catering for diversity.
…characterised by their intellectual and creative input.
Making and selling these products efficiently calls above all for intellectual and creative input, organised to translate highly specific, very varied, and
time-constrained consumer demand into products that meet this demand precisely and that are delivered on time. London’s diverse and highly educated population, located around the heart of a great global business and service centre, has made it the UK’s premier provider of this essential requirement.
Chart 1.2: London’s output 2000
0 5,000 10,000 15,000 20,000 25,000 30,000 35,000 Business services
London Creative Industries total Financial services Transport & comms Manufacturing Health & education Wholesale Other services Retail Public administration Construction Hotels & restaurants
Output in current £million
Source: Cambridge Econometrics and GLA estimates based on ONS input-output and ABI data
The Creative Industries are now key to London’s wealth production… The Creative Industries are now an essential component of London’s
wealth-producing capacity. This can be seen most clearly by comparing them as a group with other broad sectors defined by the Standard Industrial Classification (SIC) – the normal way industries are grouped into broadly related activities (Chart 1.2).
Box 1.1: Creative Industries and standard sectors – the overlap
The boxes in this section explain how GLA Economics arrived at its estimates of creative employment.
By 2000, the last year for which data on output are available, the Creative Industries were creating more wealth for London, and hence for the UK, than any other major industrial sector except Business Services. Their importance for London is based, therefore, not just on their high growth rates, but also on the absolute size of their contribution to London’s output.
…and together have some coherence as a sector.
There is very strong evidence that the Creative Industries, despite their diversity, function in very similar ways: they are clearly demarcated by their high growth rates of both output and employment; they have a strong tendency to cluster in London and the South East; and, as this report establishes, the market into which they sell has defining characteristics that call for specific types of human input – creative and intellectual. Together they form a coherent sector.
They are also generating significant growth in jobs…
The number of jobs in London’s Creative Industries, which includes employment in creative-related industries, such as clothing manufacture, and people working in creative occupations outside the Creative Industries, rose from 414,000 to 525,000 between 1995 and 2000. This increase of 111,000 makes the Creative Industries the second biggest source of job growth over the 1995-2000 period, contributing roughly one in every five new jobs (Chart 1.3).
Chart 1.3: London’s employment growth 1995-2000
-50,000 0 50,000 100,000 150,000 200,000 250,000 300,000 Business services
London Creative Industries total Health & education Hotels & restaurants Transport & comms Wholesale Retail Manufacturing Construction Financial services Public administration Primary and utilities
Absolute job growth
Source: Cambridge Econometrics and GLA estimates based on ONS ABI and LFS data
Chart 1.4: London’s annual employment growth rates 1995-2000
-2% 0% 2% 4% 6% 8% 10% 12% 14%
Computer games, software, electronic publishing Design Business services Advertising London Creative Industries total Video, film & photography Fashion Hotels & restaurants Publishing Art/ antiques trade Music and the visual & performing arts Wholesale London total Radio & TV Transport & comms Health & education Retail Manufacturing Construction Architecture Financial services Public administration Crafts
Percentage annualised growth in employment
Source: Cambridge Econometrics and GLA estimates based on ONS ABI and LFS data
Chart 1.5: London’s employment in 2000
0 200,000 400,000 600,000 800,000 1,000,000 1,200,000 Business services
Health & education London Creative Industries total Retail Transport & comms Manufacturing Hotels & restaurants Wholesale Financial services Public administration Construction
Workforce jobs
Source: Cambridge Econometrics and GLA estimates based on ONS ABI and LFS data
… ...with London's Creative Industries now the third most important sector of employment.
Box 1.2: Who works creatively?
The Creative Industries sector (see ‘Defining Creative Industries’ following the Introduction) includes two types of people: those who work in a creative industry, for example a music company, and those who work in a creative occupation, for example a musician. Many are creatively occupied outside a creative industry – a piano teacher works in a school, as a musician. And many performers hold two jobs, working creatively as a second occupation – like a musician with a day job who does gigs at nights or weekends.
One of the processes at work in this sector, which shows it is an industry in formation, is that new enterprises are bringing together individuals who used to work separately or in another industry – for example design companies, or software companies, which hardly existed twenty years ago. The sector depends on the whole range of these individuals and is increasingly the reason their jobs exist. Following the DCMS, this report therefore calculates employment in each industry by adding up all these sources of employment.
So for the sector called ‘music and the visual & performing arts’, GLA Economics first added up all the workplace jobs in the industry concerned – all who work in music companies, theatres, and so on – a figure of 44,500. Second, it found everyone else occupied in the sector concerned, either as a main or second job, but not in any Creative Industries (11,100). These numbers were then added together to show that 55,500people hold jobs in the music and the visual & performing arts sector.
Over the whole of the Creative Industries this approach arrives at an employment figure some 33 per cent larger than the number working strictly for the Creative Industries.
All employment figures including the occupational figures are workplace-based – they report how many people work in jobs based in London.
London is witnessing a benign productivity revolution in the Creative Industries…
The relative growth of employment and output show that London has become the scene of a productivity revolution centred on the Creative Industries.
At the beginning of this phase of expansion, in 1995, workers in the Creative
Industries were adding £31,000 each on average to output. Five years later they were adding £38,000 each, an average annual increase of 4 per cent per year in productivity (Chart 1.6).
By comparison, in real terms the average output per UK employee job at 1995 prices was £24,000 in 1995 and £26,000 in 2000, an annual growth rate in productivity of 1.4 per cent.
However, productivity growth has varied substantially between individual Creative Industries (Chart 1.7). The fashion industry even recorded declining productivity, reflecting relatively high employment growth compared to output growth. In other cases, performance was outstanding. Four sectors amongst the Creative Industries recorded higher annual growth rates than any of the broad industrial sectors, with rates ranging from 6 to 14 per cent. Of the remainder only fashion, publishing, and music and the visual & performing arts, experienced lower growth rates in
Chart 1.6: London’s productivity, 2000
0 10,000 20,000 30,000 40,000 50,000 60,000 Financial services
Radio & TV Advertising Computer games, software, electronic publishing Publishing Architecture Transport & comms London Creative Industries average Manufacturing Fashion Music and the visual & performing arts Video, film & photography Wholesale Average UK all Business services Other services Public administration Construction Health & education
Real output per employee (thousands of pounds, constant 1995)
Source: Cambridge Econometrics and GLA estimates based on ONS input-output and ABI data
Box 1.3: How much do workers in the Creative Industries produce?
Measuring the contribution that an individual makes to an enterprise’s output is not a straightforward matter. We do not know, for example, how much money a
programmer makes for, say, a firm of accountants. It is important, however, that as well as having some knowledge of the number of Creative Industries employee jobs, we also have some understanding of the size of the contribution to London’s output made by individual Creative Industries, as well as some rough estimates of
productivity per worker.
The productivity and output figures in this report are based on a slightly broader definition of the Creative Industries than the standard employment definition used. The ONS does publish estimates of output for the Creative Industries at the UK level, but does not use precisely the same definition as the DCMS. As a consequence, London Creative Industries output and productivity figures have been estimated using comparable London employment and UK output data. At a London level it is
therefore the employment data that must be considered as being most reliable.
…with output and jobs rising…
In the Creative Industries both output and jobs have been rising. The productivity gains that have been realised are therefore very different from those that arise in a declining market dominated by falling prices, in which the principal way that companies raise output per worker and preserve margins is by cutting costs, eliminating unprofitable activities and slimming down employment.
…the result of expansion into a growing new market.
Chart 1.7: London’s productivity growth rates, 1995-2000
-4% -2% 0% 2% 4% 6% 8% 10% 12% 14% 16%
Architecture Art/ antiques trade Video, film & photography Computer games, software, electronic publishing Transport & comms Retail London Creative Industries average Construction Advertising Radio & TV Financial services Business services Average UK all Music and the visual & performing arts Wholesale Health & education Publishing Other services Fashion Manufacturing
Percentage annualised real output per employee growth (constant 1995 prices)
Source: Cambridge Econometrics and GLA estimates based on ONS input-output and ABI data
Box 1.4: Fashion, or designer fashion?
The DCMS includes ‘designer fashion’ within its definition of the Creative Industries. The 2001 Creative Industries Mapping Document cites the British Fashion Designer Report produced for the DTI by Susie Cheshire, which suggests that 1,000-1,500 people were employed directly in the UK designer fashion industry in 1998. The definition used however, was a very narrow one: just those designers who individually or as a company show regularly at the four major international fashion weeks
(London, Paris, Milan & New York) and sell at the upper end of the market.
Using official data sources it is currently not possible to produce estimates of employment in the ‘designer fashion’ industry. In any event, in our view designer fashion represents a very narrow definition of an important creative industry – the fashion industry.
The DCMS best-fitting definition of the ‘designer fashion’ sector using SIC and SOC coding is much wider, although it still includes an assumption that 0.5 per cent of clothing manufacturing feeds into the designer fashion industry.
The resulting estimate of 60,000 fashion jobs in London, therefore will include a proportion of jobs that are within Creative Industries, but not necessarily the fashion industry. This is necessary to ensure that we do not underestimate the total number of Creative Industry jobs in London.
In order to gain a more precise understanding of the size and current state of the designer fashion industry a study has been commissioned by the DTI and the British Fashion Council. This report by Malcolm Newbury Consulting will be published in December 2002.
Section 2: London and the South East: motors of UK
Creative Industries growth
London and the South East are leading Creative Industries growth in the UK.
Creative Industries growth is strong in London because of the capital’s unique combination of skilled and talented workers, cultural diversity and direct access to wealthy consumer markets.
The strong growth of London and the South East’s Creative Industries has the potential to stimulate growth in other areas of the UK.
London and the South East lead UK Creative Industries growth… Regionally, London and the South East have dominated the growth of the Creative Industries (Chart 2.1). According to our estimates Creative Industries growth in London has accounted for 111,200 extra employee jobs and in the South East an extra 86,000. The fastest growing region outside the South East, the Eastern region, has seen an increase of only 23,000 employee jobs.
Chart 2.1: Change in Creative Industries employment by UK region, 1995-2000
London South East
Eastern North West West Midlands Yorkshire and The
Humber South West Wales Scotland North East
East Midlands
-30,000 -20,000 -10,000 0 10,000 20,000 30,000 40,000 50,000 60,000 70,000 80,000 90,000 100,000 110,000 120,000
…potentially to the benefit of other UK regions.
This is not to say that London and the other regions of the UK are in competition. When a market is expanding, individual regions can benefit from the success of others. This is in contrast to a situation when there is a struggle for shares of a limited or declining market. As a result, the rapid growth in the Creative Industries in London and the South-East regions can benefit the whole of the UK.
The Creative Industries outside London and the South East are not yet as well developed…
The position becomes clearer when we look at the rate of employment growth in the Creative Industries in each region (Chart 2.2). Whilst growth rates in London and in particular the South East are certainly higher than in other UK regions, the Eastern region is not quite as far behind as the gap in the number of jobs created might
suggest. The Creative Industries outside London and the South-East are simply not yet as well developed. However, they do have the potential to expand further by tapping into the advantages that proximity to London’s Creative Industries offers.
Chart 2.2: Creative Industries employment growth rates by UK region, 1995-2000
South East
London
Eastern
Wales West Midlands North West
Yorkshire and The Humber
South West
Scotland
North East
East Midlands
-15% -10% -5% 0% 5% 10% 15% 20% 25% 30% 35%
Source: ONS Annual Business Inquiry
London accounts for a quarter of UK Creative Industries output…
Output of London’s Creative Industries in 2000 totalled £21 billion, about a quarter of the total Creative Industries output in the UK. This was equivalent to some £2,500 per member of London’s population in real terms, compared to £1,280 per person for the whole UK (Chart 2.3).
Chart 2.3: Creative Industries average annual output per head of population: London and UK, 1995-2000
0 500 1,000 1,500 2,000 2,500 3,000
1995 1996 1997 1998 1999 2000
Source: ONS and GLA estimates
Real
£ per pers
o
London Creative Industries UK Creative Industries
…its advantages include its skill base, its diversity and its access to consumer markets
London’s comparative advantage in providing the necessary inputs for successful Creative Industries is derived from a combination of factors. For example, the wealth of talented and skilled workers, as well as the cultural diversity of London, provide the necessary creative input to produce different and identifiable goods and services in industries such as advertising, architecture, fashion and computer games, software and electronic publishing.
Box 2.1: Fashion and the relocation of the clothing industry
The fashion industry provides an interesting story of an increasing creative input rescuing the clothing industry from decline in London and the South East.
Employment in fashion in London increased by approximately 10,300 between 1995 and 2000, whilst employment in all other areas of the UK (with the exception of the South East) declined. The level of decline ranged from 1,800 jobs in the Eastern region to 21,100 in the East Midlands. The data leave no doubt that a fundamental relocation of the clothing industry is taking place (a key component of our definition of the fashion industry – see Box 1.4.)
Regional contributions to change in fashion jobs, 1995-2000
London South East Eastern
Wales West Midlands Yorkshire and The
Humber South West North East North West Scotland East Midlands
-25,000 -20,000 -15,000 -10,000 -5,000 0 5,000 10,000 15,000
Source: Labour Force Survey
Without more detailed research we cannot be wholly sure of the causes of this relocation. Globally the clothing industry has been undergoing considerable
Section 3: The demand for creativity: growing the
market for diversity
Consumer demand for leisure goods and services has grown substantially over recent decades, the result of increased leisure time and rising disposable incomes.
This has been the key driver of the recent dramatic growth in London’s Creative Industries, increasing access to cultural outputs and boosting sales of creative products and services.
London has developed further as a worldwide market for creative products and services in recent years.
With increased prosperity and leisure time…
The past 25 years have seen a radical change in the spending patterns of UK consumers. With increased prosperity and leisure time, consumers are spending an ever-increasing proportion of their income on leisure goods and services, driving significant increases in the size of this market.
Chart 3.1: Proportion of average weekly household expenditure on selected spending categories, 1974 and 2000-01 (%)
Housing 19%
Fuel and power 7%
Food 33% Clothing and footwear
12% Motoring
15%
Leisure goods and services
14%
Housing 22%
Fuel and power 4%
Food 22%
Clothing and footwear 8% Motoring
19% Leisure goods and
services 25%
2000-01
…consumer spending on leisure goods and services has grown… Leisure goods and services have not only grown faster than any other component of household expenditure over the past 25 years, but are also now the largest single component (Chart 3.1). In 1974, leisure goods and services accounted for only 14 per cent of the main household spending categories. By 2000/01 this proportion had risen to 25 per cent.
In terms of total household expenditure, the proportion accounted for by leisure goods and services increased from 11 per cent to 18 per cent over the same period.
Box 3.1 Definition of leisure goods & services
Leisure goods and leisure services are two categories used in the Family Expenditure Survey, the primary source of data on spending by consumers in the UK. The table below provides a list of the types of goods and services included within these categories.
Leisure goods Books, newspapers, magazines TV, video, computer & audio equipment
Sports and camping equipment Toys and hobbies
Photography and camcorders Horticultural goods, plants and flowers
Leisure services Cinema & theatre Sports admissions and subscriptions
TV, video, satellite rental, TV licences and Internet
Other entertainment (including dance, nightclubs, galleries & museums)
…stimulating growth in the Creative Industries.
The Creative Industries represent one of the key groups of suppliers of leisure goods and services as defined in the family expenditure survey. As a result, of all the industry groups, they have benefited most from the increases in disposable income that have widened the domestic market for leisure.
Access to cultural outputs has been growing…
One effect on the Creative Industries of this rise in disposable income and leisure time is increased access to certain cultural outputs. Examples include:
Cinema: Recent years have seen a revival in cinema attendance, with admissions up from 54 million in 1984 to over 143 million in 2000 (Chart 3.2). At the same time, the numbers of films produced in the UK has increased from a low of 24 in 1981 to 98 in 20001.
Chart 3.2: UK cinema admissions, 1980-2000 (million)
Publishing: The number of new and revised book titles published in the UK rose by 17 per cent in the five years from 1996 to 20012. The number of new fiction titles rose by 42 per cent over the same period, though the fastest rate of growth was amongst travel books, which saw growth of 64 per cent.
Museums and Galleries: Museum attendance in London did increase overall between 1994 and 19993, but it was the reintroduction of free admission to some of London’s key museums at the end of 2000 and the opening of Tate Modern in May 2000 that sparked very substantial increases in visitors to London’s museums and galleries.
1 Screen Digest/Screen Finance/bfi, 2002 2 Whitaker Bibliographic Information, 2002
3 re:source, the Council for Museums, Archives and Libraries, 2002
0 20 40 60 80 100 120 140 160
1980 1982 1984 1986 1988 1990 1992 1994 1996 1998 2000
The number of visits to the six museums and galleries sponsored by the DCMS in London that had previously charged increased from 4.3 million for the Dec-June period 2000-2001 to 7.0 million for the same period in 2001-2002, an increase of 62 per cent4. Visitors to the Victoria & Albert Museum are up by 157 per cent.
In its first year Tate Modern had 5.25 million visitors5, making the new gallery the most popular modern art museum in the world and the third most popular tourist attraction in Britain, after the British Museum (5.7 million) and the Millennium Dome (6.5 million).
…whilst sales throughout the Creative Industries have been on the increase.
The increase in spending on leisure goods and services has had a profound effect across the whole range of Creative Industries, including those, like advertising, that do not actually sell directly to the consumer.
To take advertising as an example, the industry saw significant absolute growth in revenues over the decade to 2000 (Chart 3.3), with total UK advertising expenditure at constant prices growing by 57 per cent. Clearly the past decade has witnessed a period of strong economic growth, and the advertising industry responds very directly to the overall state of the economy. Advertising budgets tend to be cut when finances are tight, and advertising spending has been down over the past year following the downturn in the UK and world economies. However, with economic recovery expected, the longer-term prospects for advertising sales growth continue to be good.
Chart 3.3: UK advertising expenditure, 1991-2001 (1995 prices, £ billion)
0 2 4 6 8 10 12 14 16
1991 1992 1993 1994 1995 1996 1997 1998 1999 2000
Source: The Advertising Association
4 DCMS, 2002
There is a growing world market for London’s creative products… In addition to the rise in domestic demand, a significant increase in demand from abroad for London’s creative services has also taken place over the past five years.
Whilst the value of total UK exports of services rose by 37 per cent between 1996 and 2001 (Chart 3.4), the value of exports from a variety of sectors with strong creative elements increased much more rapidly. For example, computer and related services rose by 121 per cent, audiovisual and related services by 80 per cent, and advertising and market research by 104 per cent (Charts 3.5 to 3.7). Although these are UK figures, London provides the main focus for all these service industries. The only other service sectors that are exhibiting such rapid export growth rates are Financial Services with 97 per cent growth and Business Services with 69 per cent growth between 1996 and 2001.
Chart 3.4: Overseas trade in services, 1991-2001 (£ billion)
0 10 20 30 40 50 60 70 80 90
1991 1992 1993 1994 1995 1996 1997 1998 1999 2000 2001
Exports
Imports
Chart 3.5: Overseas trade in computer & information services, 1991-2001 (£ million)
0 500 1000 1500 2000 2500 3000
1991 1992 1993 1994 1995 1996 1997 1998 1999 2000 2001
Exports
Chart 3.6: Overseas trade in audiovisual & related services, 1991-2001 (£ million)
0 100 200 300 400 500 600 700 800 900 1000
1991 1992 1993 1994 1995 1996 1997 1998 1999 2000 2001
Exports
Imports
Chart 3.7: Overseas trade in advertising and market research, 1991-2001 (£ million)
0 200 400 600 800 1000 1200 1400 1600
1991 1992 1993 1994 1995 1996 1997 1998 1999 2000 2001
Exports
Imports
The globalisation of markets in the developed world in general will make London’s international position increasingly valuable. In particular, London is well placed as a bridge between markets across the EU and the US. Growth in international trade has always been a driver of economic performance and the Creative Industries are no exception. London has a strong set of assets that make it well placed to exploit the growing global market for creative products and services.
…and its success can breed further success.
Creative Industries add not only to the cultural life of the city, but also to its image as a dynamic and interesting place to be – whether as a tourist, a location for business or a place to live.
Section 4: Harnessing London’s capital: the new
productive structure and the resources it needs
The success of the Creative Industries proves that London offers what is needed for a new high-growth, value-added sector.
London’s costs are high; its winners are those who provide what the customer wants. The keys to achieving this are the supply side advantages that London offers.
London’s prime asset is its social capital: a highly skilled, diverse and
multicultural workforce. It does business in the world’s language – and speaks another 300. Only New York has comparable advantages.
To utilise human capital efficiently, proximity is decisive. London is a creative factory; it gives access to the entire range of services required to deliver customised products on a large scale to tight deadlines.
Rapid growth rates are no longer the sole preserve of the City… The very success of London’s Creative Industries is proof that something new is happening to the capital’s economy. This success has been made possible by the expansion of financial and business services, but it is now clear that high growth rates are no longer the sole preserve of the City. London has undergone a transformation which has created conditions in which large sectors are able to experience high growth in both output and jobs. It is a central priority for both London and the UK to identify the nature of these conditions.
…yet with such diversity amongst the Creative Industries…
The Creative Industries are themselves highly diverse. There is nothing special about their industrial structure that provides a clue to their success (Charts 4.1 and 4.2). Each industry has a specific form of organisation, and a particular set of needs. Future reports commissioned by the mayor will deepen our understanding of these.6
…it is important to understand what has enabled them to prosper. However, their rapid and productive growth – and their concentration in London and the South East – makes it clear that the capital meets decisive needs that they all have in common.
Chart 4.1: Average size of enterprise in the UK Creative Industries, 2000
0 50 100 150 200 250 300 350
Radio & TV Computer games, software, electronic publishing
Fashion Architecture Publishing Total Creative Industries
Advertising Art/ antiques trade
Music and the visual & performing
arts
Video, film & photography
Number of
employee jobs per ent
erpris
e
Source: ONS Annual Business Inquiry
Chart 4. 2 Capital intensity in the Creative Industries, 2000
0 1 2 3 4 5 6 7 8
Radio & TV Video, film & photography
Advertising Fashion Computer games, software, electronic publishing
Creative Industries
average
Music and the visual & performing
arts
Publishing Architecture Art/ antiques trade
Net capital acquisitions per empl
o
London is a high cost location for business…
At first sight the emergence of a new high-output sector in London appears
paradoxical. The city’s precipitate growth in the last two decades, as the London Plan has identified, has given rise to major shortages in transport, housing and the labour force. These shortages have driven up prices, creating a business environment dominated by costs substantially in excess of the UK average. If the only factor affecting business profitability were cost-reduction, London businesses would be the least likely candidates for success. Indeed, between 1971 and 1991 London lost 665,000 workforce jobs, entirely accounted for by the destruction of 698,000 manufacturing jobs7.
…yet financial and business services and now the Creative Industries are succeeding.
London’s role as a centre for financial and business services, selling into a new global market, has clearly transformed this situation and elevated London to the level of a leader of UK growth.
The prodigious success of the Creative Industries shows that such expansion is not confined to the financial sector. London’s new position in the world, the quality of its young and diverse workforce and the unique combination of supply-side factors that have emerged to support the financial and business services sector, have created the conditions for this new type of industry.
London has some specific advantages…
London-based enterprises, from the smallest to the largest, cope with two pressures. First, they sell into highly competitive markets, with constant downward pressures on prices and all the risks of being driven out by global rivals with superior resources. Second, they are producing in one of the most expensive locations in the world.
The decisive preconditions for sustained expansion are therefore the supply-side elements that make high value-added production possible in a costly environment.
The industries that prosper are precisely those, like the Creative Industries, that are able to capitalise on London’s specific advantages:
A skilled, flexible and culturally diverse labour force that is fluent in the world’s main global language.
A developed high-technology infrastructure. Access to a wide range of business services.
Proximity to the command and control functions that serve the world’s major industries.
…such as a skilled, flexible and diverse labour force.
London’s highly skilled and qualified workforce, and its diverse and multicultural make-up – with an estimated 300 languages spoken in London schools8 – are the
7 Planning for London’s Growth, GLA 2002
UK’s greatest competitive asset in this new mass market. In this respect only New York is comparable.
London has a bipolar distribution of educational achievement (Table 4.1). On the one hand, over 25 per cent of the working-age population have no qualifications or no better than NVQ level 1 (GNVQ foundation or Youth Training only). On the other, over a third of its working-age population have a qualification at HND or degree level (NVQ level 4) or higher, and half are qualified at or above NVQ level 3 (two A-levels or more).
London has thus already met the National Learning Adult Qualification Targets9 for 2002. By the standards of the new industries this is good – but not that good. The Creative Industries require a workforce that is adept, qualified, and capable. 41 per cent of Creative Industries professionals – and 32 per cent of those working in Creative Industries – have degree qualifications10. Removing all barriers to
[image:27.612.118.504.285.401.2]participation in the new labour market, and raising educational attainment in London at all levels, is clearly a prime condition for success.
Table 4.1: Qualification of working-age population
Percentage with qualifications at or
above: NVQ level 5 NVQ level 4 NVQ level 3 NVQ level 2 NVQ level 1
UK 4.5% 23.9% 45.0% 73.8% 83.8%
London 7.7% 31.5% 50.0% 74.0% 85.9%
Source: Labour Force Survey
It offers close proximity to other creative producers and services… Any global advantage London may have in terms of human and social capital is not enough to explain its success in Creative Industries. A further set of factors needs to be in place to mobilise this resource.
The next key factor that unites these diverse industries is proximity. Proximity is the primary reason for the clustering of service-orientated industries. It is evident in the intense concentration of Business Services in a city like London. The processes that lead to clustering are also at work in the Creative Industries.
Trying to understand these processes by studying individual businesses is equivalent to trying to see how an office works by examining a single desk. While the
functionality of the desk is relevant it is not the whole story. What really matters is the entity created by the collection of desks together with the phones, printers, and
everything else that the office requires – and in particular the people that operate them.
London is such an entity. It is London as a whole that nurtures success. It offers the entire range of supply-side requirements that permit creative producers, their suppliers and their purchasers to interact and work together to bring about the final product.
London also provides producers with proximity to each other – and that is its unique asset.It provides the capacity for inspiration, for innovation and the spread of ideas. This is why the secret of London’s Creative Industries success is not something that can be easily transplanted to another location.
…and proximity to a local and international market place.
The customers for the products and services of the Creative Industries form a complex chain leading from initial manufacturers, such as textile makers, all the way up to individual consumers. Purchasers may be the customer who walks into a local boutique or exporters to the world using London as their base. These purchasers call on a bewildering range of inputs and resources, all of which must be within reach.
Proximity facilitates innovation…
Innovation generally requires closeness. When computers were new, 30 years ago, companies constructed mainframes in central London. Even though such machines then took up huge amounts of space they needed to be under the eye of management, simply because they were so new and important. Now that computing is standard and standardised, it has moved out of London. But innovation has not.
Proximity also provides the opportunity for company-hopping, itself an innovative process as designers, advertisers and so on change agency and acquire new partners. Sometimes their clients move too, and sometimes they too are refreshed by a new approach.
…allows for rapid, flexible service delivery…
Within reach means on time. Timing is the key to modern flexible service delivery; it is what the Creative Industries have to provide. Just-In-Time production may be a modern term, but theatres and orchestras have been delivering it for millennia. There is no deadline more demanding than a curtain rising, nothing more synchronised than a concert performance, and no human action more precisely co-ordinated than a pas de deux.
…and most importantly personal interaction or face-to-face contact. Intellectual inputs require face-to-face human contact, and that is why the great cities are finding a new role as the locus of a network of suppliers and consumers, forming a supply chain in which rapid and frequent liaison with providers and immediate
purchasers are of decisive importance.
London is well provided for in communication, both physical and virtual. The ability to act in a global market also requires international communication – whether electronic or face-to-face. The importance of international personal
interaction must not be underestimated and it is no accident that the focus of Creative Industries activity is down the corridor to Heathrow. Electronic communication is an addition to – and an essential ingredient of – but not a substitute for real meetings involving real people.
passengers used the airport11. Only the large USA hubs carry more passengers and even when these are included Heathrow is still the 5th largest airport in the world.
In addition, London’s position as a location of choice for financial command and control centres has given it highly developed, if unevenly-distributed, connectivity. In terms of top-end, high-speed Internet connections, it is among the best provided cities in the world with virtually the whole of the City wired up for high-speed Internet access.
Future success cannot be guaranteed…
Though London’s Creative Industries have proven ability and great potential, their success is not guaranteed. In one sense, failure and success are both a part of what they do. There are probably no great triumphs without great disasters.
…and creativity and innovation involve risk.
Creativity is synonymous with experimentation. To innovate constantly, the Creative Industries must take constant risks; they must try out new products, new styles, and new ideas. But at some point the consumers themselves eventually have their say; and no matter how well-researched the decisions, or well-crafted the formula for success, only then does the industry finally discover whether the idea will be successful.
Innovation also means that yesterday’s good idea may be superseded. For example, the music industry is currently struggling with new technology – such as MP3 – that makes it easy to download music and evade copyright restrictions. The industry is fighting legal battles to protect its position, as with the Napster case, but it may be hard to maintain this position in the longer term. The future of the traditional recording company, which has existed since recordable media became feasible a century ago, is now in doubt.
The Creative Industries, like the dotcoms, are not immune from the fundamental laws of business – to succeed they must deliver what the customer wants, when they want it and they must deliver it better than any competitor.
The very size of the industry is the basis for its sustainability…
Scale of production is one way the Creative Industries sector has begun to deal with risk. As can be seen from Hollywood, to be sustainable a creative industry must be large enough to live with failures. Once again, it is the very scale of service delivery in and from London that lays the basis for sustainable Creative Industries.
Although it is impossible to produce only successes, it is possible to create the general circumstances in which failure can be absorbed – and this can and should be, in itself, the way to ensure the continued experimentation that guarantees the highest quality.
… yet London must continue to ensure that the conditions for success are in place.
The key requirement is therefore to ensure that all the general requirements for a stable industry are present. The evidence suggests that if any is missing, an industry will face serious problems and will migrate elsewhere.
Box 4.1 cites the DTI’s 1998 report on the British Fashion Designer Industry, which sheds light on the requirements of a modern creative industry. It clearly demonstrates that although London has succeeded in providing many of the conditions that permit Creative Industries to prosper, when it fails to do so, it is possible to lose part or even all of its talent to a different location that does provide the key supply requirement of a particular industry – be it Italy for fashion, Hollywood for films, or New York for music.
The clear message that emerges is that in order to compete Creative companies need to invest. They need to invest in skills – particularly business skills and market skills. They need to invest in research and development – to get ahead of the game. They need to invest in technology – the key to speed for just-in-time delivery and in the long run keeping costs down. These are some of the keys to future success.
Box 4.1: Italy or the UK? Manufacturing and sourcing in the UK fashion industry
‘It is difficult to locate a good quality supplier in the UK not tied to volume,
mainstream production and able to handle designer sampling and small runs. However 70 per cent of the companies questioned used UK manufacturers. The two reasons cited were that designers found it easier to exert control over production, and there aren’t sufficient volumes to justify overseas manufacture. Only four companies said they manufactured solely abroad, saying that the quality of UK manufacture wasn’t good enough. Of these, only Italy was mentioned as a source. The main problems experienced with factories were cited as follows: delivery times, failure to meet agreed deadlines, not following instructions, quality control, poor communication, unexpected price changes, de-prioritising of work, poor finishing, machinery breakdown, using the wrong materials…
‘[In Italy] many manufacturers afford a greater importance to designers. The majority of manufacturers, however, are small, some specialising in one brand. The
relationship between designer and manufacturer is generally closer than in the UK. In Italy the clothing supplier as well as the designer has to know the market, production and cloth, etc. The designer focuses on design and leaves the brand development to the manufacturer. The textiles and clothing manufacturing industry in Italy appears more willing to invest in designer companies, as they can see the benefit in terms of design, production and business. Manufacturers and designers collaborate and work together, and designers are part and parcel of Italian businesses. A great deal is invested in new technology by the manufacturer. The Italian designer industry has by far the largest and the most modern technological manufacturing base.
‘Manufacturing in France and the USA as in the UK is not geared towards designers, which is why there appears to be a general trend emerging of manufacturing moving to Italy for designer wear.’
Section 5: Clustering and diversity: the spatial
distribution of London’s Creative Industries
The Creative Industries in London are relatively strongly clustered, though not to the same extent as financial services in the City of London.
Westminster has the largest and fastest growing cluster, with other poles of growth in the central London boroughs to the north and west, along a western corridor to Hounslow and to a lesser extent in the eastern and southern city fringes.
However, the potential for future growth in the Creative Industries extends to every London borough, provided the right opportunities exist.
London’s primary creative cluster is within the West End…
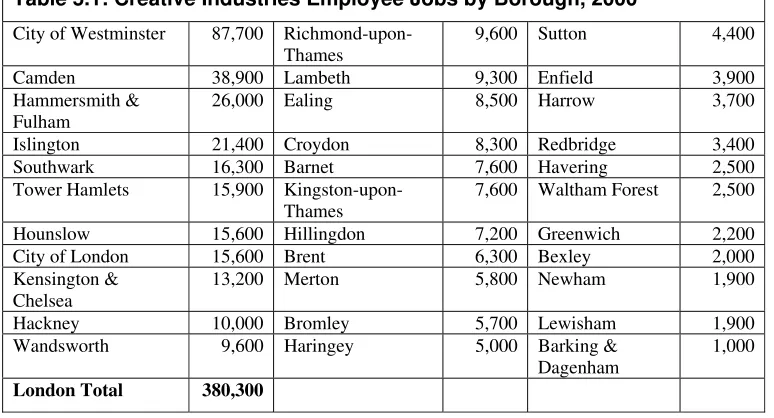
[image:31.612.123.510.412.621.2]The Creative Industries in London are at present relatively strongly clustered, with the primary cluster in the West End, largely contained within the borough of Westminster (Table 5.1).
If we focus on the number of people working for firms classified as part of London’s Creative Industries12 then Westminster accounts for 23 per cent of the London total. In comparison, the City of London accounts for 46 per cent of the London total of Financial Services employee jobs.
Table 5.1: Creative Industries Employee Jobs by Borough, 2000
City of Westminster 87,700 Richmond-upon-Thames
9,600 Sutton 4,400
Camden 38,900 Lambeth 9,300 Enfield 3,900
Hammersmith & Fulham
26,000 Ealing 8,500 Harrow 3,700
Islington 21,400 Croydon 8,300 Redbridge 3,400
Southwark 16,300 Barnet 7,600 Havering 2,500
Tower Hamlets 15,900
Kingston-upon-Thames
7,600 Waltham Forest 2,500
Hounslow 15,600 Hillingdon 7,200 Greenwich 2,200
City of London 15,600 Brent 6,300 Bexley 2,000
Kensington & Chelsea
13,200 Merton 5,800 Newham 1,900
Hackney 10,000 Bromley 5,700 Lewisham 1,900
Wandsworth 9,600 Haringey 5,000 Barking &
Dagenham
1,000
London Total 380,300
To get a further sense of the extent of clustering, a third of the boroughs account for 71 per cent of Creative Industries employee jobs. The comparable figure for Financial Services is 86 per cent and for Business Services 68 per cent.
…with secondary clusters in West London and the City Fringe.
The West End creative cluster extends northward into Camden and Islington (Table 5.1). Hammersmith & Fulham represents a slightly separate focus of Creative Industries employment, dominated by the BBC at White City. The City fringe boroughs (Southwark, Tower Hamlets and to a lesser extent Hackney) form another zone of Creative Industries clustering, whilst the City itself contains a cluster of the computer games, software and electronic publishing sector. The focus of the final grouping of the Creative Industries is Hounslow, and in particular Heathrow Airport. From the airport into the centre of London there is a corridor of creative activity which includes the boroughs of Wandsworth, Richmond-upon-Thames and Ealing.
Greatest employee job increase has been taking place in Westminster… Between 1995 and 2000 the biggest increase in the absolute number of employee jobs took place in Westminster (Chart 5.1).
In broad terms the main growth in jobs in the Creative Industries has been in the central boroughs to the north and west, as well as Hounslow and to a lesser extent in the Eastern and Southern city fringes. These are, on the whole, the boroughs that already had stronger concentrations of Creative Industries jobs, with the Western corridor and City fringe clusters emerging clearly.
Chart 5.1: Change in total Creative Industries employee jobs, 1995-2000
Islington K en sin gto n a nd C
hels ea H am m ersm ith a
nd F ulh am Camden City Hackney Tower Hamlets Greenwich Lewisham Lambeth Southwark Hounslow Richmond upon Thames Kingston upon Thames Waltham Forest Barking and Dagenham Haringey Newham Wandsworth Westminster Barnet Bexley Brent Bromley Croydon Ealing Enfield Harrow Havering Hillingdon Merton Redbridge
…but Hounslow has seen the fastest growth.
If we look at the rate of growth over the same period a slightly different picture emerges. Between 1995 and 2000 dramatic growth of 173 per cent took place in the Creative Industries in Hounslow, driven largely by the radio & TV, and computer games, software & electronic publishing industries (Box 5.1).
Whilst growth rates were substantial in most of the boroughs with existing high concentrations of Creative Industries, sizeable growth rates were also apparent in some of the outer London boroughs with lower existing concentrations, such as Havering, Merton, Enfield, Barnet and Harrow.
This provides some strong indication that opportunities for Creative Industries growth do exist in a variety of boroughs throughout the capital. Indeed, looking in more detail at some of the sectoral changes by borough reveals some very varied growth patterns.
Advertising employment is growing rapidly in Westminster and Barnet… The pattern of change in employee jobs from 1995 to 2000 unsurprisingly shows that advertising, the most geographically concentrated of the Creative Industries within the West End, has seen almost half its job growth within the borough of Westminster. However, intriguingly, the next largest growth in employee jobs has been in Barnet (Chart 5.2).
Box 5.1: Heathrow and the western corridor
Heathrow Airport has recently been playing an important role in influencing the location of growth in the Creative Industries. The rapid growth apparent in Hounslow and along a western corridor into the West End across a variety of Creative Industries is largely due to the ease of access to international transport infrastructure, reflecting the continuing importance of face-to-face contact in industries – such as film, TV and music – that are becoming increasingly global.
The rapid development in the computer games, software & electronic publishing industries in Hounslow is part of a trend that has seen expansion in this sector along the M4 corridor out of, as well as into, London.
Hammersmith and Fulham, the borough with the third largest number of Creative Industries jobs, has benefited greatly from its location between the West End and Heathrow. In addition to continued growth in employee jobs in the TV and radio sector as the BBC continues to consolidate on its White City sites, it has also seen growth in publishing, computer games, software & electronic publishing and fashion. Global creative companies in the borough include the Walt Disney
Chart 5.2: Change in advertising employee jobs, 1995-2000
Chart 5.3: Change in computer games, software & electronic publishing employee jobs, 1995-2000
Richmond upon Thames Hounslow H am m ersm ith a nd F ulh am Ke nsin gto n a nd C he lsea Kingston upon Thames Tower Hamlets City Hackney Islington Waltham Forest Barking and Dagenham Hillingdon Camden Haringey Lambeth Lewisham Newham Southwark Wandsworth Westminster Barnet Bexley Brent Bromley Croydon Ealing Enfield Greenwich Harrow Havering Merton Redbridge
Sutton Quartile with the most +ve growth (1) Quartile 3 of +ve growth (1) Quartile 2 of +ve growth (4) Quartile 1 of +ve growth (16) Quartile 1 of -ve growth (5) Quartile 2 of -ve growth (4) Quartile 3 of -ve growth (1) Quartile with the most -ve growth (1)
Southwark Lambeth Kens ingt on and Che lsea Lewisham H amm ersm ith a
nd F ulh am Westminster City Tower Hamlets Hackney Hounslow Richmond upon Thames Kingston upon Thames Islington Waltham Forest Barking and Dagenham Camden Haringey Newham Wandsworth Barnet Bexley Brent Bromley Croydon Ealing Enfield Greenwich Harrow Havering Hillingdon Merton Redbridge Sutton
In contrast the City of London and Hounslow have driven growth in employment in computer games, software & electronic publishing (Chart 5.3).
Growth in fashion industry employment has taken place on an axis from the West End towards the southwest. The largest increases in employee jobs took place in
Westminster, but significant growth also took place in Hammersmith & Fulham, Wandsworth and Kingston-upon-Thames (Chart 5.4).
…whilst publishing has been leaving the City for the City Fringe. The location of the publishing industry within London has changed rapidly over recent years. The City of London has seen significant job losses in the publishing sector, though these have been more than replaced by increases in employment in the computer games, software & electronic publishing sector. Publishing jobs have continued to move out into the City fringe, primarily in Tower Hamlets, but also north to Islington and Camden and west to Hammersmith & Fulham, and Kensington and Chelsea (Chart 5.5).
Chart 5.4: Change in fashion employee jobs, 1995-2000
Even within neighbouring boroughs trends are highly contrasting. Creative Industries employment in Tower Hamlets is dominated by the publishing industry, while neighbouring Southwark has a much more diverse range. Southwark has been witnessing particularly strong growth in TV & radio and architecture.
Lewisham Southwark K en sin gto n a nd C
hels ea Hillingdon Kingston upon Thames Richmond upon Thames Waltham Forest Hackney Camden City H amm ersm ith a
nd F ulh am Tower Hamlets Barking and Dagenham Haringey Islington Lambeth Newham Wandsworth Westminster Barnet Bexley Brent Bromley Croydon Ealing Enfield Greenwich Harrow Havering Hounslow Merton Redbridge
Chart 5.5: Change in publishing employee jobs, 1995-2000
Detailed analysis of particular sectoral and geographical trends such as these is of considerable interest, but involve a level of detail that is not within the remit of this report. Future work by GLA Economics will seek to analyse more deeply sectoral trends within London’s Creative Industries.
The Creative Industries should continue to grow…
With demand for leisure goods and services continuing to rise, the market for the products of the Creative Industries is unlikely to become saturated and indeed should continue to expand. Certain industries, such as advertising, may be particularly sensitive to the condition of the economy, but on the whole the dangers of over supply are low.
…and providing there are locations fulfilling particular industry needs… Growth of an individual creative industry within a specific area of London is
dependent on a variety of factors. The availability of suitable/affordable office or industrial property (clearly the requirements of an artist studio or gallery are very different from those of a global music corporation), an available local workforce with a suitable skill base, proximity to London’s transport infrastructure (or in some cases access to global routes) and proximity to suppliers, are all of key importance.
…every London borough can benefit.
But one of the key features of the Creative Industries is their variety and, whilst not every borough is likely to benefit from growth in the currently highly concentrated advertising industry, every borough can benefit from having a full range of cultural facilities and identifying what industry clusters, however small, have the potential to grow. It would therefore seem reasonable for all boroughs to develop Creative Strategies to make use of their local strengths.
Southwark
Kens ing
ton and C
he lsea Kingston upon Thames Richmond upon Thames Waltham Forest Hackney Islington Tower Hamlets Ham m ersm ith an d Fulh
am Barking and Dagenham City Camden Haringey Lambeth Lewisham Newham Wandsworth Westminster Barnet Bexley Brent Bromley Croydon Ealing Enfield Greenwich Harrow Havering Hillingdon Hounslow Merton Redbridge Sutton