http://dx.doi.org/10.4236/health.2015.76087
Development and Evaluation of Disease
Management Program and Service
Framework for Patients with
Chronic Disease
Kana Kazawa
1, Kiminori Yamane
2, Noriaki Yorioka
3, Michiko Moriyama
11Division of Nursing Science, Institute of Biomedical and Health Sciences, Hiroshima University, Hiroshima, Japan 2Chugoku Health Administration Center, Nippon Telegraph and Telephone West Corporation, Hiroshima, Japan 3Hiroshima Kidney Organization, Hiroshima, Japan
Email: [email protected], [email protected], [email protected], [email protected]
Received 9 May 2015; accepted 20 June 2015; published 23 June 2015
Copyright © 2015 by authors and Scientific Research Publishing Inc.
This work is licensed under the Creative Commons Attribution International License (CC BY). http://creativecommons.org/licenses/by/4.0/
Abstract
We developed a disease management program and service framework to enhance the self-mana- gement skills of patients with chronic diseases for the first time in Japan. In this study, we ana-lyzed the efficacy of this program. A single-group pre-test and post-test design was used. In the program, disease management nurses provided self-management education to patients that were specific for their disease and risk factors in cooperation with their primary physicians. The dura-tion of the program was 6 or 12 months. A total of 1258 patients were enrolled. After excluding discontinued subjects, 987 patients in the diabetes program and 11 patients (except those with diabetic nephropathy) in the chronic kidney disease (CKD) program were analyzed. The diabetic patients showed improvement of HbA1c and blood pressure after intervention, as well as main-taining renal function. CKD patients showed no change of renal function after intervention, but there was improvement of non high density lipoprotein-cholesterol (HDL-c). The patients ac-quired the ability to detect at an early stage and respond to abnormal symptoms and data, which enabled them to avoid progression of their diseases and emergency hospitalization. The program was effective at preventing disease progression in patients with chronic illnesses and may contri-bute to the containment of medical costs.
Keywords
1. Introduction
Around the world, there has been a shift from the era of infectious diseases to the era of non-infectious diseases, particularly cancer and lifestyle-related diseases, and patients with multiple chronic diseases are increasing [1]. For the management of chronic diseases, it is essential to improve lifestyle factors such as diet, exercise, smok-ing, and drinking alcohol, while tailoring drug therapy for the patient’s primary disease and risk factors. To achieve this, comprehensive management needs to be based on collaboration between patients and health care professionals as well as interprofessional collaboration [2] [3]. The current healthcare system in Japan, however, is designed to respond to acute illness and is not able to deal effectively with chronic diseases, and medical ex-penditure is increasing because payment system for preventive care has not been developed sufficiently [4] [5]. Hence, from the viewpoint of cost containment, it is necessary to introduce an outcome management approach that provides high-quality health care while assigning medical resources more effectively. For this purpose, the “Disease Management” methodology proposed by the Disease Management Association of America seems to be suitable. There have already been several reports about improvement of health outcomes and control of medical expenditure due to implementation of disease management [6]-[16].
Because patients are also members of the chronic disease management team, education about self-manage- ment of their diseases is very important. Systematic reviews of chronic diseases have demonstrated that patient education to enhance self-management skills has a major impact on improving outcomes [17] [18]. Furthermore, it has been reported providing structured education with a combined theoretical and evidence base can lead to better outcomes [17].
Against this background, we developed a disease management program and service providing framework aimed at enhancing the self-management skills of patients, which is a new model for providing chronic disease care for patients under the national health insurance system in Japan. In this program, specially educated as “disease management nurses” provide the disease management program to insured patients with a high risk of disease progression who are identified by data analysis. So far, we have developed this program for several chronic diseases, including diabetes, chronic kidney disease (CKD), chronic obstructive pulmonary disease, heart failure and stroke. We have found that the program contributes to prevention of disease progression and recurrence, as well as improving quality of life (QOL) and reducing routine outpatient visits and rehospitaliza-tion [10]-[16]. Furthermore, in order to return the benefits to society, we set up a disease management corpora-tion (DPP Health Partners Co., Ltd.: DPP) in 2010, the first disease management company in Japan. Currently, DPP is working to continuously improve program quality in cooperation with Hiroshima University, as well as providing the program to patients with chronic diseases nationwide. In the present study, we focused on the Di-abetes (including diabetic nephropathy) and CKD (renal dysfunction due to diseases other than diDi-abetes) pro-grams and evaluated the efficacy of the propro-grams provided by DPP.
2. Disease Management Program and Service Framework
2.1. Development of the Program Structure and Processes
Disease management involving the following five processes: 1) identification of a target population, 2) provision of standardized medical treatment and patient education based on evidence-based clinical practice guidelines, 3) interprofessional collaboration, 4) analysis and evaluation of outcomes and processes, 5) feedback to health care professionals and patients [19]. In Japan, all citizens are obliged to join the health insurance organizations, and each health insurer keeps data on subscribers such as statements of medical expenses and the results of annual health check-ups (metabolic screening examinations). Therefore, in cooperation with medical clinics and hospit-als, we developed a service framework, involving health insurers to provide the program.
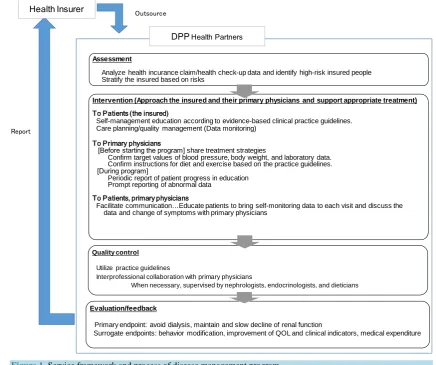
Under the service framework explained inFigure 1, the program outlined is provided. First, DPP supports each health insurer to analyze its database and identify patients (the insured) with a high risk of disease progres-sion and recurrence. Then the disease management nurses provide education these patients and perform conti-nuous monitoring in collaboration with the primary physicians. In addition, they regularly evaluate outcomes in terms of efficacy for preventing disease progression, the effect on QOL, and medical costs, and provide feed-back to the insurers in order to improve service quality.
2.2. Details of the Program
Figure 1. Service framework and process of disease management program.
containment of medical expenses by developing the self-management skills of patients. Since Prochaska et al. (1997) reported that people maintain a change of behavior after 6 months, the duration of the program was set at 6 months, although we also provided a longer 12-month program (6 months × 2 courses) if requested to by the health insurers.
Education was given by face-to-face interview and telephone, and interviews were held for approximately 1 hour at the patient’s home or a community center prepared by the insurer once a month for 3 months after enrollment (a total of 3 interviews). Telephone education was performed for approximately 30 minutes every 2 weeks (a total of 9 times). After checking the level of knowledge of the patient on the first day, education was provided using a text prepared by the authors, which covered diet, exercise, drug therapy, foot care, stress man-agement, cessation of smoking, abstaining from drinking alcohol, and other measures for daily life based on the patient’s disease and the risk factors. Regarding diet, patients were educated about restricting the intake of salt, calories, and/or protein according to their disease. Regarding exercise for patients with renal dysfunction, we took into account maintaining a balance with rest. The nurses also talked with patients about factors preventing behavioral change and solutions, and then set action plans for diet and exercise. In addition, using a handbook prepared by the authors, they provided education about self-monitoring skills related to achieving the action plans for blood pressure, pulse rate, body weight, diet, and exercise.
The program involved andragogic education and was designed so that patients could learn from experience (internally driven learning), and it utilized various theories of behavioral change, such as self-efficacy [20], the transtheoretical model [21], motivation interviewing, and the social support theory. During the program, the nurses developed a partnership with the patients in order to support them through the stress and anxiety asso-ciated with behavioral change, and also assisted them to receive the necessary healthcare services.
Outsource
Report
Assessment
Analyze health incurance claim/health check-up data and identify high-risk insured people Stratify the insured based on risks
Intervention (Approach the insured and their primary physicians and support appropriate treatment)
To Patients (the insured)
Self-management education according to evidence-based clinical practice guidelines. Care planning/quality management (Data monitoring)
To Primary physicians
[Before starting the program] share treatment strategies
Confirm target values of blood pressure, body weight, and laboratory data. Confirm instructions for diet and exercise based on the practice guidelines.
[During program]
Periodic report of patient progress in education Prompt reporting of abnormal data
To Patients, primary physicians
Facilitate communication…Educate patients to bring self-monitoring data to each visit and discuss the data and change of symptoms with primary physicians
Quality control
Utilize practice guidelines
Interprofessional collaboration with primary physicians
When necessary, supervised by nephrologists, endocrinologists, and dieticians
Evaluation/feedback
Primary endpoint: avoid dialysis, maintain and slow decline of renal function
Surrogate endpoints: behavior modification, improvement of QOL and clinical indicators, medical expenditure DPPHealth Partners
2.3. Training of Disease Management Nurses (Quality Assurance)
Disease management nurses trained by Hiroshima University and DPP provided the program. These nurses re-ceived lectures on diseases and treatment from physicians, lectures on diet from nutritionists, and lectures on disease management, managing patients with chronic diseases, behavioral change theory and practice, and tele-nursing from nurses who were specialists in managing chronic diseases. After that, they were trained in patient education by role playing and clinical practice. In order to achieve continuous improvement of quality, we es-tablished a certification system and routinely evaluated the performance of the nurses.
3. Methods
3.1. Subjects
Patients of diabetes or CKD who met the eligibility criteria and completed the disease management program provided by DPP from 2011 to 2014.
Inclusion criteria: In order to extract patients with diabetes or CKD and at high risk of disease progression (at high risk of requiring dialysis in the future), we employed the following 4 criteria and extracted patients who met any of these criteria: hemoglobin A1c (HbA1c) ≥ 6.5%, fasting blood glucose (FBG) ≥ 126 mg/dl, urine protein (UP) ≥ 30 mg/dl, and/ or estimated glomerular filtration rate (eGFR) < 60 ml/min/1.73 m2. After regis-tering the subjects, we assigned them respectively in the CKD program and the diabetes program by their dis-ease.
Exclusion criteria: Patients were excluded if they had an eGFR of less than 15 ml/min/1.73 m2, if they were receiving treatment for cancer, if they had severe complications, if they had end-stage kidney disease, and if they had dementia or a mental disorder.
3.2. Period of Analysis
From December 2010 to May 2014.3.3. Research Design
A single-group pre-test and post-test design was used.
3.4. Outcomes
As the primary endpoints of this study, we used serum creatinine (SCr) and eGFR to evaluate their renal func-tion, and the number of patients starting dialysis. The following surrogate endpoints were also collected: HbA1c, FBG, blood urea nitrogen (BUN), uric acid (UA), albumin (Alb), hemoglobin (Hb), potassium (K), non HDL-c, triglycerides (TG), UP, blood pressure, and body mass index (BMI). To calculate eGFR and non HDL-c, we used the following formulae: eGFR (mL/min/1.73 m2) = 194 × SCr−1.094 × age−0.287 (×0.739, for females) (Japa-nese Society of Nephrology [22]), and non HDL-c = total cholesterol − HDL-c. UP data were classified on the following scale: <30 mg/dl (0 points), ≥30 mg/dl and <100 mg/dl (1 point), ≥100 mg/dl and <300 mg/dl (2 points), and ≥300 mg/dl (3 points).
As psychological indicators, we used the self-efficacy scale of health behavior in patients with chronic dis-eases [23] and 2 items of the WHO-QOL26 indicating overall QOL [24]. We also evaluated the frequency of self-management activities (dietary and exercise target behaviors; self-monitoring of blood pressure, body weight, and blood glucose levels; and compliance with the instructions of physicians about medication) on a scale of 1 to 6 (0: never, 1: 1 - 2 times a month, 2: 1 - 2 times a week, 3: 3 - 4 times a week, 4: 5 - 6 times a week, 5: every day). As economic indicators, we collected data on the number of unscheduled hospital visits and number of patients hospitalized.
3.5. Data Collection
3.6. Recruitment and Registration Procedures
When a health insurer signed a contract with DPP, the nurses identified patients who met the inclusion criteria based on results of health check-up and medical claim data. Then the insurer sent a request for each insured pa-tient to join this program, and the nurses called them to explain the objectives of the program and obtain written consent. After the patients were registered in the program, then we asked their primary physicians for detailed information on their treatment which was confirmed by a mailed form.
3.7. Method of Analysis
After the normal distribution of each indicator was confirmed, we analyzed data with one-way repeated meas-ures ANOVA or Friedman’s test. Descriptive statistics were calculated for economic indicators. For all statistic-al anstatistic-alyses, the level of significance was set at p < 0.05.
3.8. Ethical Considerations
Hiroshima universityreceived the data from DPP after removed personal information. Approval was obtained from the ethics committees of Hiroshima University.
4. Results
4.1. Subjects
Out of a total of 1,258 patients who gave consent were assigned to the diabetes program or the CKD program, 998 patients completed the programs (completion rate: 79.3%), including 987 patients in the diabetes program and 11 in the CKD program (Figure 2).
Reasons for dropout were being too busy, already receiving education at a hospital, hospitalization (orthoped-ics), or burden of family care. The mean age of all subjects was 65.2 ± 8.3 years and there were 571 males (57.2%) and 427 females (42.8%).
Regarding treatment, there were no significant differences between baseline and the end of program in the number of subjects who were taking antidiabetic drugs, insulin, angiotensin II receptor blockers, angiotensin converting enzyme inhibitors, diuretics, erythropoiesis stimulating agent, drugs for uremic toxins, and drugs for hyperkalemia.
Atregistration
During program Allocation to each program according to underlying disease
At analysis
n = 1258
Dropout n = 260 Dropout n = 0
n = 11
Dia betes n = 1247 CKD n = 11
All participants were enrolled in the 6-month program
6-month program n = 888 12-month program n = 359
n = 987
6-month program n = 729 12-month program n = 258
Reason: too busy, already educates at a hospital, surgery or hospitalization (orthopedic), family care, or lost to follow-up
4.2. Efficacy of the Program
None of the subjects started dialysis during the program. In the diabetes program, one patient developed tran-sient ischemic attack (TIA) and one was hospitalized due to heart failure.
1) Changes of physiological indicators I) Diabetes program (6-/12-month program)
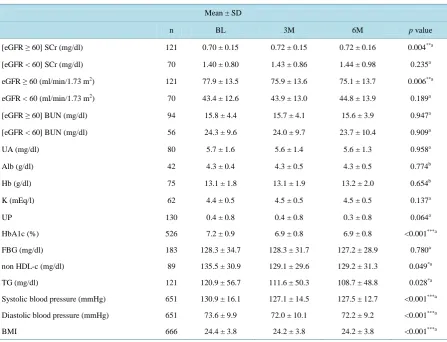
Changes during the 6-/12-month program are shown in Table 1andTable 2. a) 6-month program
For SCr, eGFR, and BUN indicating renal function, analysis was performed by classifying the patients into a group with an eGFR ≥ 60 ml/min/1.73 m2 and a group with an eGFR < 60 ml/min/1.73 m2. In the eGFR ≥ 60 ml/min/1.73 m2 group, SCr increased and eGFR decreased slightly with a significant difference (p < 0.01). The baseline levels of BUN were maintained at 6 months after enrollment. In the eGFR < 60 ml/min/1.73 m2 group, the levels of SCr, eGFR, and BUN were maintained at 6 months after starting the intervention. Other indicators related to renal function (such as UA, Alb, Hb, and K) remained within the reference ranges and UP showed no changes after intervention.
[image:6.595.89.537.343.685.2]HbA1c decreased significantly from 7.2% ± 0.9% at baseline to 6.9% ± 0.8% after 6 months (p < 0.001), and the number of patients with an HbA1c ≥ 7.0% who were at risk of complications or progression decreased from 286 (54.4%) to 206 (39.2%) after 6 months. FBG remained at the baseline level after 6 months. Non HDL-c and TG decreased significantly after intervention (p < 0.05). The systolic blood pressure, diastolic blood pressure, and BMI also decreased significantly (p < 0.001).
Table 1. Change of physioligical indicators (6-month program for diabetes).
Mean ± SD
n BL 3M 6M p value
[eGFR ≥ 60] SCr (mg/dl) 121 0.70 ± 0.15 0.72 ± 0.15 0.72 ± 0.16 0.004**a
[eGFR < 60] SCr (mg/dl) 70 1.40 ± 0.80 1.43 ± 0.86 1.44 ± 0.98 0.235a
eGFR ≥ 60 (ml/min/1.73 m2) 121 77.9 ± 13.5 75.9 ± 13.6 75.1 ± 13.7 0.006**a
eGFR < 60 (ml/min/1.73 m2) 70 43.4 ± 12.6 43.9 ± 13.0 44.8 ± 13.9 0.189a
[eGFR ≥ 60] BUN (mg/dl) 94 15.8 ± 4.4 15.7 ± 4.1 15.6 ± 3.9 0.947a
[eGFR < 60] BUN (mg/dl) 56 24.3 ± 9.6 24.0 ± 9.7 23.7 ± 10.4 0.909a
UA (mg/dl) 80 5.7 ± 1.6 5.6 ± 1.4 5.6 ± 1.3 0.958a
Alb (g/dl) 42 4.3 ± 0.4 4.3 ± 0.5 4.3 ± 0.5 0.774b
Hb (g/dl) 75 13.1 ± 1.8 13.1 ± 1.9 13.2 ± 2.0 0.654b
K (mEq/l) 62 4.4 ± 0.5 4.5 ± 0.5 4.5 ± 0.5 0.137a
UP 130 0.4 ± 0.8 0.4 ± 0.8 0.3 ± 0.8 0.064a
HbA1c (%) 526 7.2 ± 0.9 6.9 ± 0.8 6.9 ± 0.8 <0.001***a
FBG (mg/dl) 183 128.3 ± 34.7 128.3 ± 31.7 127.2 ± 28.9 0.780a
non HDL-c (mg/dl) 89 135.5 ± 30.9 129.1 ± 29.6 129.2 ± 31.3 0.049*a
TG (mg/dl) 121 120.9 ± 56.7 111.6 ± 50.3 108.7 ± 48.8 0.028*a
Systolic blood pressure (mmHg) 651 130.9 ± 16.1 127.1 ± 14.5 127.5 ± 12.7 <0.001***a
Diastolic blood pressure (mmHg) 651 73.6 ± 9.9 72.0 ± 10.1 72.2 ± 9.2 <0.001***a
BMI 666 24.4 ± 3.8 24.2 ± 3.8 24.2 ± 3.8 <0.001***a
HbA1c: hemoglobin A1c, FBG: fasting blood glucose, SCr: serum creatinine, eGFR: estimated glomerular filtration rate, BUN: blood urea nitrogen, UA: uric acid, Alb: albumin, Hb: hemoglobin, K: potassium, non HDL-c: non high-density lipoprotein cholesterol, TG: triglycerides, UP: urine pro-tein, BMI: body mass index, BL; baseline, 3 M; after 3 months, 6 M; after 6 months, a: Friedman’s test, b: One-way repeated measures of ANOVA,
*
Table 2. Change of physioligical indicators (12-month program for diabetes).
Mean ± SD
n BL 3M 6M 9M 12M p value
[eGFR ≥ 60] SCr (mg/dl) 25 0.78 ± 0.13 0.80 ± 0.14 0.78 ± 0.11 0.78 ± 0.14 0.80 ± 0.14 0.263a
[eGFR < 60] SCr (mg/dl) 23 1.45 ± 0.60 1.44 ± 0.64 1.55 ± 0.88 1.35 ± 0.54 1.44 ± 0.71 0.596a
eGFR ≥ 60 (ml/min/1.73 m2) 25 74.0 ± 11.6 72.0 ± 10.0 73.6 ± 8.2 75.0 ± 12.9 72.4 ± 14.1 0.219a
eGFR < 60 (ml/min/1.73 m2) 22 39.8 ± 12.2 42.8 ± 15.1 41.7 ± 17.1 45.0 ± 16.8 44.0 ± 17.2 0.387a
[eGFR ≥ 60] BUN (mg/dl) 17 16.2 ± 3.3 16.3 ± 2.6 17.2 ± 3.4 17.1 ± 3.1 18.0 ± 4.2 0.199a
[eGFR < 60] BUN (mg/dl) 19 26.6 ± 8.7 27.3 ± 9.3 29.3 ± 13.9 25.3 ± 9.9 26.4 ± 11.5 0.564a
UA (mg/dl) 19 6.3 ± 1.4 6.4 ± 1.2 6.4 ± 1.3 6.4 ± 1.2 6.3 ± 1.2 0.828b
Alb (g/dl) 10 4.2 ± 0.2 4.2 ± 0.2 4.2 ± 0.2 4.2 ± 0.0 4.2 ± 0.2 0.992b
Hb (g/dl) 19 13.6 ± 1.4 13.6 ± 1.6 13.4 ± 1.7 13.3 ± 1.9 13.4 ± 2.0 0.239b
K (mEq/l) 20 4.5 ± 0.4 4.6 ± 0.5 4.5 ± 0.5 4.5 ± 0.2 4.8 ± 0.5 0.135a
UP 31 0.3 ± 0.8 0.2 ± 0.5 0.3 ± 0.7 0.2 ± 0.5 0.2 ± 0.5 0.251a
HbA1c (%) 164 7.4 ± 0.9 7.3 ± 0.9 7.2 ± 1.0 7.1 ± 0.9 7.1 ± 1.0 <0.001***a
FBG (mg/dl) 23 140.0 ± 30.0 134.0 ± 26.0 135.7 ± 29.1 136.0 ± 32.3 142.2 ± 30.5 0.220a
non HDL-c (mg/dl) 8 134.9 ± 24.2 147.8 ± 32.4 130.0 ± 23.0 130.0 ± 21.0 134.1 ± 20.4 0.261b
TG (mg/dl) 14 144.5 ± 116.8 142.3 ± 114.4 123.6 ± 55.3 125.6 ± 53.7 104.1 ± 40.2 0.736a
Systolic blood pressure (mmHg) 220 135.7 ± 17.6 128.7 ± 14.6 127.7 ± 13.7 128.0 ± 15.3 129.9 ± 14.0 <0.001***a
Diastolic blood pressure (mmHg) 220 75.4 ± 10.7 72.8 ± 9.0 72.3 ± 9.3 72.8 ± 8.9 73.1 ± 8.2 <0.001***a
BMI 216 24.8 ± 4.2 24.6 ± 4.2 24.5 ± 4.2 24.4 ± 4.2 24.3 ± 4.2 <0.001***a
HbA1c: hemoglobin A1c, FBG: fasting blood glucose, SCr: serum creatinine, eGFR: estimated glomerular filtration rate, BUN: blood urea nitrogen, UA: uric acid, Alb: albumin, Hb: hemoglobin, K: potassium, non HDL-c: non high-density lipoprotein cholesterol, TG: triglycerides, UP: urine pro-tein, BMI: body mass index, BL; baseline, 3 M; after 3 months, 6 M; after 6 months, 9 M; after 9 months, 12 M; after 12 months, a: Friedman’s test, b: One-way repeated measures of ANOVA, *p < 0.05, **p < 0.01, ***p < 0.001.
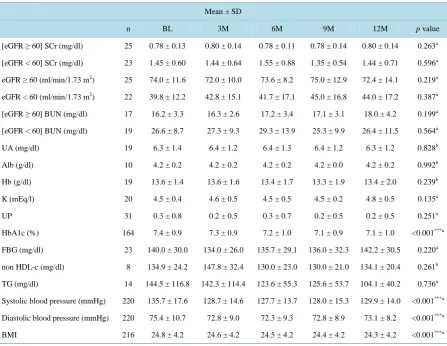
b) 12-month program
In all subjects, the baseline levels of SCr, eGFR, and BUN were maintained at 12 months after the start of in-tervention. In addition, the levels of UA, Alb, Hb, and K remained within the reference ranges and UP showed no changes after intervention.
HbA1c decreased significantly from the baseline level of 7.4% ± 0.9% to 7.1% ± 1.0% after 12 months (p < 0.001), and the number of patients with HbA1c ≥ 7.0% decreased from 108 at baseline to 85 at 12 months. FBG and non HDL-c showed no changes after intervention. Although TG decreased from the baseline level of 144.5 ± 116.8 mg/dl to 104.1 ± 40.2 mg/dl after 6 months, this change was not significant. Systolic blood pressure, di-astolic blood pressure, and BMI decreased significantly after intervention (p < 0.001).
II) CKD program (6-month program)
Since there were only 11 subjects, descriptive statistics are presented in Table 3without further analyses. All of the subjects had an eGFR < 60 ml/min/1.73 m2. Their baseline levels of SCr, eGFR, and BUN were matained after 6 months. In addition, Alb remained within the reference range and non HDL-c improved after in-tervention. TG, blood pressure, and BMI showed no changes after inin-tervention. Because no data were available for UA and UP, analysis could not be performed.
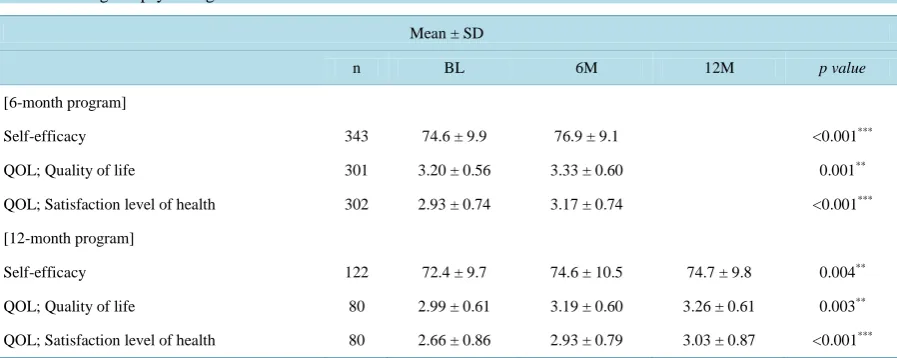
2) Changes of psychological indicators
Table 3. Change of physioligical indicators (program for CKD).
Mean ± SD
n BL 3M 6M
SCr (mg/dl) 7 1.19 ± 0.62 1.22 ± 0.69 1.25 ± 0.82
eGFR (ml/min/1.73 m2) 7 46.6 ± 12.9 46.3 ± 12.7 47.6 ± 15.5
BUN (mg/dl) 5 25.3 ± 13.8 28.5 ± 15.1 29.7 ± 17.7
Alb (g/dl) 1 4.1 3.8 4.0
non HDL-c (mg/dl) 4 162.6 ± 179.2 152.4 ± 167.8 138.8 ± 151.0
TG (mg/dl) 4 91.5 ± 28.2 91.0 ± 23.3 99.8 ± 43.8
Systolic blood pressure (mmHg) 9 125.7 ± 13.8 119.1 ± 9.1 131.2 ± 10.7
Diastolic blood pressure (mmHg) 9 74.7 ± 10.9 71.3 ± 7.0 78.4 ± 11.5
BMI 11 23.7 ± 4.2 23.4 ± 4.2 23.3 ± 4.2
SCr: serum creatinine, eGFR: estimated glomerular filtration rate, BUN: blood urea nitrogen, Alb: albumin,Hb: hemoglobin, K: potassium, non HDL-c: non high-density lipoprotein cholesterol, TG: triglycerides, BMI: body mass index, BL; baseline, 3 M; after 3 months, 6 M; after 6 months.
Table 4.Change of psychological indicators.
Mean ± SD
n BL 6M 12M p value
[6-month program]
Self-efficacy 343 74.6 ± 9.9 76.9 ± 9.1 <0.001***
QOL; Quality of life 301 3.20 ± 0.56 3.33 ± 0.60 0.001**
QOL; Satisfaction level of health 302 2.93 ± 0.74 3.17 ± 0.74 <0.001***
[12-month program]
Self-efficacy 122 72.4 ± 9.7 74.6 ± 10.5 74.7 ± 9.8 0.004**
QOL; Quality of life 80 2.99 ± 0.61 3.19 ± 0.60 3.26 ± 0.61 0.003**
QOL; Satisfaction level of health 80 2.66 ± 0.86 2.93 ± 0.79 3.03 ± 0.87 <0.001***
*
1 QOL score: 0 - 5 points, with a higher score indicating higher QOL, *2 Self-efficacy score: 0 - 92 points, with a higher score indicating greater self-efficacy, BL; baseline, 6M; after 6 months, 12M; after 12 months, Friedman’s test, **p < 0.01, ***p < 0.001.
overall QOL showed a significant increase with both programs (p < 0.01). The score of satisfaction level of health increased significantly after both the 6-month program and the 12-month programs (p < 0.001).
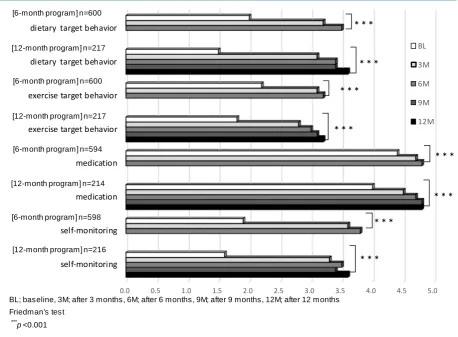
3) Changes of self-management indicators
Changes of self-management indicators are shown in Figure 3. The frequency of performing behavior targets regarding diet and exercise set by the patients in conjunction with the disease management nurses showed a sig-nificant increase with both the 6-month program and the 12-month program (p < 0.001). In addition, the fre-quency of following instructions about medications from the primary care physicians and the frefre-quency of self- monitoring were significantly increased by both programs (p < 0.001).
4) Changes of economic indicators
Figure 3. Change of self-management indicators.
for TIA, 1 for heart failure, and 2 for stent insertion (for cardiovascular disease that developed before the pro-gram). Some patients were hospitalized for orthopedic disease or cataract surgery.
5. Discussion
5.1. Feasibility of the Program
This service framework and program has been developed for the first time in Japan, in which health insurers en-trust a disease management corporation to identify target populations based on data about medical claim and the results of health check-up examinations, after which the corporation approaches the patients and primary physi-cians. The completion rate was 79.3%, which is consistent with previous results [10]-[16]. Most of the dropouts withdrew from the program early because they were too busy or because they had already received education at a hospital, while few patients withdrew during the latter half of the program. Based on this fact, we consider that the program could be improved by flexibly setting the telenursing tools and timing for providing education to suit the patients, as well as by demonstrating the efficacy of the program and increasing collaboration with pri-mary physicians.
5.2. Efficacy of the Program
The rationale of the program is that by changing the behavior of patients and collaboration with primary physi-cians, physiological indicators are maintained or improved and self-efficacy is enhanced, thereby contributing to prevention of disease progression, improvement of QOL, and containment of medical costs. Subjects in the di-abetes program showed improvement of HbA1c and blood pressure after intervention. In patients with diabetic nephropathy, the rate of natural decline in the GFR is reported to be around 2 - 20 ml/min/1.73 m2/year [25]. However, patients with an eGFR ≥ 60 mL/min/1.73 m2 in our diabetes program showed a slow eGFR decline of
BL; baseline, 3M; after 3 months, 6M; after 6 months, 9M; after 9 months, 12M; after 12 months Friedman's test
*** p<0.001
0.0 0.5 1.0 1.5 2.0 2.5 3.0 3.5 4.0 4.5 5.0
self-monitoring self-monitoring medication medication exercise target behavior exercise target behavior dietary target behavior dietary target behavior
BL
3M
6M
9M
12M
*** *** ***
*** *** ***
***
***
[6-month program] n=600
[12-month program] n=217
[6-month program] n=600
[12-month program] n=217
[12-month program] n=216 [6-month program] n=598
[6-month program] n=594
approximately 1.6 - 5.6 ml/min/1.73 m2/year. Furthermore, patients with an eGFR < 60 mL/min/1.73 m2 showed slight improvement of renal function. Therefore, although it was a short-term study, intervention contributed to preventing the decline of renal function. Since there were only 11 subjects in the CKD program, we could not perform statistical analysis. However, these subjects showed no change of renal function and improved self-management behavior. In the future, it may be possible to obtain more meaningful data by increasing the subjects in the CKD program. Regarding economic indicators, although it was a short-term evaluation, some pa-tients could better understand their disease from the education given by the nurses and how to assess their symptoms, which enabled them to notice abnormalities and visit hospital at an early time. Although four sub-jects with diabetes could avoid the acute exacerbation by the early hospitalization. However, during this hospita-lization, their BG might be improved by the control of diet and drugs. Furthermore, one patient each developed TIA and heart failure that required hospitalization, the program generally prevented disease progression and avoided emergency hospitalization. It is still necessary to analyze the effects on medical expenses by comparing medical costs before and after the program, but we considered that the objective of preventing disease progres-sion was largely achieved.
The following reasons for the effects of the program can be suggested.
First, the disease management nurses provided comprehensive care in collaboration with primary physicians. The nurses assessed each subject’s disease, risk factors, physical and mental state, and factors that might hinder appropriate self-management, and clarified the essential problems. Together with the primary physicians, they made changes to factors such as drug schedules according to the severity of the disease, which might have re-sulted in maintenance or improvement of physiological indicators. Wagner also mentioned that specialized nurses are suitable as coordinators to educate patients and collaborate with primary physicians in effective man-agement of chronic diseases [2]. On the other hand, the most common reason for unscheduled visits was infec-tious diseases and some subjects were hospitalized due to heart failure, so we consider that patient education on infection prevention and heart failure management was insufficient. Because infectious diseases can cause wor-sening of the primary disease, it is important to enhance education about infection prevention for disease man-agement nurses in the future, as well as heart failure manman-agement in conjunction with cardiologists.
Second, we performed andragogic teaching and coaching to improve self-efficacy by motivating the subjects (behavioral modification). As a result, subjects could learn for themselves, acquire appropriate self-management behavior, and maintain that behavior. Chronic diseases require long-term medical treatment and are associated with repeated exacerbation and remission, which means that self-efficacy for self-management is sometimes re-duced. Self-efficacy can also improve the ability to solve problems hindering self-management [24], which is another reason why it is essential to improve the self-efficacy of patients with chronic diseases.
Third, all health insurers in Japan have been requested to develop, carry out, and evaluate projects aimed at enhancing the health of their clients since 2014 [26]. They are required to execute plans based on analysis of da-ta including medical expenses and health information, as well as to continuously improve quality, so the need for our program is expected to increase. To expand the use of our program, it is necessary to develop educational tools such as IT terminals and flexible timing of education that responds to the lifestyle of patients.
6. Limitations and Future Challenge
Since this was a program commissioned by health insurers, we could not set a control group, and we could not follow up the health and economic indicators of subjects who did not complete the program. Also, measurement of physiological indicators was left up to the primary physicians, so there were many missing values. Therefore, it is likely that effects of this program would be demonstrated more clearly if we compared patients who com-pleted it with those who did not and collected data for appropriate evaluation indicators based on practice guide-lines in collaboration with the primary physicians. Furthermore, it is necessary to increase the number of sub-jects with CKD and reassess the effect of the program. Also, in order to increase the completion rate, it is im-portant to expand the educational tools and delivery times to takes into account the lifestyle and demands of pa-tients.
7. Conclusion
Subjects in the CKD program (excluding diabetic nephropathy) did not show any change of renal function after intervention and there was improvement of non HDL-c. Subjects acquired the ability to detect and respond to changes of symptoms and data, allowing them to avoid disease progression and emergency hospitalization. This may lead to more appropriate use of medical resources and contribute to containing healthcare costs in the future. The high completion rate of the program demonstrated its feasibility.
Acknowledgements
We would like to express our deepest gratitude to the staff of DPP Ltd. for their support. This program was car-ried out with the sponsorship of health insurers, but analysis was approved by the conflict of interest committee. We made an agreement with the insurers to ensure that analysis was performed appropriately.
References
[1] Lozano, R., Naghavi, M., Foreman, K., et al. (2012) Global and Regional Mortality from 235 Causes of Death for 20 Age Groups in 1990 and 2010: A Systematic Analysis for the Global Burden of Disease Study 2010. Lancet, 380, 2095-2128. http://dx.doi.org/10.1016/S0140-6736(12)61728-0
[2] Wagner, E.H. (2000) The Role of Patient Care Teams in Chronic Disease Management. British Medical Journal, 320, 569-572. http://dx.doi.org/10.1136/bmj.320.7234.569
[3] Bodenheimer, T., Lorig, K., Holman, H. and Grumbach, K. (2002) Patient Self-Management of Chronic Disease in Primary Care. JAMA, 288, 2469-2475. http://dx.doi.org/10.1001/jama.288.19.2469
[4] Barlow, J., Wright, C., Sheasby, J., Turner, A. and Hainsworth, J. (2002) Self-Management Approaches for People with Chronic Conditions: A Review. Patient Education and Counseling, 48, 177-187.
http://dx.doi.org/10.1016/S0738-3991(02)00032-0
[5] Suhrcke, M., Fahey, D.K. and McKee, M. (2008) Economic Aspects of Chronic Disease and Chronic Disease Man-agement. In: Nolte, E. and Mckee, M.B., Eds., Caring for People with Chronic Conditions, Open University Press, England, 43-63.
[6] Tsiachristas, A., Cramm, J.M., Nieboer, A.P. and Rutten-van Mölken, M.P. (2004) Changes in Costs and Effects after the Implementation of Disease Management Programs in the Netherlands: Variability and Determinants. Cost Effec-tiveness and Resource Allocation, 12, 17. http://www.resource-allocation.com/content/12/1/17
http://dx.doi.org/10.1186/1478-7547-12-17
[7] Gustafson, D., Wise, M., Bhattacharya, A., Pulvermacher, A., Shanovich, K., Phillips, B., Lehman, E., Chinchilli, V., Hawkins, R. and Kim, J.S. (2012) The Effects of Combining Web-Based eHealth with Telephone Nurse Case Man-agement for Pediatric Asthma Control: A Randomized Controlled Trial. Journal of Medical Internet Research, 14. http://www.jmir.org/2012/4/e101/
http://dx.doi.org/10.2196/jmir.1964
[8] Ory, M.G., Ahn, S., Jiang, L., Smith, M.L., Ritter, P.L., Whitelaw, N. and Lorig, K. (2013) Successes of a National Study of the Chronic Disease Self-Management Program: Meeting the Triple Aim of Health Care Reform. Medical Care, 51, 992-998. http://dx.doi.org/10.1097/MLR.0b013e3182a95dd1
[9] Ahn, S., Basu, R., Smith, M.L., Jiang, L., Lorig, K., Whitelaw, N. and Ory, M.G. (2013) The Impact of Chronic Dis-ease Self-Management Programs: Healthcare Savings through a Community-Based Intervention. BMC Public Health,
13. http://dx.doi.org/10.1186/1471-2458-13-1141
[10] Kazawa, K. and Moriyama, M. (2013) Effects of a Self-Management Skills-Acquisition Program on Pre-Dialysis Pa-tients with Diabetic Nephropathy. Nephrology Nursing Journal, 40, 141-149.
[11] Kazawa, K. and Moriyama, M. (2012) Effects of the Educational Program for Pre-Dialysis Patients with Diabetic Nephropathy (Intervention Evaluation for 6 Months). The Journal of Japan Academy of Nephrology Nursing, 14, 92- 100. (In Japanese)
[12] Kazawa, K., Takeshita, Y., Yorioka, N. and Moriyama, M. (2014) Efficacy of a Disease Management Program Fo-cused on Acquisition of Self-Management Skills in Pre-Dialysis Patients with Diabetic Nephropathy: 24 Months Fol-low-Up. Journal of Nephrology, 28, 329-338.
[13] Fukuoka, Y., Hosomi, N., Hyakuta, T., Omori, T., Ito, Y., Uemura, J., Kimura, K., Matsumoto, M. and Moriyama, M., DMP Stroke Trial Investigators (2014) Baseline Feature of a Randomized Trial Assessing the Effects of Disease Man-agement Programs for the Prevention of Recurrent Ischemic Stroke. Journal of Stroke and Cerebrovascular Diseases,
24, 610-617. http://dx.doi.org/10.1016/j.jstrokecerebrovasdis.2014.10.007
Skills: Effects of the Trial Implementation. Japan Journal of Nursing Science, 28, 59-68. http://dx.doi.org/10.5630/jans.28.3_59
[15] Otsu, H. and Moriyama, M. (2012) Follow-Up Study for a Disease Management Program for Chronic Heart Failure 24 Months after Program Commencement. Japan Journal of Nursing Science, 9, 136-148.
http://dx.doi.org/10.1111/j.1742-7924.2011.00194.x
[16] Moriyama, M., Takeshita, Y., Haruta, Y., Hattori, N. and Ezenwaka, C.E. (2013) Effects of a 6-Month Nurse-Led Self-Management Program on Comprehensive Pulmonary Rehabilitation for Patients with COPD Receiving Home Oxygen Therapy. Rehabilitation Nursing, 40, 40-51. http://dx.doi.org/10.1002/rnj.119
[17] Funnell, M.M., Brown, T.L., Childs, B.P., Haas, L.B., Hosey, G.M., Jensen, B., Maryniuk, M., Peyrot, M., Piette, J.D., Reader, D., Siminerio, L.M., Weinger, K.E. and Weiss, M.A. (2007) National Standards for Diabetes Self-Management Education. Diabetes Care, 30, 1630-1637. http://dx.doi.org/10.2337/dc07-9923
[18] Nakano, M., Moriyama, M. and Nishiyama, M. (2003) Structured Review of the Literature of Type 2 Diabetes Self-Management: Toward the Development of a Patients’ Characteristics-Based Assessment Tool. Journal of Health Sciences, 3, 1-12. (In Japanese)
[19] Population Health Alliance. Disease Management.
http://www.populationhealthalliance.org/research/phm-glossary/d.html
[20] Bandura, A. (1977) Self-Efficacy: Toward a Unifying Theory of Behavioral Change. Psychological Review, 84, 191- 215. http://dx.doi.org/10.1037/0033-295X.84.2.191
[21] Prochaska, J.O. and Velicer, W.F. (1997) The Transtheoretical Model of Health Behavior Change. American Journal of Health Promotion, 12, 38-48. http://dx.doi.org/10.4278/0890-1171-12.1.38
[22] Japanese Society of Nephrology (2013) Evidence-Based Practice Guideline for the Treatment of CKD. Tokyo Igaku-sha, Tokyo. (In Japanese)
[23] Kim, W.S., Shimada, H. and Sakano, Y. (1996) The Relationship between Self-Efficacy on Health Behavior and Stress Responses in Chronic Disease Patients. Japanese Journal of Psychosomatic Medicine, 36, 499-505. (In Japanese) [24] Tazaki, M. and Nakane, Y. (2007) Introduction to WHOQOL26. Revised Edition, Kaneko Shobo, Tokyo. (In
Japa-nese)
[25] American Diabetes Association (2003) Diabetic Nephropathy. Diabetes Care, 26, 94-98. http://dx.doi.org/10.2337/diacare.26.2007.S94