Munich Personal RePEc Archive
Modeling ASEAN Global Linkages
Lord, Montague J.
ADB, Asian Development Bank
August 1999
Online at
https://mpra.ub.uni-muenchen.de/41173/
Modeling ASEAN Global Linkages
Prepared for
Asian Development Bank
Submitted by
Montague J. Lord
Table of Contents
Executive Summary ... v
I. ASEAN Global Economic Linkages ... 1
II. The Global Framework of ASEAN ... 5
III. International Transmission of Income Changes ... 9
IV. Transmission Effects of Bilateral Exchange Rate Differentials ... 14
V. Modeling International Transmission Effects... 20
VI. Conclusions... 31
Technical Appendix ... 34
Tables
1.1 ASEAN-5 Real GDP: Trend Growth Rates and Average Annual Deviations ... 1
2.1 Changing Exposure of ASEAN-5 Economies to Global Economy... 6
3.1 ASEAN-5 Distribution of Trade, 1998 ... 9
3.2 Regression Results of ASEAN-5 GDP Relationships to Foreign Income... 11
3.3 Foreign Income Elasticities ... 12
4.1 Nominal Exchange Rate Indices, 1980-98... 15
4.2 ASEAN-5 Real Effective Exchange Rates (REER) by Region, 1970-98 ... 16
4.3 Capital Inflows by Type, 1985-97 ... 18
5.1 Regression Results of Yen/US Dollar Exchange Rate Transmissions ... 21
5.2 Foreign Income and Exchange Rate Elasticities... 22
5.3 Regression Results of ASEAN-5 GDP Relationships to Foreign Income, International Financial Indicators and World Trade ... 23
5.4 Foreign Income, Financial Indicator and World Trade Elasticities ... 24
5.5 Regression Results of ASEAN-5 GDP Relationships to Balance of Payments and Other External Sector Indicators... 29
5.6 Balance of Payments and Other Indicator Elasticities... 30
A.1 Descriptive Statistics for Real GDP of ASEAN-5 and Global Regions... 35
Figures
1.1 Real GDP of ASEAN-5 ... 21.2 ASEAN-5 Annual Percentage Change of Real GDP... 3
1.3 GDP Growth Rate of ASEAN-5 and Other Global Regions ... 4
2.1 Globalization Trends, 1991-97 ... 7
4.1 ASEAN-5 Trade of Goods and Services and Real Effective Exchange Rate... 14
Acronyms
ADF Augmented Dickey-Fuller (test)
ASEAN Association of Southeast Asian countries
DF Dickey-Fuller (test)
ECM Equilibrium correction mechanism
EU European Union
FDI Foreign direct investment
GDP Gross domestic product
GNP Gross national product
MUV Manufactured unit value (index)
PRC Peoples Republic of China
QR Quantitative restriction
REER Real effective exchange rate
Executive Summary
This study examines the global linkages of selected ASEAN countries composed of Indonesia, Malaysia, Philippines, Singapore and Thailand (hereafter ASEAN-5). While economic growth of each country undoubtedly hinges on domestic developments, it also depends on foreign trade and capital movements in the form of direct and portfolio investments. These external influences are largely driven by global developments, particularly in Japan, other Northeast Asian countries, the United States, the European Union, and within the ASEAN region. While the systematic determinants of the
ASEAN-5 countries’ linkages to these regions are relatively stable and robust, our focus is on the
short-term dynamics underlying the transmission of income, price and other changes from the global economy.
ASEAN-5 Growth and the Global Context
For purposes of framing the analysis, we examine three widely recognized explanations of economic growth in Southeast Asia. The first focuses on supply growth in the region to explain the ‘Asian Miracle’ associated with capital accumulation, the absorption or assimilation of increasingly modern technology and the change in industrial structures. A closely related but more recent explanation is the fundamentalist view that structural factors have explained, first, the long-term growth of the Southeast Asian economies until mid-1997 and, second, the crisis in late 1997 and 1998. During the stellar years of the
‘miracle’ economies the dominant factors producing an outward-oriented, export-led growth were high domestic savings, human capital development, sound macro management and limited price distortions combined with careful policy interventions. During the 1997-98 crisis structural factors also dominated events, but this time in the form of weak financial systems that were undermined by large capital flows and exchange rate misalignments associated with the widespread use of relatively fixed exchange rate regimes. An alternative interpretation is that cyclical variations in the real dollar-yen rate created the misalignment and effected large changes in the pattern of trade and direct and portfolio investments throughout the Southeast Asian countries.
growing openness of the Southeast Asian economies until 1996 deepened the close link between economic growth and the rapidly changing global economy, but more recently they have made the ASEAN-5 economies susceptible to especially large changes in the trade and cross-border production activities.
The focus of this study is on demand-led growth in the ASEAN-5 economies in the context of the global economy. In examining linkages between the ASEAN-5 and the global economy, our focus is on the short-term or year-to-year impact of the global economy through real effective exchange rates, trade balances, international capital flows and changes in the structure of production, trade and investment in the ASEAN-5 economies. Notwithstanding the pervasive influence of the 1997-98 crisis on short-term
movements in the near term, today’s global linkages are rooted in behavioral
relationships that have developed since the 1970s and 1980s. Our interest is therefore to identify and quantitatively represent the essential features that underlie the international transmission of income, prices and other factors, as distinct from an attempt to describe the complete ASEAN system of economic growth. As such, the set of causal relationships is parsimonious and does not explicitly consider the determinants of either supply growth or structural factors.
Modeling International Income Transmissions
Our estimates of the international transmission of income and other changes on the ASEAN-5 countries separate the long-run or equilibrium relationships between domestic income and foreign income, prices and other variables from the short-run or dynamic disequilibrium components of those relationships. We examine global linkages of the ASEAN-5 using an Equilibrium Correction Mechanism (ECM) specification that provides the means by which the short-run observed behavior of variables is associated with their long-run equilibrium growth paths. The ECM adjusts for any disequilibrium between variables that are cointegrated. As a result, it provides the means by which the short-run observed behavior of variables is associated with their long-run equilibrium
growth paths. A closely related specification known as the “error-correcting mechanism” (also having the acronym ECM) models both the short and long-run relationships between variables.
those for individual regional estimates. These aggregated relationships are therefore used to estimate the international transmission of exchange rates and other influences on the ASEAN-5 countries.
Exchange Rates and Other International Transmissions
In additional to foreign income effects, we examine the effects of the following variables on ASEAN-5 economic activity: (a) exchange rates in the form of either the overall real effective exchange rate of the ASEAN-5 countries, bilateral real effective exchange rates with the major global regions, or the real yen/dollar exchange rate; (b) international pricesin the form of either the terms of trade of the ASEAN-5 or world market prices for primary commodities relative to those of manufactures; (c) )interest ratesin the form of interest rate differentials either between those in Japan and those in the United States, those for ASEAN-5 lending and those for Japanese borrowing, or those for ASEAN-5 lending and those for borrowing in the Eurodollar market; (d) investment risks on portfolio and direct investments in the form of either real exchange rate fluctuations or more generally imbalances in the balance of payments that reflect the risk of real exchange rate changes and/or capital controls; (e)world trade and capital inflows in the form of world trade volumes, current account balances, the ratio of exports to GDP, and the importance of portfolio and direct investments to the economy; and (f) intra-ASEAN linkages in the form of the bilateral real effective exchange rate (REER) with other ASEAN-5 countries, the aggregate current account deficit of the ASEAN-5, and the
region’s reserve losses. In all cases, empirical measurement has been based on individual ASEAN-5 country estimates.
Exchange Rate Effects - The motivation for including real effective exchange rates in the relationship for the global linkages of the ASEAN-5 countries is well developed. During the period of rapid economic expansion in the 1980 and until 1996 a high premium was placed on keeping stable exchange rates and moderate to low inflation. In the subsequent crisis years, the exchange rate misalignments that emerged in the mid-1980s are believed to have created the framework for the worsening of domestic economic fundamentals a decade later. In analyzing these effects, past research has usually relied on measures of REER changes of the Southeast Asian economies with all their partner countries. In addition to this measure, we also test the bilateral real effective exchange rates of each ASEAN-5 country with the major global region of Japan, other Northeast Asian countries, the United States, the European Union and other ASEAN-5 countries.
We find real yen/dollar exchange rate movements to be significant in explaining real GDP changes in the ASEAN-5 countries. On average, the short-term elasticity of income with respect to the real yen/dollar exchange rate is equal to 0.05, while the average long-term elasticity is 0.8. All the coefficients had the expected positive sign suggesting that output in the ASEAN-5 economies is positively related to the yen/dollar exchange rate. The explanation for these findings is that when the yen has risen against the dollar, the export competitiveness of the dollar-pegged Asian economies has improved in the Japanese market and production costs have became more attractive to Japanese investors. Alternatively, when the yen has weakened (for example, as it did between mid-1995 and mid-1997) Japanese export demand and FDI outflows have contracted and economic growth in the Southeast Asian economies has fallen.
The REERs of the ASEAN-5 countries are statistically significant in explaining income changes of Indonesia, Malaysia and the Philippines. However, only in the case of Malaysia is the REER significant in the long run. These findings are not surprising since reduced form estimates that relate real GDP of countries to their REER are often unable to capture the transmission effects of this variable through the demand for exports and imports and direct and portfolio investments. Instead it is usually necessary to estimate structural equations relating each of the national income components (for example, export demand) to the REER and then estimating the individual effects on aggregate income.
International Price and Trade Volume Effects - In addition to real exchange rate changes, movements in world market prices for traded commodities and manufactures have impacted on the foreign demand for ASEAN-5 exports and domestic demand for imports. Moreover, international prices have had an indirect effect on ASEAN-5 growth through their impact on export-oriented FDI activities. We initially attempt to use two alternative measures of relative prices: the terms of trade of each economy, and world market prices for primary commodities relative to those of manufactures. Data for the terms of trade of most ASEAN-5 countries, however, are not available for the more recent years and these series were therefore not included in the final estimates. The alternative series on world commodity prices is more readily available. To approximate a terms of trade measure for individual countries, we derive a global terms of trade estimate based on the ratio of the index of commodity prices to that of prices for manufactures.
As expected, world trade volumes and world commodity market prices relative to those of manufactures are found to be significant in explaining changes in the ASEAN-5
volume effects, but that movements in trade volumes tend to have a relatively larger impact on ASEAN-5 GDP than do price variations.
Differential Interest Rate Effects - Interest rate differentials tend to affect movements in equity and debt securities on capital markets more than they do FDI movements, and therefore are likely to have a large influence on portfolio investments in the ASEAN-5. In addition, it is generally acknowledged that interest rate differentials resulting from the long-term upward movement in the nominal dollar value of the yen drove nominal interest rates on yen-denominated assets below those prevailing on dollar-denominated assets. That change led banks in East Asia to undertake foreign currency indebtedness by accepting cheap yen deposits without covering their foreign exchange risk.
To measure the effect that these interest rate disparities have had on the ASEAN-5 economies, we use the ratio of the nominal lending rates in each ASEAN-5 country to both the Japanese yen LIBOR three-month rate and US dollar LIBOR rate. However, the results do not support the use of this variable in explaining economic activity, except in the case of the Philippines, where the ratio of the Japanese yen LIBOR three-month rate to the US dollar LIBOR rate is statistically significant in explaining changes in real GDP. The reason for the general lack of significance of this variable in other countries may be the relatively short time period over which it influenced the Southeast Asian economies, compared with the fairly long time series (beginning in 1970) used for the equation estimates.
Investment Risk Effects -The main sources of risk for investors are interest rates, stock market returns, and contagion effects. Changes in interest rates can have large consequences on the macroeconomic performance and creditworthiness of developing countries, and more so through changes in portfolio investments than FDI. If investments in emerging markets are used only to increase portfolio returns when investments in industrial countries are under-performing, then the investments will be very sensitive to
changes in industrial countries’ interest rates. In the case of the Asian financial crisis, however, it was the lack of confidence in the asset market that led to panic liquidation in all the Southeast Asian stock markets. The liquidation, in turn, instigated large movements of funds offshore that reversed capital flows and drained official reserves. The resulting downward pressure on exchange rates was essentially domestically induced, although there were spillovers that gave rise to contagion and the pervasiveness of the Asian financial crisis. To test the effect of investment risk, we measure the risk premium on foreign loans made by financial intermediaries in the ASEAN-5 countries using the uncovered interest parity relationship. Using this measure we find the effect of risk premium on economic growth of the ASEAN-5 countries to generally be statistically significant. The average risk premium elasticity is–0.04 in the short run and it rises to– 0.23 in the long run.
Cooper, Corden and Rajapatirana (1993) to the ASEAN-5 economies with some minor adaptations to ensure readily available time-series data. These indicators consist of the following variables: (a) foreign market GDP; (b) exports of goods and services as a percent of domestic GDP; (c) global terms of trade; (d) volume of world trade; and (e) FDI inflows as a percentage of domestic GDP.
The results generally support the use of these indicators in explaining income changes in the ASEAN-5 countries. The limitation of this approach, however, is the relatively long delay in the publication of information for the selected indicators compared with the more up-to-date information available for exchange rates, international prices and interest rates. These delays are important when data are used either to explain recent developments or to generate short-term forecasts. Nevertheless, the robustness of the estimates makes the approach useful in explaining movements in ASEAN-5 economic activity. Both exports and FDI changes are found to be significant in explaining real GDP changes. The export/GDP elasticities of the ASEAN-5 countries average 0.04 in the short run and then increase to 0.6 in the long run. Similarly, the short-term FDI/GDP elasticities average 0.03 in the short run and then increase to 0.2 in the long run. Only in the case of the Philippines are these variables not statistically significant. Instead movements in the global terms of trade and world trade volumes are found to be important in explaining GDP changes of that country.
We recommend extending the analysis of ASEAN global linkages in two areas. The first is the measurement of economic policy effects on growth. Balance of payments policies using trade policy instruments and capital controls have been found to play an important role in the macroeconomic histories of Southeast Asia and other developing regions. Financial policies are also likely to influence capital movements during tightening or liberalization episodes. Quantification of these policy effects would help to identify their impact on ASEAN economic activity. Similar econometric techniques could also be used to examine whether exchange rate policy differences among ASEAN countries explain divergent economic growth rates among these countries despite other similarities.
I. ASEAN Global Economic Linkages
The link between the performance of the Association of Southeast Asian Countries (ASEAN) countries and global economic activity is central to the recovery of these countries. While the growth prospects of each country will undoubtedly build on expansionary domestic policies, they will also hinge on the recovery of exports and the return of foreign capital in the form of portfolio investment and foreign direct investment. These external conditions will be largely driven by global development, particularly in Japan, other Northeast Asian countries, the United States, the European Union, and within ASEAN. While the magnitude of these effects on the ASEAN countries can be broadly measured by the transmission of foreign income changes on domestic economic activity of those countries, there is no presumption about the direction and causality of those changes. Though the financial crisis in the Asian economies did not become a global crisis, it did slow the growth of the global economy by one-half of that it would otherwise have achieved.
The study is composed of the following parts: this section provides an introduction by examining the trend growth rates and year-to-year changes in the economic activity of the ASEAN-5 countries and the global regions. Section II reviews the literature on factors affecting the past performance of the ASEAN-5, particularly as they relate to the global economy, and it sets forth the main framework for analyzing the global determinants of economic growth in the ASEAN-5 (comprised of Indonesia, Malaysia, Philippines, Singapore and Thailand). Sections III and IV examine the international transmission of changes in income, exchange rates and other important determinants of ASEAN-5 economic growth, and present the empirical findings on the international transmission of income changes. Section V describes the other variables used in modeling the linkages and sets forth the empirical results. Section VI presents the conclusions. Details of the modeling methodology are laid out in the Technical Appendix.
The recent volatility of economic activity in the ASEAN countries makes the prediction of short-term activity a challenging one. While the systematic determinants of global linkages are relatively stable and robust, we are also interested in capturing the dynamics underlying rapidly changing variables to provide a relatively good explanation of recent developments and future short-term changes likely to affect these economies. To begin with, it is useful to see what phenomena have occurred in the ASEAN economies and what merits explanation from
a global perspective. Table 1.1 and Figure 1.1 show the dramatic long-term expansion of the ASEAN-5 in the last quarter century. Average annual growth during this period averaged nearly 6 percent for the combined real gross domestic product (GDP) of these
Table 1.1
ASEAN-5 Real GDP: Trend Growth Rates and Average Annual Deviations
Average Deviation 1/ Trend
Growth 1970-97 1970-98
Singapore 7.5 3.3 3.3
Indonesia 6.1 4.0 4.4
Malaysia 6.5 4.4 4.4
Thailand 7.2 4.0 4.4
Philippines 3.0 7.0 6.9
Asean-5 6.0 3.5 3.7
countries, and ranged from 3.6 percent a year for the Philippines to 8 percent a year for Singapore.
The long-term positive trends make it difficult to distinguish short-term variations, so the year-to-year percentage changes in real GDP are shown in Figure 1.2. Despite the sharp movements in the series of Thailand, Singapore and Malaysia during the mid-1980s, and again in those of Indonesia and Thailand in 1998, year-to-year deviations over the entire period reveal a substantially different pattern from those limited to the mid-1980s. Singapore, which has experienced the highest growth rate, had the lowest deviation from that trend; in contrast, the Philippines, with the lowest growth rate, had the highest deviation from its trend. Indonesia and Thailand had similar short-term variations from their growth trend, although those of Thailand have occurred around a higher trend
[image:13.612.91.514.273.715.2]growth rate. In fact, Indonesia’s short-term variations are similar to those of Malaysia after adjustment have been made for the trend growth rates, while Thailand has had relatively smaller deviations relative to its higher trend growth rate. These patterns hold,
Figure 1.1
Real GDP of ASEAN-5 (1990 = 100)
0 50 100 150 200
1970 1974 1978 1982 1986 1990 1994 1998
Indonesia Malaysia ASEAN-5
0 50 100 150 200
1970 1974 1978 1982 1986 1990 1994 1998
whether or not observations for 1998 are included in the calculations.
[image:14.612.94.536.105.545.2]By way of comparison, annual percentage changes in the combined real GDP of the ASEAN-5 are plotted against those of the major global regions of Japan, the United States, and the European Union. Figure 1.3 shows that the series tend to be synchronous, although the rates of change of GDP in the ASEAN-5 tend to be more volatile that those of the major global regions. In general, changes in real GDP of the global regions tend to lead economic growth in the ASEAN-5, but generally grow at a slower rate. Thus, the data suggest a convergence of economic activity at the aggregate level between the ASEAN-5 and those global regions. These patterns require the careful interpretation of the various linkages between the ASEAN-5 and the major global regions in both their
Figure 1.2
ASEAN-5 Annual Percentage Change of Real GDP
-15 -10 -5 0 5 10 15
1970 1974 1978 1982 1986 1990 1994 1998
Indonesia Malaysia ASEAN-5
-15 -10 -5 0 5 10 15
1970 1974 1978 1982 1986 1990 1994 1998
long-term trends and short-term movements. The next section discusses the conceptual framework for modeling those linkages.
Figure 1.3
GDP Growth Rate of ASEAN-5 and Other Global Regions
-10 -5 0 5 10 15
1970 1974 1978 1982 1986 1990 1994 1998
ASEAN-5 Japan
-10 -5 0 5 10 15
1970 1974 1978 1982 1986 1990 1994 1998
II. The Global Framework of ASEAN
For purposes of framing the present analysis, we can distinguish three widely recognized explanations of economic growth in Southeast Asia. The first focuses on supply growth in the region to explain the ‘Asian Miracle’ associated with capital accumulation, the absorption or assimilation of increasingly modern technology and the change in industrial structures (Kim and Lau, 1994; Stiglitz, 1996; World Bank, 1993; Young, 1995). Whether driven by capital accumulation or by its productive assimilation, the growth process was accompanied by major changes in the structure of the Southeast Asian economies (Nelson and Pack, 1999). Notwithstanding the severe economic and financial crisis that hit all the countries in late 1997 and 1998, the view holds that the factors determining supply growth are largely in tact and will undoubtedly continue to influence the region under a favorable policy environment.
A closely related but more recent explanation is the fundamentalist view that structural factors have explained, first, the long-term growth of the Southeast Asian economies until mid-1997 and, second, the crisis in late 1997 and 1998. During the stellar years of the ‘miracle’ economies the dominant factors producing an outward-oriented, export-led growth were high domestic savings, human capital development, sound macro management and limited price distortions combined with careful policy interventions. During the 1997-98 crisis, structural factors also dominated events, but this time in the form of weak financial systems that were undermined by large capital flows and exchange rate misalignments. One explanation of these misalignments is the widespread use of relatively fixed exchange rate regimes. These regimes eventually needed to be reversed through the process of nominal and real deprecations of currencies that took place beginning in the latter part of 1997 (Krugman, 1998), Goldstein (1998), and Corsetti, Pesenti, and Roubini (1998).1 An alternative explanation is that the cyclical variations in the real dollar-yen rate created the misalignment and impacted on trade, investment and capital flows of the Southeast Asian countries, rather than exchange rate mismanagement on the part of these countries (McKinnon, 1999, and Ohno, 1999). Dollar-yen rate variations are believed to have affected the region’s international competitiveness, FDI flows, and short-term foreign currency indebtedness well before the crisis, and to have had a pervasive influence on the pattern of trade and investment in throughout the region.
1
The third explanation of economic growth in Southeast Asia focuses on the rapid assimilation of the region in the global economy. While recognizing that industrial growth and transformation have been the driving force behind the economic growth of Southeast Asia, the handmaiden of that expansion has been the large growth of international trade and direct and portfolio investment generated by the rapid expansion of global production and markets. For the ASEAN-5 countries the systemic changes in the world economy have generated large volumes of international capital flows and transactions in goods and services, as well as generating a widespread diffusion of production, transportation, and communication technologies from corporate contracting arrangements. The introduction of new technologies through cross-border production networks and the dissemination of new skills in the workforce have now become as important to the specialization of production activities in the Asian economies as their capital, labor and natural resource endowments.
This new globalization process emphasizes demand-led growth and the policy environment as a critical determinant of that growth. Until roughly the mid-1980s many of the region's countries relied on exports as the main engine for economic growth, which implied a liberalization of trade and an emphasis on the facilitating role of the government. The shift from an export-driven growth strategy by many Asian countries to a growth strategy targeting global production and market networks was largely driven by efforts to exploit the worldwide growth of cross-border production and international capital movements. While the earlier outward-oriented strategy promoted economic growth in a number of Asian economies through the introduction of high value-added products into their economies, the new strategy has targeted the broad-based transmission of domestic learning and knowledge accumulation as a means of sustaining high economic growth rates.
Although all of the Southeast Asian economies initially embarked on import-substituting industrialization, over time they shifted to export-oriented industrialization policies, starting with Singapore in the late 1960s, followed by Malaysia, the Philippines, and
Table 2.1
Changing Exposure of ASEAN-5 Economies to Global Economy (Percentage)
Indonesia Malaysia Philippines Singapore Thailand
Trade Exposure a/
1970-74 32.6 77.5 39.0 43.1 42.1 1975-79 37.8 90.3 45.6 61.3 47.8 1980-84 46.6 109.8 49.6 83.5 50.3 1985-89 44.4 117.7 52.2 78.1 59.1 1990-94 53.1 162.7 66.3 120.9 78.6 1995-97 53.0 183.0 84.8 148.0 85.8 Capital Exposure b/
1970-74 n.a. 5.7 n.a. 8.8 n.a. 1975-79 n.a. 4.0 0.6 6.1 0.6 1980-84 n.a. 6.6 0.6 10.0 1.0 1985-89 n.a. 3.4 1.2 11.5 2.4 1990-94 1.8 6.2 2.2 11.8 3.2 1995-97 3.2 4.9 4.7 10.9 4.2
Thailand in the 1970s, and finally Indonesia in the mid-1980s. Export-oriented industrialization led to an opening of the economies to more markets, and the promotion of foreign direct investment (FDI) as a means of upgrading the industrial structures through the transfer and diffusion of advanced industrial technologies. As a result, the exposure of the economies to foreign trade and capital has grown dramatically in the last quarter century, although it has been most pronounced in Malaysia and Singapore (Table 2.1).
Over the long run, the growing
openness of the Southeast Asian
economies until 1996 deepened the close link of economic growth to the rapidly changing global economy, and produced rapid advances in all areas of globalization covering trade, cross-border investments and international financial activities. But more recently
they have made the ASEAN-5
economies susceptible to the especially large changes in the trade and cross-border production activities (Figure 2.1). Year-to-year variations around the 15 percent annual growth rate of international production equaled ±9 percent, while those around the 6 to 7 percent trend growth rates of net international bank lending and world trade equaled ±3 and ±5 percent respectively.
The focus of this study is on demand-led growth in the ASEAN-5 economies in the context of the global economy. In examining linkages between the ASEAN-5 and the global economy, our focus is on the short-term or year-to-year impact of the global economy on real effective exchange rates, trade balances, international capital flows and changes in the structure of production, trade and investment in the ASEAN-5 economies. Notwithstanding the pervasive influence of the 1997-98 crisis on short-term movements in the near term, today’s global linkages are rooted in behavioral relationships that have developed since the 1970s and 1980s. Our interest is therefore to identify and quantitatively represent the essential features that underlie the international transmission of economic activity, as distinct from an attempt to describe the complete ASEAN system of economic growth. As such, the set of causal relationships is parsimonious and does not explicitly consider the determinants of either supply growth or structural factors.
In the next section we quantify the impact of the international transmission of income changes on the economic growth of the ASEAN-5 countries and examine the major determinants of the international transmission process. The empirical investigation economic follows the conventional approach to modeling the transmission of changes in economic activity between countries. The magnitude of these transmissions to the ASEAN-5 can be broadly measured by the impact that foreign income changes have on the domestic economic activity of those countries. The transmission of foreign income changes is complex and when those changes are sufficiently widespread they can also affect market prices of traded products by the ASEAN-5, as well as FDI inflows that are either directed toward international markets or rely on foreign inputs.
Figure 2.1
Globalization Trends, 1991-97 (Annual percent change)
0% 10% 20% 30% 40%
1991 1993 1995 1997
III. International Transmission of Income Changes
The major regional global linkages of the ASEAN-5 countries are fairly evenly distributed among Japan, the United States, the European Union, other Northeast Asia, other ASEAN-5, and the rest-of-the-world. These linkages reflect trade, as shown in Table 3.1. Capital flows are more concentrated in the industrialized countries, especially
Japan. For example, according to IMF (1998) data, Thailand’s FDI inflows in 1997 were
mainly from Japan (36 percent of the total), the United States (18 percent) and the European Union (11 percent). The composition of these linkages, however, has changed considerably in the last two decades. In trade Japan accounted for nearly one-fourth of ASEAN-5 combined exports and imports in 1980, compared with 17 percent in 1997 and 14 percent in 1998. The declining importance of Japan has been reflected in trade of all countries, other than Singapore, but none more than Indonesia, which lowered its share from 48 to 17 percent between 1980 and 1998. In contrast, all countries in the region have increased their trade shares with other Northeast Asian countries and other
ASEAN-5 countries. Overall trade shares with the United States and the European Union have remained nearly unchanged. Since estimates of global regional linkages require fairly long time series, calculations will more closely reflect the weights of the regions at the mid-point of the time series than the current ones.
Our estimates of the international transmission of income and other changes on the ASEAN-5 countries separate the long-run or equilibrium relationships between domestic income and foreign income, prices and other variables from the short-run or dynamic disequilibrium components of those relationships. We examine global linkages of the ASEAN-5 using an Equilibrium Correction Mechanism (ECM) specification that provides the means by which the short-run observed behavior of variables is associated with their long-run equilibrium growth paths. The ECM adjusts for any disequilibrium between variables that are cointegrated. As a result, it provides the means by which the short-run observed behavior of variables is associated with their long-run equilibrium
growth paths. A closely related specification known as the “error-correcting mechanism”
Table 3.1
ASEAN-5 Distribution of Trade, 1998 (Percentages)
Exports+Imports to:
Intra-ASEAN5 Japan
Other NE Asia a/
United States
European
Union Other Total by: Indonesia 18% 17% 14% 13% 16% 22% 100% Malaysia 28% 13% 11% 18% 13% 18% 100% Philippines 13% 16% 12% 25% 12% 22% 100% Singapore 23% 11% 13% 18% 14% 21% 100% Thailand 16% 17% 10% 17% 16% 24% 100%
ASEAN-5 21% 14% 12% 18% 14% 21% 100%
(also having the acronym ECM) models both the short and long-run relationships between variables.
To illustrate the adjustment process of these transmissions, we can estimate the simple relationship of real GDP growth of all ASEAN-5 countries to changes in real GDP growth in all the global regional economies (Japan plus US plus EU). Let the variable Y
represent the real GDP growth of the ASEAN-5 and Zrepresent the real GDP growth of the global regional economies. The resulting estimate of the ECM relationship between these two variables for 1971-98 is as follows (see the Technical Appendix for a description of the ECM):
yt= -1.77–0.11(y–z)t-1+ 0.51zt+ 0.14zt-1 (3.1)
(2.4) (2.7) (2.4)
R2= 0.83 dw = 1.3 SE = 0.014
where lower-case letters denote the logarithms of the corresponding capitals, the t-statistics are shown in parentheses, R2 is the corrected squared multiple correlation coefficient, dw is the Durbin-Watson statistic, and SE is the standard deviation of the residuals. Despite the statistical significance of the z variable, the equation failed to predict the changes in income in 1985 and 1998. It seriously overestimated real GDP of the ASEAN-5 in 1985 and 1998, and hence binary variables were used to account for the effects of other variables in those two years. Notwithstanding these limitations, the short and long-run dynamic properties of the estimated relationship in the ECM can be examined.
The estimated equation yields a short-term elasticity of 0.51 long-run elasticity of 2.27 (= 1 + 0.14/0.11) with respect to real GDP of the global regional economies. The growth rate of the selected global regional economies is given byz, whose steady-state path can be denoted g. A constant growth rate ofg =z, yields the long-run dynamic relationship:
Y = kZ2.27 (3.2)
where k = exp{[-1.77/-0.11] + [-0.11-.51x(-0.11)-0.14)/-0.112]g = exp(16.09 - 16.02)g. Since g = 2.8 percent was the average growth rate of real GDP in the global regional economies during the period 1971-98, then k = 0.03 and the ratio of real GDP of the ASEAN-5 to that of the selected global regional economies equals 1.68 percent, which approximates the average ratio in 1971-98. The ASEAN-5’s real GDP growth is therefore shown to be influenced by changes in both the level and rate of growth of real GDP in the global regional economies.
Table 3.2
Regression Results of ASEAN-5 GDP Relationships to Foreign Income
yt=o+1(y–z)t-1+2zt+3z-1+ vt
Summary Statistics ASEAN-5 Global Region ln(Y/Z)t-1 ln(Z)t lnZt-1 Const R2 dw SE dof
Indonesia Japan -0.21 (2.1)
0.84 (2.4)
0.14 (1.9)
-1.95 0.41 1.22 0.04 24 United States a/ -0.05
(0.8)
0.29 (1.3)
0.05 (0.6)
-1.03) 0.80 1.14 0.02 23 European Union -0.34
(2.3)
0.32 (0.6)
0.49 (2.0)
-5.91 0.26 1.21 0.04 24 World a/,b/ -0.08
(1.4)
0.28 (1.1)
0.10 (1.3)
-1.42 0.84 1.26 0.02 23 Malaysia Japan -0.14
(1.8)
0.60 (1.9)
0.12 (1.8)
1.58 0.30 1.42 0.03 24 United States -0.05
(0.5)
0.32 (0.8)
0.03 (0.2)
-0.47 0.10 1.34 0.04 24 European Union -0.21
(2.1)
0.77 (1.6)
0.37 (2.0)
-4.27 0.24 1.26 0.04 24 World a/,c/,d/ -0.05
(1.0)
0.79 (3.7)
0.09 (1.4)
-1.13 0.82 2.3 0.02 22 Philippines Japan -0.14
(1.7)
0.17 (0.5)
-0.05 (1.8)
-0.13 0.21 0.87 0.04 24 United States -0.17
(2.2)
0.14 (0.5)
-0.03 (0.9)
-0.53 0.24 0.98 0.04 24 European Union -0.18
(2.0)
0.37 (0.7)
0.01 (0.2)
-0.92 0.26 0.90 0.04 24 World e/,f/,g/ -0.14
(1.3)
0.25 (0.4)
-0.04 (1.1)
-0.35 0.51 1.58 0.03 18 Thailand Japan -0.18
(2.8)
0.89 (3.2)
0.20 (3.0)
-2.27 0.46 0.68 0.03 24 United States -0.07
(0.8)
0.24 (0.6)
0.09 (0.6)
-1.09 0.09 1.60 0.04 24 European Union -0.19
(1.9)
0.51 (1.0)
0.39 (1.8)
-4.27 0.16 0.63 0.04 24 World h/ -0.15
(1.6)
0.58 (1.2)
0.25 (1.6)
-3.23 0.10 0.88 0.04 24 Singapore Japan -0.08
(1.1)
0.46 (1.7)
0.08 (0.9)
-0.92 0.22 1.16 0.03 24 United States -0.06
(0.7)
0.01 (0.1)
0.08 (0.5)
-0.90 0.09 1.19 0.03 24 European Union -0.15
(1.7)
0.68 (1.6)
0.30 (1.5)
-3.31 0.21 1.15 0.03 24 World a/,c/,i/ -0.03
(0.5)
0.43 (0.9)
0.05 (0.4)
-0.66 0.55 1.88 0.02 13
Notations (lower-case letters denote logarithms of upper-case letters): Y = Domestic GDP
Z = Foreign GDP
a/ Includes a binary variable for 1998 (1 in 1998; 0 otherwise). b/ Includes a binary variable for 1982 (1 in 1982; 0 otherwise). c/ Includes a binary variable for 1985 (1 in 1985; 0 otherwise). d/ Includes a binary variable for 1986 (1 in 1986; 0 otherwise). e/ Includes a binary variable for 1984 (1 in 1984; 0 otherwise). f/ Includes a binary variable for 1991 (1 in 1991; 0 otherwise). g/ Includes a binary variable for 1992 (1 in 1992; 0 otherwise). h/ Includes a binary variable for 1997 (1 in 1987; 0 otherwise). i/ Includes a binary variable for 1993 (1 in 1983; 0 otherwise).
As expected, the relationships between each of the ASEAN-5 and Japan are more robust than those between the region and the United States and the European Union. Since the growth rates of all the ASEAN-5 countries are of integrated order I(2) and that of Japan is also I(2), the individual coefficient estimates are robust. In contrast, the coefficient estimates for the relationship between economic growth of the ASEAN-5 countries and those of the United States and the European Union are much less robust and the individual coefficient estimates are often not significantly different from zero.
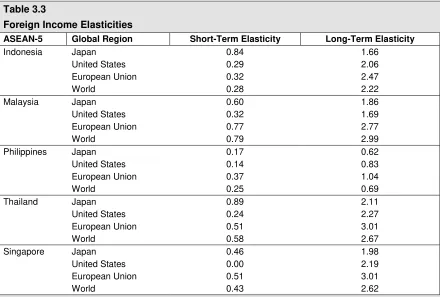
Despite the lack of consistently robust estimates, the results point to a number of conclusions about the relationship between ASEAN-5 economic growth and foreign income growth in the United States, Japan, and the European Union. As Table 3.3 shows, the foreign income elasticities for the ASEAN-5 countries are consistent with expectations. The short-term foreign income elasticities have a mean average of 0.43, and they range from near 0 for the relationship between Singapore and the United States to 0.89 for that between Thailand and Japan. The long-term foreign income elasticities have a mean average of 1.97, and they range from 0.62 for the relationship between the Philippines and Japan to over 3.0 for Singapore with that of the European Union.
[image:23.612.89.529.75.372.2]Among the individual ASEAN-5 countries, the Philippines has the lowest average foreign income elasticity in both the short run (0.23) and long run (0.83). In the short run, Thailand and Malaysia have the largest short-term average foreign income elasticities
Table 3.3
Foreign Income Elasticities
ASEAN-5 Global Region Short-Term Elasticity Long-Term Elasticity
Indonesia Japan 0.84 1.66
United States 0.29 2.06 European Union 0.32 2.47
World 0.28 2.22
Malaysia Japan 0.60 1.86
United States 0.32 1.69 European Union 0.77 2.77
World 0.79 2.99
Philippines Japan 0.17 0.62 United States 0.14 0.83 European Union 0.37 1.04
World 0.25 0.69
Thailand Japan 0.89 2.11
United States 0.24 2.27 European Union 0.51 3.01
World 0.58 2.67
Singapore Japan 0.46 1.98
United States 0.00 2.19 European Union 0.51 3.01
World 0.43 2.62
IV. Transmission Effects of Bilateral Exchange
Rate Differentials
Real effective exchange rate movements favored economic growth in the ASEAN-5 countries in the 1980s and until 1996, despite the loss of competitiveness in some regional markets. Up to the mid-1990s, export growth was favorably affected by improvements in the ASEAN-5’s international competitiveness, and foreign investment grew from the relative strength of foreign currencies and favorable export prospects. However, the situation reversed itself in the mid-1990s when a gradually widening differential between the inflation rates of the ASEAN countries and major trade and investment partners caused the real effective exchange rates of the ASEAN-5 countries to appreciate. The resulting deterioration in export competitiveness led to large increases in the current account deficit of the region as a whole, and Malaysia and Thailand in particular.
Figure 4.1 plots the
trade-weighted average real
effective exchange rate
(REER) of the ASEAN-5
countries against their
imports and exports. The
REER is the nominal
effective exchange rate
adjusted for relative
movements in the national prices of home and partner countries.1 An increase in
the index reflects an
appreciation or revaluation and a decline denotes a devaluation or depreciation. For the ASEAN-5 countries as a whole the devaluation of their REER in the 1980s was followed by large increases in exports of goods and services. In the first half of the 1990s, however, the ASEAN-5’s REER remained almost unchanged as devaluations of the currencies of Indonesia, Malaysia and Thailand were offset by appreciations in those of the Philippines and Singapore. Exports of all countries nevertheless surged during this period, particularly in Malaysia, Thailand and Singapore. In 1996 all ASEAN-5 currencies appreciated in real terms and, with the exception of Singapore, they all devalued sharply in 1997-98. Exports since 1996 have stagnated and have yet to respond
1
The real exchange rate is defined as er
t = Pt/(entPft), whereenis the nominal exchange rate,Pfis the foreign currency
price of goods purchased abroad, andPis the domestic price level. A rise inerrepresents a realrevaluationunder a fixed exchange rate system, and anappreciationunder a flexible exchange rate system. The rise is associated with either a rise in the nominal exchange rateenor a rise in relative prices of domestic goods (equivalent to a fall in relative prices of foreign goods). Conversely, a fall inerrepresents a realdevaluationin a fixed exchange rate system, and a
depreciationin a flexible exchange rate system, which can be brought about by either a fall in the nominal exchange
Figure 4.1
ASEAN-5 Trade of Goods and Services and Real Effective Exchange Rate (Annual % Change)
-40% -20% 0% 20% 40%
1980 1983 1986 1989 1992 1995 1998
T ra d e (% ) -40% -20% 0% 20% R E E R (% )
to the sharp devaluations during 1997-98. Imports, however, did fall sharply in 1998. In Indonesia, for example, the cutbacks in imported inputs following the 80 percent devaluation of the rupiah against the US dollar in early 1998 caused many manufacturing industries engaged
in assembly production to reduce
production or cease production altogether. These industries included both export-oriented industries engaged in textile,
garment, footwear, and consumer
electronics production, and domestic market-oriented industries such as the steel, automotive and pharmaceutical industries (Thee, 1999).
Because most of the ASEAN-5 countries indirectly pegged their exchange rates to the US dollar, their currencies followed the US dollar down against the Japanese yen in the first half of the 1990s and then reversed that trend in the second half of the decade (Table 4.1).2 3 After adjusting for inflation differences in Japan and the United States, the real cross-rate of the yen against the dollar appreciated by over 40 percent in 1990-95 and then depreciated by over 30 percent in 1995-98 (see Figure 4.2). In the EU market the average nominal exchange rate experienced relatively large year-to-year fluctuations against the dollar and showed no clear trend between 1987 and 1996. Only in the important markets of Mainland China and Korea did countries with dollar-pegged currencies improve their export competitiveness.
At the same time, the ASEAN-5
countries’ higher rates of inflation than
in the industrialized countries caused their REER in the US market to appreciate in the latter part of the 1980s and early 1990s (Table 4.2). For the ASEAN-5 region as a whole the REER fell by over 30 percent in the US market between 1980 and 1989,
2
Note that Table 4.1 contains information on nominal exchange rates. As such, a rise in the exchange rate represents a nominaldevaluationin a fixed exchange rate system, and a nominaldepreciationin a flexible exchange rate system. Alternatively, a fall in the exchange rate represents a nominalrevaluationunder a fixed exchange rate system, and a nominalappreciationunder a flexible exchange rate system.
3
For a review of the exchange rate regimes in Southeast Asia through the mid-1990s, see Bénassy-Quéré (1996).
Table 4.1
Nominal Exchange Rate Indices, 1980-98 (Local currency units per US$, 1990=100)
Japan
Other NE Asia
European
Union ASEAN-5
1980 157 60 93 93 1981 152 69 114 94 1982 172 75 129 98 1983 164 86 142 99 1984 164 89 159 99 1985 165 92 165 104 1986 116 98 129 105 1987 100 98 110 103 1988 89 102 107 102 1989 95 99 114 102 1990 100 100 100 100 1991 93 104 103 99 1992 87 107 99 94 1993 77 110 111 95 1994 71 124 110 94 1995 65 122 101 90 1996 75 124 103 91 1997 84 132 113 102 1998 90 156 115 145
Note: Regional averages are trade-weighted by total trade (imports plus exports) of ASEAN-5 countries. Source: Derived from IMF,International Financial Statisticsdata.
Figure 4.2
Bilateral Nominal and Real Yen-US$ Exchange Rate (1990 = 100)
0 100 200 300
1980 1983 1986 1989 1992 1995 1998
but then appreciated by 22 percent between 1989 and 1996. In the EU market the dollar appreciation combined with relative price movements of the ASEAN-5 to produce major
swings in the region’s bilateral REER with that market. In the first half of the 1980s the
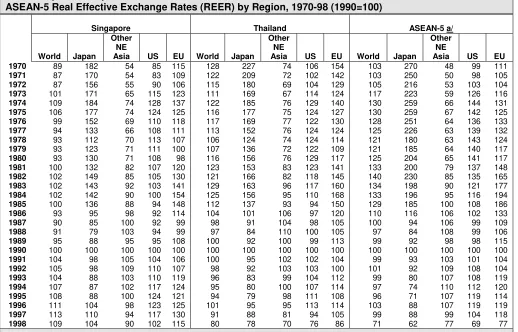
bilateral REER appreciated by 65 percent, it then plummeted by nearly 50 percent in the second half of the 1080s, and in the first half of the 1990s it appreciated by 20 percent. Bilateral REER movements in the Northeast Asian market as a whole appeared to be more modest, but only because the large REER appreciation in the Mainland China market during 1980-94 was offset by a large REER devaluations in the Korean market. The largest changes in ASEAN-5’s bilateral REERs occurred in the Japanese market, where the bilateral REER experience an almost uninterrupted fall between the early 1980s and the mid-1990s. Overall the bilateral REER of the ASEAN-5 with the Japanese yen fell by 70 percent between 1982 and 1995.
Apart from strengthening the demand exports, the ASEAN-5 countries benefited from large-scale capital inflows as a result of exchange rate realignments with the Japanese yen in the early 1990s, as Japanese investors took advantage of relatively low
dollar-Table 4.2
ASEAN-5 Real Effective Exchange Rates (REER) by Region, 1970-98 (1990=100)
Indonesia Malaysia Philippines
World Japan
Other NE
Asia US EU World Japan
Other NE
Asia US EU World Japan
Other NE
Asia US EU
1970 191 316 116 148 213 61 483 116 78 65 114 204 68 95 138
1971 173 280 109 137 190 65 461 109 79 62 121 208 74 102 141
1972 156 232 104 133 166 75 403 104 92 67 116 179 72 103 128
1973 171 244 121 165 179 93 432 121 123 82 115 166 72 112 122
1974 206 299 150 208 228 97 514 150 126 89 134 193 86 134 147
1975 227 324 171 227 234 100 536 171 128 92 122 175 82 123 126
1976 261 355 194 258 280 97 475 194 113 110 123 171 85 124 134
1977 259 330 197 269 279 101 415 197 121 121 122 158 86 128 132
1978 220 252 182 254 240 103 288 182 136 118 114 128 85 129 120
1979 178 219 141 197 179 115 350 141 153 116 125 151 90 136 122
1980 192 247 152 205 190 116 379 152 154 112 132 168 95 139 127
1981 175 255 167 206 233 124 320 167 138 148 134 167 102 135 154
1982 199 294 182 208 259 140 397 182 134 190 140 188 103 133 164
1983 186 223 149 160 222 159 365 149 136 256 118 148 111 107 145
1984 182 214 157 150 232 175 358 157 133 319 111 145 98 102 156
1985 176 204 158 141 223 174 322 158 119 310 120 158 111 109 171
1986 134 131 139 126 155 134 149 139 110 179 103 102 114 98 120
1987 103 96 114 104 111 124 115 114 115 140 98 90 110 98 104
1988 100 89 115 105 111 105 84 115 107 120 97 84 109 99 104
1989 101 95 103 102 116 104 91 103 100 129 104 96 103 103 117
1990 100 100 100 100 100 100 100 100 100 100 100 100 100 100 100
1991 97 93 100 99 102 93 84 100 97 101 100 95 101 101 103
1992 94 89 100 99 97 101 86 100 113 110 110 103 114 115 111
1993 96 82 103 103 112 94 65 103 110 133 106 90 106 113 121
1994 94 79 106 105 112 85 53 106 106 124 111 92 107 123 130
1995 91 76 101 108 104 82 49 101 117 113 114 94 107 133 129
1996 99 91 102 108 110 91 65 102 116 118 124 116 109 137 137
1997 90 86 90 91 103 85 65 90 92 114 121 118 105 125 140
1998 45 43 47 42 48 52 39 47 48 60 101 100 95 97 109
Note: The real effective exchange rate (REER) indices are calculated from real cross-rates for individual trading partners of each ASEAN-5 country, weighted by the relative importance of each export market in the corresponding year.
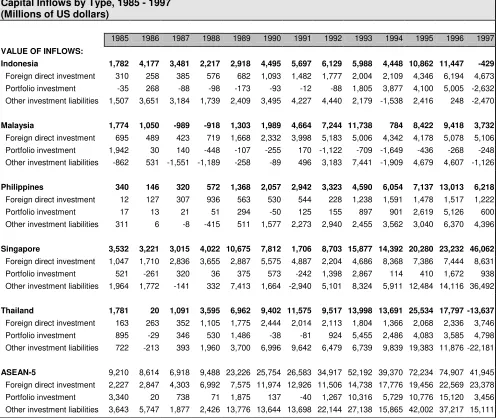
[image:27.612.59.569.319.651.2]related production costs in the region. The investment boom that followed was facilitated by the liberalization of internal and external financial controls in most of ASEAN-5 countries. Asset prices rose with the surge in the markets for stocks and real estate. As bank lending escalated to finance stock and real estate purchases, local financial institutions borrowed short from foreign capital sources and lent long for domestic asset purchases, therefore spreading the term structure of borrowing and lending (Corsetti, Pesenti and Roubini, 1998). As a result, the share of portfolio investment in the capital inflows of the ASEAN-5 increased relative to FDI and other capital flows (Table 4.3). For the ASEAN-5 countries as a whole, the share of portfolio investment in the capital account rose from near zero in 1990-91 to 20 percent in 1996. In Indonesia and the Philippines the share of portfolio investment surged to around 40 percent in 1996.
Table 4.2 (continued)
ASEAN-5 Real Effective Exchange Rates (REER) by Region, 1970-98 (1990=100)
Singapore Thailand ASEAN-5 a/
World Japan
Other NE
Asia US EU World Japan
Other NE
Asia US EU World Japan
Other NE
Asia US EU
1970 89 182 54 85 115 128 227 74 106 154 103 270 48 99 111
1971 87 170 54 83 109 122 209 72 102 142 103 250 50 98 105
1972 87 156 55 90 106 115 180 69 104 129 105 216 53 103 104
1973 101 171 65 115 123 111 169 67 114 124 117 223 59 126 116
1974 109 184 74 128 137 122 185 76 129 140 130 259 66 144 131
1975 106 177 74 124 125 116 177 75 124 127 130 259 67 142 125
1976 99 152 69 110 118 117 169 77 122 130 128 251 64 136 133
1977 94 133 66 108 111 113 152 76 124 124 125 226 63 139 132
1978 93 112 70 113 107 106 124 74 124 114 121 180 63 143 124
1979 93 123 71 111 100 107 136 72 122 109 121 185 64 140 117
1980 93 130 71 108 98 116 156 76 129 117 125 204 65 141 117
1981 100 132 82 107 120 123 153 83 123 141 133 200 79 137 148
1982 102 149 85 105 130 121 166 82 118 145 140 230 85 135 165
1983 102 143 92 103 141 129 163 96 117 160 134 198 90 121 177
1984 102 142 90 100 154 125 156 95 110 168 133 196 95 116 194
1985 100 136 88 94 148 112 137 93 94 150 129 185 100 108 186
1986 93 95 98 92 114 104 101 106 97 120 110 116 106 102 133
1987 90 85 100 92 99 98 91 104 98 105 100 94 106 99 109
1988 91 79 103 94 99 97 84 110 100 105 97 84 108 99 106
1989 95 88 95 95 108 100 92 100 99 113 99 92 98 98 115
1990 100 100 100 100 100 100 100 100 100 100 100 100 100 100 100
1991 104 98 105 104 106 100 95 102 102 104 99 93 103 101 104
1992 105 98 109 110 107 98 92 103 103 100 101 92 109 108 104
1993 104 88 103 110 119 96 83 99 104 112 99 80 107 108 119
1994 107 87 102 117 124 95 80 100 107 114 97 74 110 112 120
1995 108 88 100 124 121 94 79 98 111 108 96 71 107 119 114
1996 111 104 98 123 125 101 95 95 113 114 103 88 107 119 119
1997 113 110 94 117 130 91 88 81 94 105 99 88 99 104 118
1998 109 104 90 102 115 80 78 70 76 86 71 62 77 69 77
a/ Trade-weighted average of individual country real effective exchange rates, where trade measured by the sum of exports and imports of goods and services.
[image:28.612.51.569.93.425.2]When interest rates in the United States rose in early 1997 portfolio adjustments in the United States led to large fund withdrawals from the Southeast Asian region (McKibbin, 1998). Prior to this event, conditions in the external sectors of the ASEAN-5 had already begun to deteriorate. Export growth was slowing down because of real appreciations of the ASEAN-5 currencies during 1996, the deceleration in the growth rate of Japan’s domestic absorption, and large world market price declines in key primary commodity exports of the ASEAN-5 (Marcus et al.,1998). In Japan the real depreciation of the yen against the dollar beginning in 1996 affected the East Asian economies in three ways. First, it reduced the competitive position of the dollar-pegged East Asian economies in the Japanese market, thereby worsening their trade balance with that important trading partner. Second, Japanese companies reduced their investments in East Asia as the dollar strengthened against the yen and escalated the cost of Japanese outsourcing in these
Table 4.3
Capital Inflows by Type, 1985 - 1997 (Millions of US dollars)
1985 1986 1987 1988 1989 1990 1991 1992 1993 1994 1995 1996 1997
VALUE OF INFLOWS:
Indonesia 1,782 4,177 3,481 2,217 2,918 4,495 5,697 6,129 5,988 4,448 10,862 11,447 -429
Foreign direct investment 310 258 385 576 682 1,093 1,482 1,777 2,004 2,109 4,346 6,194 4,673 Portfolio investment -35 268 -88 -98 -173 -93 -12 -88 1,805 3,877 4,100 5,005 -2,632 Other investment liabilities 1,507 3,651 3,184 1,739 2,409 3,495 4,227 4,440 2,179 -1,538 2,416 248 -2,470
Malaysia 1,774 1,050 -989 -918 1,303 1,989 4,664 7,244 11,738 784 8,422 9,418 3,732
Foreign direct investment 695 489 423 719 1,668 2,332 3,998 5,183 5,006 4,342 4,178 5,078 5,106 Portfolio investment 1,942 30 140 -448 -107 -255 170 -1,122 -709 -1,649 -436 -268 -248 Other investment liabilities -862 531 -1,551 -1,189 -258 -89 496 3,183 7,441 -1,909 4,679 4,607 -1,126
Philippines 340 146 320 572 1,368 2,057 2,942 3,323 4,590 6,054 7,137 13,013 6,218
Foreign direct investment 12 127 307 936 563 530 544 228 1,238 1,591 1,478 1,517 1,222 Portfolio investment 17 13 21 51 294 -50 125 155 897 901 2,619 5,126 600 Other investment liabilities 311 6 -8 -415 511 1,577 2,273 2,940 2,455 3,562 3,040 6,370 4,396
Singapore 3,532 3,221 3,015 4,022 10,675 7,812 1,706 8,703 15,877 14,392 20,280 23,232 46,062
Foreign direct investment 1,047 1,710 2,836 3,655 2,887 5,575 4,887 2,204 4,686 8,368 7,386 7,444 8,631 Portfolio investment 521 -261 320 36 375 573 -242 1,398 2,867 114 410 1,672 938 Other investment liabilities 1,964 1,772 -141 332 7,413 1,664 -2,940 5,101 8,324 5,911 12,484 14,116 36,492
Thailand 1,781 20 1,091 3,595 6,962 9,402 11,575 9,517 13,998 13,691 25,534 17,797 -13,637
Foreign direct investment 163 263 352 1,105 1,775 2,444 2,014 2,113 1,804 1,366 2,068 2,336 3,746 Portfolio investment 895 -29 346 530 1,486 -38 -81 924 5,455 2,486 4,083 3,585 4,798 Other investment liabilities 722 -213 393 1,960 3,700 6,996 9,642 6,479 6,739 9,839 19,383 11,876 -22,181
dollar-pegged economies. Third, the long-term upward movement in the nominal dollar value of the yen drove nominal interest rates on yen-denominated assets below those prevailing on dollar-denominated assets (McKinnon and Ohno, 1997, 1998). The resulting interest rate differential induced banks in East Asia to undertake additional foreign currency indebtedness by accepting cheap yen deposits without covering their foreign exchange risk.
With expectations of growth revised downward in 1997, the stock markets in Thailand, Malaysia and the Philippines fell steadily throughout the year, and that of Indonesia followed the downward spiral during the second half of that year. Domestic and foreign investors moved their funds offshore and the resulting net capital outflow drained official reserves in these countries. Without the reserves needed to defend their currencies, Thailand, Malaysia, the Philippines and Indonesia abandoned the dollar peg and sharply devaluated their currencies. With the large spread in the term structure of foreign denominated debt and lending for domestic assets purchases, financial intermediaries in these countries found themselves confronting huge debt burdens. The financial panic of international investors that followed sharply reversed international capital flows and led to wide-ranging competitive devaluations (Goldstein, 1998).
Notwithstanding the contagion of 1997-98, the informal pegging of currencies to the US dollar within the ASEAN-5 region had kept bilateral real exchange rate movements fairly stable. For this reason, McKinnon (1999) has maintained that the pegging of the East Asian currencies to the dollar anchored domestic price levels in those countries and insulated them from beggar-thy-neighbor devaluations during the region’s rapid growth in the 1980s through 1996. In a similar vein, Ohno (1999) has argued that the widespread use of dollar invoicing of foreign trade by East Asian countries protected them against competitive devaluations by neighboring countries until the abandonment of the dollar pegs during the 1997-98 crisis. This situation also led to the buildup of short-term foreign currency indebtedness because of the lack of capital controls in the balance of payments or bank regulations requiring banks and corporations to cover their foreign currency and term structure risks. According to McKinnon, the inadequate regulations and excessive interest rate disparities were the factors that led to over-borrowing and the accumulation of short-term debt.
V.
Modeling International Transmission Effects
In this section we extend the earlier estimates of the relationship between foreign and domestic income activity to include price-related effects and other influences on ASEAN-5 economic growth. The motivation for including these other effects is based on the previous section’s review of the recent macroeconomic histories of these countries. Specifically, we examine the effects of the following variables:
Exchange ratesin the form of either the overall real effective exchange rate of the ASEAN-5 countries, bilateral real effective exchange rates with the major global regions, or the real yen/dollar exchange rate;
International prices in the form of either the terms of trade of the ASEAN-5 countries or world market prices for primary commodities relative to those of manufactures;
Interest ratesin the form of interest rate differentials either between those in Japan and those in the United States, those for ASEAN-5 lending and those for Japanese borrowing, or those for ASEAN-5 lending and those for borrowing in the Eurodollar market;
Investment riskson portfolio and direct investments in the form of either real exchange rate fluctuations or more generally imbalances in the balance of payments that reflect the risk of real exchange rate changes and/or capital controls.
World trade and capital inflows in the form of world trade volumes, current account balances, the ratio of exports to GDP, and the importance of portfolio and direct investments to the economy.
Intra-ASEAN Linkages in the form of the bilateral real effective exchange rate (REER) with other ASEAN-5 countries, the aggregate current account deficit of the ASEAN-5, and the
region’s reserve losses.
The empirical measurement of these effects is based on individual ASEAN-5 country estimates. In all cases, we maintain the earlier specification for the international transmission of incomes changes from the global, and extend that specification to include these other factors influencing economic growth.
5.1 Exchange Rate Effects
framework for the worsening of domestic economic fundamentals a decade later (Corsetti, Pesenti, and Roubini, 1998; Goldstein, 1998; Huh and Kasa, 1997; Makin, 1997; Nolandet al., 1998). In analyzing these effects, past research has usually relied on measures of REER changes in the Southeast Asian economies with all their partner countries. In addition to this measure, we have also tested the bilateral real effective exchange rates of each ASEAN-5 country with the major global regions of Japan, other Northeast Asian countries, the United States, the European Union and other ASEAN-5 countries.
The alternative hypothesis is that the dollar-pegged Southeast Asian economies have been mainly influenced by yen-dollar exchange rate movements. Kwan (1998) has shown that aggregate output of these countries has been closely linked to movements in the yen/dollar exchange rate. His results are based on estimates of the relationship between aggregate output growth of the Asian economies and the US gross national product (GNP) growth rate and percentage changes in the yen/dollar exchange rate. Output in the Asian economies was found to be positively related to the yen/dollar exchange rate: when the yen weakened, output growth in the dollar-pegged Asian economies slowed; when the yen strengthened, output growth accelerated.
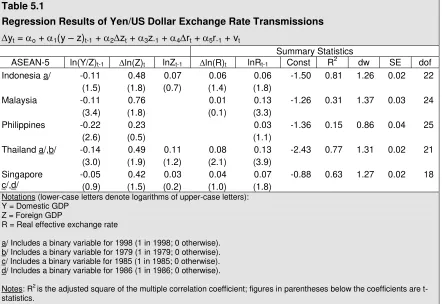
[image:32.612.83.525.87.391.2]We found the real yen/dollar exchange rate to be significant in explaining real GDP of the ASEAN-5 countries (Tables 5.1 and 5.2). On average, the short-term elasticity of income with respect to the real yen/dollar exchange rate is equal to 0.05, while the average long-term elasticity is 0.81. The short-term elasticities vary from 0.01 (Malaysia) to 0.08 (Thailand), while
Table 5.1
Regression Results of Yen/US Dollar Exchange Rate Transmissions
yt=o+1(y–z)t-1+2zt+3z-1+4rt+5r-1+ vt
Summary Statistics
ASEAN-5 ln(Y/Z)t-1 ln(Z)t lnZt-1 ln(R)t lnRt-1 Const R2 dw SE dof
Indonesia a/ -0.11 (1.5) 0.48 (1.8) 0.07 (0.7) 0.06 (1.4) 0.06 (1.8)
-1.50 0.81 1.26 0.02 22
Malaysia -0.11 (3.4) 0.76 (1.8) 0.01 (0.1) 0.13 (3.3)
-1.26 0.31 1.37 0.03 24
Philippines -0.22 (2.6) 0.23 (0.5) 0.03 (1.1)
-1.36 0.15 0.86 0.04 25
Thailand a/,b/ -0.14 (3.0) 0.49 (1.9) 0.11 (1.2) 0.08 (2.1) 0.13 (3.9)
-2.43 0.77 1.31 0.02 21
Singapore c/,d/ -0.05 (0.9) 0.42 (1.5) 0.03 (0.2) 0.04 (1.0) 0.07 (1.8)
-0.88 0.63 1.27 0.02 18
Notations (lower-case letters denote logarithms of upper-case letters): Y = Domestic GDP
Z = Foreign GDP
R = Real effective exchange rate
a/ Includes a binary variable for 1998 (1 in 1998; 0 otherwise). b/ Includes a binary variable for 1979 (1 in 1979; 0 otherwise). c/ Includes a binary variable for 1985 (1 in 1985; 0 otherwise). d/ Includes a binary variable for 1986 (1 in 1986; 0 otherwise).
Notes: R2
the long-term elasticities vary from 0.13 (Philippines) to 1.33 (Singapore). All the coefficients have the expected positive sign suggesting that output in the ASEAN-5 economies is positively related to the yen/dollar exchange rate. The explanation for these findings is that when the yen has risen against the dollar, the export competitiveness of the dollar-pegged Asian economies has improved in the Japanese market and production costs have became more attractive to Japanese
investors. Alternatively, when the yen has weakened (for example, as it did between mid-1995 and mid-1997) Japanese export demand and FDI outflows have contracted and economic growth in the Southeast Asian economies has fallen.
The REER of the ASEAN-5 countries was statistically significant in explaining income changes of Indonesia, Malaysia and the Philippines. However, only in the case of Malaysia was the REER found to be significant in the long run. These findings are not surprising since reduced form estimates that relate real GDP of countries to their REER are often unable to capture the transmission effects of this variable through the demand for exports and imports and direct and portfolio investments. Instead it is usually necessary to estimate structural equations relating each of the national income components (for example, export demand) to the REER and then to estimate the individual effects on aggregate income.
5.2 International Price and Trade Volume Effects
In addition to real exchange rate changes, movements in world market prices for traded commodities and manufactures have impacted on the foreign demand for ASEAN-5 exports and the domestic demand for imports. Moreover, international prices have had an indirect effect on ASEAN-5 growth through their impact on export-oriented FDI activities. The importance of foreign firms in the export sector is well-documented (Chen, 1994; Dahman and Westphal, 1983). There is also ample evidence that export-orientation is one of the most important determinants of FDI flows (see, for example, Singh and Jun, 1995 and references therein). Moreover, the terms-of-trade shocks that hit Southeast Asia in 1997 had major repercussions on corporate earnings expectations. Stock markets in those countries contracted sharply, particularly in Thailand, Malaysia and the Philippines, and both foreign and domestic investors began to move funds offshore (Nolandet al., 1998).
Table 5.2
Foreign Income and Exchange Rate Elasticities
ASEAN-5 Foreign
Income
Real Yen/Dollar Exchange Rate
Indonesia Short-term 0.48 0.06
Long-term 1.67 0.57
Malaysia Short-term 0.76 0.01
Long-term 1.00 1.15
Philippines Short-term 0.23 0.03 (t-1)
Long-term 1.00 0.13
Thailand Short-term 0.49 0.08
Long-term 1.80 0.90
Singapore Short-term 0.42 0.04
Long-term 1.56 1.33
Table 5.3
Regression Results of ASEAN-5 GDP Relationships to Foreign Income, International Financial Indicators and World Trade
yt=o+1(y–z)t-1+2zt+3z-1+4rt+5r-1+6wt+7w-1+8qt+9q-1+10dt+11d-1+12kt+13k-1+ vt
ASEAN-5 ln(Y/Z)t-1 ln(Z)t lnZt-1 ln(R)t lnRt-1 ln(W)t lnWt-1 ln(Q)t LnQt-1 ln(D)t lnDt-1 ln(K)t lnKt-1 Const R2 dw SE dof
Indonesia -0.32 (4.9) 0.38 (1.6) -0.08 a/ (2.5) 0.22 (4.6) 0.24 (4.8) 0.04 (8.9) 0.51 (7.6) -0.01b/ (0.9) -0.05b/ (6.1)
-5.14 0.97 2.61 0.01 10
Malaysia c/,d/ -0.09 (1.2) 0.21 (0.7) -0.02 e/ (0.5) -0.03e/ (0.9) 0.11 (2.5) 0.01 (0.2) 0.03 (4.9) 0.09 (1.5) -0.01 f/ (0.2) -0.01 f/ (0.1)
-0.78 0.85 2.24 0.02 15
Philippines -0.30 (1.4) 0.79 (0.6) -0.13 (1.2) 0.09 (0.6) 0.02 (2.5) 0.30 (2.6) -0.04 (1.5) -0.09 (3.9) -0.09 (2.3) -0.13 (4.4)
-3.37 0.79 2.99 0.02 7
Thailand -0.11 (1.8) 0.21 (1.8) 0.09 g/ (3.4) 0.02 (0.4) 0.02 (3.6) -0.03 b/ (3.7)
-3.12 0.91 1.67 0.01 13
Singapore c/ -0.07 (1.7) 0.03 (0.3) 0.08 g/ (2.4) 0.14 (3.2) 0.005 (1.5)
-1.03 0.86 2.5 0.01 12
Notations (lower-case letters denote logarithms of upper-case letters): Y = Domestic GDP
Z = Foreign GDP
R = Real effective exchange rate W = Global terms of trade Q = World trade volume D = Interest rate differential K = Risk premium
a/ Bilateral REER with Japan, other Northeast Asia, USA, EU and other ASEAN-5 countries. b/ Risk premium based on real Japanese yen/US dollar exchange rate.
c/ Includes a binary variable for 1985 (1 in 1985; 0 otherwise). d/ Includes a binary variable for 1986 (1 in 1986; 0 otherwise). e/ Bilateral REER with USA.
f/ Risk premium based on REER of domestic currency. g/ Japan-USA REER.
h/ Risk premium based on interest rate differential between Japanese yen and US dollar.