Constraint based Cluster Ensemble to Detect Outliers in
Medical Datasets
Visakh. R
P.G Scholar, Dept. of C.S.E Anna University of Technology
Coimbatore, India
Lakshmipathi. B
Assistant Professor, Dept. of C.S.E Anna University of Technology
Coimbatore, India
ABSTRACT
Outlier analysis in medical datasets can reveal very significant traits regarding behavioral pattern of genes. Presence of outliers may indicate symptoms of genetic disorders or mutant tumors. In case of genetic disorders, designing curative medicines is possible only after studying the gene-gene and gene-tumor relationships. This means that identification of outlier observations alone is insufficient to clarify the source of outliers, i.e. to which tumors they are related. Most of the existing works adopt single clustering algorithms to detect outlier patterns from bio-molecular data. However, single clustering algorithms lack robustness, stability and accuracy. This work uses a form of semi-supervised cluster ensemble to analyze outlier patterns based on their relations to clusters. Specifically, the prior knowledge of a dataset is fed to the cluster ensemble in the form of constraints. The clusters produced are analyzed for detecting outliers by filtering out insignificant clusters. Then, the outlier-cluster association is calculated using a fuzzy approach. The combined fuzzy- constraint based cluster ensemble approach can be used to effectively analyze outliers in medical datasets.
General Terms
Data mining, Clustering, Outlier detection, medical data clustering.
Keywords
Cluster ensemble, spectral clustering, fuzzy-combined constraint based cluster ensemble, outlier detection, constraints, semi-supervised clustering.
1.
INTRODUCTION
An outlier is an observation or pattern which exhibits a distinctively unusual behavior from other observations in the dataset. Outlier detection is an important data mining task of searching the database in order to find out those „odd ones‟ out. Outlier detection has many applications such as telecom and credit card fraud detection, loan approval, pharmaceutical research, weather prediction, financial applications, marketing, customer segmentation, network intrusion [1] and data cleaning. Outlier analysis is often ignored in classification or clustering problems. The presence of outliers can indicate individual patterns or groups that behave quite different from a standard situation. In medical datasets, identifying gene outliers indicate abnormal gene behavior, possibly showing a drastic change in gene functioning. In the case of bio-molecular data, a gene expression that has been identified as an outlier from a particular tumor cluster gives a hint that it is a mutant tumor. Such information can further be used in the drug design for tumors, and to study variations of a particular tumor.
Clustering is a very important tool for performing outlier detection. Many clustering-based outlier detection techniques have been developed. Majority of these techniques assume that normal data points tend to form dense clusters, whereas outliers are the ones that belong to clusters of insignificant sizes. A traditional clustering algorithm that can be used for outlier detection is K-means clustering [10]. K-Means algorithm partitions a dataset into K clusters. The main property of the clusters is that data points within the same cluster have a high degree of similarity while points lying in different clusters are significantly dissimilar. The K-Means algorithm selects K objects randomly, each of which initially represents a cluster mean. The remaining data points are assigned to clusters based on their similarity to that cluster. Each time a data point is added to a cluster, the cluster mean is recomputed. This process continues until all data points are assigned a cluster. Data points belonging to clusters of small sizes are treated as outliers. The K-Means algorithm is not at all robust because the cluster means produced may vary in presence of noise and outliers. Another approach is the PAM clustering algorithm [4]. PAM algorithm first selects an initial set of cluster centers (called medoids) and replaces each one of the selected medoids by anyone of the none-selected medoids in the data set. The main objective of this step is to improve the sum of dissimilarities of the data points to their nearest medoids. The process is repeated until the function converges. Small clusters are then found out and considered as outlier clusters. In the remaining clusters, outliers may be found out by comparing their absolute distances from the medoid of the current cluster. PAM is more powerful and robust than K-Means but at the cost of long computation time. Moreover, determination of initial set of cluster medoids poses an issue. Another powerful clustering-based outlier detection technique is Fuzzy C-Means (FCM) clustering [3]. In fuzzy clustering technique, each point belongs to multiple clusters by a varying degree of membership. The Fuzzy C-Means clustering method is flexible since the degrees of membership function of data points enable the easy understanding of dynamic structures in databases.
Generally, all clustering-based approaches have the advantage that they need no supervision at all. Moreover, clustering-based techniques are evolutionary (i.e., after forming clusters in the learning phase, new points can be inserted into the system and tested for outliers).
2. RELATED WORK
There has been many research works on outlier detection from data mining systems [1], [2], [3], [4].
Petrovskiy [1] proposed the idea of construction of a probabilistic data model and the use of mathematical methods of applied statistics and probability theory is discussed. A probabilistic model can be either a priori given or automatically constructed by given data. If the object does not suit the probabilistic model, it is considered to be an outlier. Zengyou He, et al. [2] discussed the concept of local outlier detection. This work proposed a new measure called CBLOF (Cluster-based Local Outlier Factor), which gave importance to local data behavior.
Yousri, et al. [3] explored a new fuzzy approach for integrating results from an outlier detection method and a clustering algorithm. A universal set of clusters is proposed which combines clusters obtained from clustering, and a virtual cluster for the outliers. The approach had two phases; the first computes pattern‟s initial memberships for the outlier cluster, and the second calculates memberships for the universal clusters, using an iterative membership propagation technique. This research tackled the problem of obtaining connected gene expression patterns, rather than coherent patterns. Pattern connectivity corresponds to the known arbitrary-shaped clustering in low dimensions, and has different biological implications.
Al-Zoubi [4] proposed a new method based on clustering algorithms for outlier detection. They first performed the PAM clustering algorithm. Small clusters were then determined and considered as outlier clusters. The rest of outliers were then found in the remaining clusters based on calculating the absolute distances between the medoid of the current cluster and each of the points in the same cluster. Strehl and Ghosh [5] introduced the problem of combining multiple partitioning of a set of objects into a single consolidated clustering without accessing the features or algorithms that determined these partitioning. Three effective and efficient techniques for obtaining high-quality combiners (consensus functions) were proposed. The first combiner induces a similarity measure from the partitioning and then reclusters the objects. The second combiner is based on hypergraph partitioning. The third one collapses groups of clusters into meta-clusters which then compete for each object to determine the combined clustering. The proposed techniques were of low computational costs, and as such it was quite feasible to use a supra-consensus function that evaluates all three approaches against the objective function and picks the best solution for a given situation. The researchers evaluated the effectiveness of cluster ensembles in three qualitatively different application scenarios. Promising results were obtained in all three situations for synthetic as well as real data-sets.
Fern and Brodley [6] gave a detailed study on random projection for clustering high-dimensional data. In this work, a single run of clustering consists of applying random projection to the high dimensional data and clustering the reduced data using the Expectation-Maximization (EM) algorithm. Multiple runs of clustering are performed and the results are aggregated to form an n x n similarity matrix, where n is the number of instances. An agglomerative clustering algorithm is then applied to the matrix to produce the final clusters. Experimental results on data sets show that this ensemble approach achieves better clustering
performance than not only individual runs of random projection or clustering but also EM clustering with PCA data reduction. The work also demonstrated that both the quality and the diversity of individual clustering solutions had strong impact on the resulting ensemble performance.
Yu, Wong and Wang [7] investigated cluster ensembles with the prior knowledge. Their major contribution was a new cluster ensemble approach called knowledge based cluster ensemble (KCE) which incorporates the prior knowledge of the datasets into the cluster ensemble framework. The experiments in real datasets showed that the prior knowledge was not harmful for the cluster ensemble approaches and also performance of the cluster ensemble approaches in most of datasets could be improved if they considered the prior knowledge.
Despite of the existence of a lot of cluster ensemble approaches, few of them consider the previous domain knowledge obtained from input datasets. The knowledge of an expert will serve as the primary source of prior knowledge of a dataset, which helps to improve the accuracy of the clustering. The most important type of prior knowledge used in clustering algorithms is represented in the form of constraints. Then, a set of clustering solutions is obtained by applying spectral clustering algorithm (SC) [7]. Next, the constraints are converted into confidence factors for these clustering solutions. After that, a consensus matrix [7] is constructed by incorporating all the clustering solutions and their corresponding confidence factors. The final clusters are obtained by re-clustering the consensus matrix.
3.
CONSTRAINT
BASED
CLUSTER
ENSEMBLE
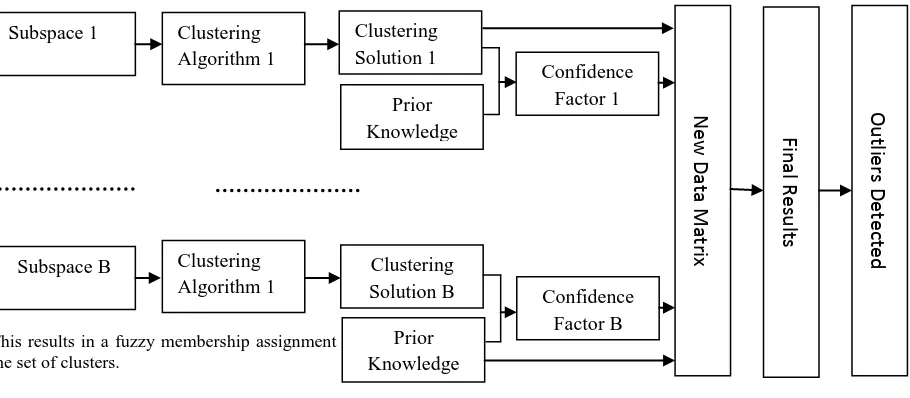
This work proposes a constraint based cluster ensemble framework to detect soft-outliers in combination with fuzzy approach [3]. The constraint based cluster ensemble approach incorporates the prior domain knowledge of the datasets into the cluster ensemble framework. The prior knowledge of a dataset in the form of constraints. Then, a set of clustering solutions is obtained by performing spectral clustering. Next, confidence factors for each of these clustering solutions are calculated. After that, a consensus matrix is constructed by considering all the clustering solutions and their corresponding confidence factors. The consensus matrix is then clustered to form the actual clustering results of the dataset. After clusters are obtained, the patterns that are not assigned to any clusters, as well as the patterns in clusters of sizes less than 1%~5% of the data size (clusters of insignificant sizes) are identified as outliers. In fuzzy approach, outlier observations are those patterns with neighborhood distances inconsistent with the distances in their surrounding patterns‟ neighborhoods. This means that, healthy clusters tend to form dense clusters while outliers (or outlier clusters) form sparse clusters that are of insignificant sizes. The proposed system proceeds in the following manner: Begin
Step 1: Perform clustering using constraint based cluster ensemble approach to produce a set of k clusters.
Step 2: Determine small cluster threshold Tj and consider the
points that belong to these clusters as outliers.
Step 4: If |pi|> Tj. then, consider the points that belong to these clusters as outliers.
Step 5: For each point i in an outlier cluster j, compute fuzzy membership value: 1 / e^ |pi|ij.
End
The proposed approach starts by executing the constraint based clustering algorithm. Small clusters are then determined and considered as outlier clusters. Then compute the absolute distances between each one of the points, pi, in the cluster and the medoid, μ of that cluster (i.e., |pi|). The produced value is compared with a calculated threshold, T. If that value exceeds T, then the point is considered an outlier; otherwise, it is not. The value of T is calculated as the average of all
|
|pi values of the same cluster. After detecting outliers, each outlier is given a membership value (ranges from 0 to 1) to a cluster. Membership value 1 indicates full inliers and 0 indicates full outliers while other patterns will have a membership ranging from 0 to 1. This results in a fuzzy membership assignment of patterns to the set of clusters.
3.1 Forming Initial Clusters
The first step is to generate a set of clustering solutions of the given dataset. As stated already, spectral clustering is used to generate a set of clusters of the given dataset. The prior knowledge of the dataset is first represented as suitable constraints. Then, a set of clustering solutions is generated by the spectral clustering algorithm. Next, the constraints are used to calculate corresponding confidence factors of the clustering solutions. Then, a consensus matrix is constructed by considering all the clustering solutions and their corresponding confidence factors. The final clustering result is obtained by re-clustering the consensus matrix [5].
The main steps in generating clusters using constraint based cluster ensemble approach are discussed below:
The main idea of this approach is to first generate multiple partitions by projecting the data on a random platform. The projected data is clustered using efficient spectral clustering algorithm. Afterwards, a chosen consensus function [8] (spectral clustering) is applied to the components to obtain the final clusters.
Assume that the dataset D consists of a set of data points (D = { x1, x2,…., xn}), n is the number of data points), the b-th
subspace is generated by applying Weka‟s unsupervised attribute filter RandomSubset. This filter operation randomly selects db dimensions from d dimensions of the data. The above process is repeated B times and B datasets { D1, D2 ,….,DB
} are generated.
Spectral clustering (SC) [7] is chosen as the clustering algorithm to generate clustering solutions for the multiple partitions. Given a dataset Db(b{1,....,B})with n data points, spectral clustering partitions these data points into K classes. SC constructs an affinity matrix F whose individual entry is defined as follows:
) , ( i j
ij E x x
f
where E(xi,xj) is the Euclidean distance between the samples xi and xj.
Then, it constructs a diagonal matrix R whose diagonal entry })
,..., 1 {
(i n
rii is defined as follows:
n
j f rii ij
1
SC then constructs the normalized affinity matrix T as follows: 2 / 1 2 / 1
F RF T
Next, it selects the first l largest eigenvectors of T, and obtains an n × l matrix Z. It further re-normalizes the rows of Z and obtains a normalized matrix X:
2 / 1 2 ) /( j z z
Xij ij ij
SC then regards each row of X as a new data point })
,..., 1 { (
' i n
i
x , and applies K-means to cluster these new data points into K classes. Finally, if the point xi’ is assigned
to the class C, the corresponding original data point xi is
assigned to the class C as well. SC is repeatedly applied to the B datasets to obtain B clustering solutions I = { I1, I2,….., IB}. Each clustering solution partitions the dataset Db into K disjoint classes. For each clustering solution, an n×K membership matrix Mbis constructed whose entry is defined as follows:
b ik
M 1 if xi belongs to the k-th class,
0 otherwise.
where n is the number of data points, and K is the number of classes.
The constraint based cluster ensemble algorithm represents prior knowledge of datasets in the form of constraints. There are two sets of constraints [12]:
Must-link constraints: Each pair of points is considered similar and should be clustered into the same cluster.
Cannot-link constraints: Each pair of points is considered dissimilar and they cannot be clustered into the same clusters.
Consensus function [8] servers as a method for representing and quantifying the agreement among multiple clustering solutions. A consensus matrix is an (N × N) matrix that stores, for each pair of items, the proportion of clustering solutions in which two items are clustered together.
A feature based approach [9] is used here that converts the problem of cluster ensembles to simply clustering categorical data. Specifically, each clustering provides a cluster label that acts as a new feature describing each data point, which is utilized to formulate the final solution.
3.2 Detecting outliers
points are always densely located and so the distance between points is less when compared to outliers.
3.3 Associating detected outliers to clusters
Simply identifying outliers will not relate them to a particular cluster. Knowing the degree of outlierness to a specific cluster can help identifying useful relationship between an outlier and any pattern in the dataset. For relating outliers to clusters, a fuzzy approach is utilized [3]. After identifying clusters and outliers, the initial memberships of patterns to the clusters are calculated. Each outlier is given a membership value (ranges from 0 to 1) to a cluster. Membership value 1 indicates full inliers and 0 indicates full outliers while other patterns will have a membership ranging from 0 to 1. For each point i in an outlier cluster j, the fuzzy membership value is computed using a mapping function 1 /e^|pi|ij
This results in a fuzzy membership assignment of patterns to the set of clusters.
3.4 Analysis of outliers
[image:4.595.59.514.261.460.2]The analysis of outlier detection is performed by comparing the number of outliers detected by the proposed method against existing outlier detection schemes. Quality of outliers detected depends heavily on the type of clustering algorithm used. Constrained spectral clustering produces more efficient and highly robust clusters compared to existing algorithms. The suggested outlier detection technique clearly outperforms the state-of-the art outlier detection techniques. Determining the fuzzy association of outliers to clusters reveals one important fact: no outlier is perfectly an outlier; it may show varying degree of resemblance to some other cluster. Framework of the proposed system is illustrated in figure 1.
Figure 1: Constraint-based cluster ensemble framework to detect outliers
4.
EXPERIMENT AND RESULTS
4.1 Experimental setup
The algorithm is tested using the lung cancer dataset which is obtained from the UCI Repository [11]. The lung cancer is a real world dataset consisting of 32 instances. Total number of attributes is 57. First attribute is the class attribute and is nominal. All others are predictive attributes. The instances belong to three classes, the number of observations in each class being 9, 13 and 10 respectively.
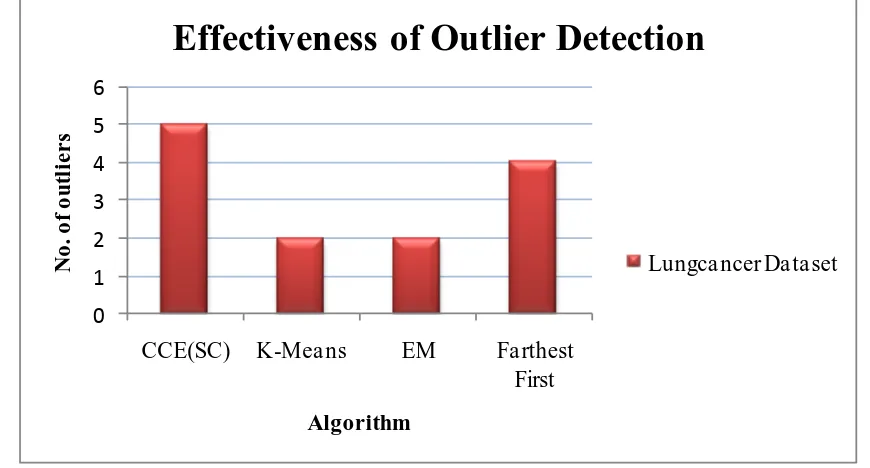
The first set of experiments were conducted to test the effectiveness of the suggested approach against known algorithms. The number of outliers detected in case of constraint based cluster ensemble using spectral clustering as the clustering algorithm (CCE(SC)) was 5. Experiments with K-Means, EM algorithm [6] and Farthest-First algorithm yielded 2, 2 and 4 outliers respectively. In this way, the constraint-based cluster ensemble technique outweighs existing single clustering as well as other clustering-based outlier detection approaches. Figure 2 clearly illustrates the
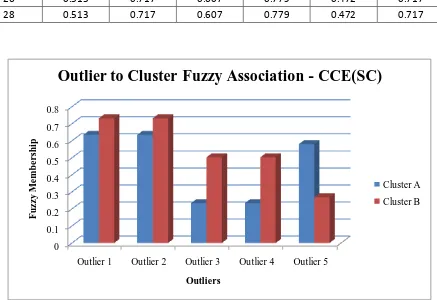
effectiveness of outlier detection using CCE(SC) algorithm compared to other well-known clustering algorithms. The next set of experiments was conducted to analyze the fuzzy association between outlier points and clusters. The fuzzy membership values are computed for each outlier detected. The values obtained are given in tables 1 through 4. CCE(SC) algorithm detected 5 outlier points in the lung cancer dataset. There are 2 healthy clusters. Each outlier point is associated to a healthy cluster by some fuzzy value between 0 and 1. Referring to table 1, we can find that using the proposed algorithm, instances 13, 19, 22, 23 and 29 are outliers. They are associated to healthy cluster A by values 0.635, 0.635, 0.234, 0.234 and 0.58 respectively. Referring to table 2, we can find that using K-Means algorithm, instances 22 and 29 are identified as outliers. They are associated to healthy cluster A by fuzzy membership values 0.336 and 0.403 respectively. Similarly, table 3 indicates that the fuzzy values obtained when EM algorithm is executed on lung cancer dataset yielded association values 0.197 and 0.537 respectively to cluster A. Finally, table 4 shows the results obtained for FF algorithm. In this case, 4 outliers were detected with association values 0.189, 0.189, 0.513 and 0.513 to cluster A. The fuzzy outlier-cluster association values obtained for lung cancer dataset using the proposed algorithm is graphically depicted in figure 3.
Subspace B
Clustering Solution 1
Clustering Solution B
Prior Knowledge
Confidence Factor 1
Confidence Factor B Clustering
Algorithm 1 Subspace 1
N
ew
D
ata
M
atri
x
Fi
n
al Results
Outli
ers
D
et
ect
ed
Prior Knowledge
4.2 Comparison with existing approaches
The performance of the constraint based cluster ensemble algorithm is compared to existing outlier detection algorithms. Traditional clustering-based algorithms detect outliers by either creating a probabilistic model or by using geometric interpretation of distances between points in a dataset [1]. The main difficulty with these methods is the complexity involved in computation. Creation of a probabilistic model or computing distances between data points take much time and hence lead to even quadratic complexity.
To effectively detect outliers using cluster-based approaches, the quality of clusters produced must be good. When compared to single clustering algorithms such as K-Means, ensemble clustering is far more effective in producing high quality clusters. Ensemble clustering uses multiple clustering algorithms to generate a collection of clustering solutions and then combines the partitions [5]. Giving some prior knowledge about dataset can help to improve the clustering further [7]. In this way, clustering is made semi-supervised. It is found that for the lung cancer dataset, outlier detection was most effective in case of the suggested constraint based
cluster ensemble algorithm. Spectral clustering used in ensemble clustering framework helps to produce highly robust clusters.
Associating detected outliers to known clusters can be very useful in data mining which is often not performed or underestimated. In [3], a fuzzy analysis of outliers is performed in gene expression data. The drawback with that method is that it uses a connectivity-based algorithm which proceeds in a hierarchical manner. The genetic expressions go irrelevant as the algorithm proceeds to higher levels in the hierarchy. In fact, all hierarchical methods create a sort of confusion regarding the assignment of data points to clusters. This is because they are deterministic in the process of cluster assignment [8]. An error in the lower level can be very difficult to correct thereafter. Therefore, such a method is unsuitable for medical datasets. The suggested fuzzy combined constraint-based cluster ensemble algorithm outperforms the one previously stated in terms of efficiency of outliers detected as well as the simplicity of computations involved. Connectivity based clustering techniques are always computation-intensive.
0
1
2
3
4
5
6
CCE(SC)
K-Mea ns
EM
Farthest
First
N
o
.
o
f
o
u
tl
ie
r
s
Algorithm
Effectiveness of Outlier Detection
[image:5.595.78.513.327.561.2]Lungca ncer Da ta set
Figure 2: Effectiveness of outlier detection of CCE(SC) compared with K-means, EM and FF algorithms
Table 1: Fuzzy outlier-cluster association values for CCE(SC)
Instance #
Cluster A
Cluster B
13
0.635
0.732
19
0.635
0.732
22
0.234
0.503
23
0.234
0.503
[image:5.595.192.401.617.715.2]Table 2: Fuzzy outlier-cluster association values for K-Means
Instance #
Cluster A
Cluster B
Cluster C
Cluster D
Cluster E
Cluster F
Cluster G
Cluster H
22
0.336
0.368
1
0.223
0.607
0.223
1
0.368
29
0.403
0.368
0.135
0.607
0.223
0.607
0.135
0.368
Table 3: Fuzzy outlier-cluster association values for EM
Instance #
Cluster A
Cluster B
Cluster C
Cluster D
Cluster E
Cluster F
Cluster G
Cluster H
25
0.197
0.607
0.67
0.223
1
0.368
0.082
0.513
[image:6.595.35.554.168.214.2]26
0.535
0.607
0.549
0.607
0.368
1
0.223
0.717
Table 4: Fuzzy outlier-cluster association values for FF
Instance #
Cluster A
Cluster B
Cluster C
Cluster D
Cluster E
Cluster F
22
0.189
0.264
0.607
0.287
0.779
0.513
25
0.189
0.264
0.607
0.287
0.779
0.513
26
0.513
0.717
0.607
0.779
0.472
0.717
28
0.513
0.717
0.607
0.779
0.472
0.717
0 0.1 0.2 0.3 0.4 0.5 0.6 0.7 0.8
Outlier 1 Outlier 2 Outlier 3 Outlier 4 Outlier 5
F
u
z
z
y
M
e
m
b
e
r
sh
ip
Outliers
Outlier to Cluster Fuzzy Association - CCE(SC)
Cluster A
Cluster B
Figure 3: Fuzzy outlier-cluster association values obtained for lung cancer dataset
5.
CONCLUSION
A fuzzy combined constraint based cluster ensemble approach for analyzing outlier patterns with respect to the clusters is proposed. The proposed approach produces clusters of arbitrary shape using constraint based cluster ensemble. Small clusters are found out and are considered as outlier clusters. After detecting outlier points, each outlier is given a membership value to a cluster. Membership value 1 indicates fully healthy cluster points while 0 indicates perfect outliers. Other data points will have a membership value ranging from 0 to 1. Due to this, a fuzzy membership assignment of patterns to the set of clusters is obtained. The suggested approach clearly outperforms existing techniques for outlier detection in
[image:6.595.78.515.301.601.2]6. REFERENCES
[1] M. I. Petrovskiy, “Outlier Detection Algorithms in data mining systems”, Programming and Computer Software, Vol. 29, No. 4, 2003.
[2] Z. He, X. Xu, S. Deng, “Discovering Cluster-Based Local Outliers”, Pattern Recognition Letters, June 2003. [3] N. A. Yousri, M. S. Kamel and M. Ismail, “A Fuzzy
Approach for Analyzing Outliers in Gene Expression Data”, International Conf. on BioMedical Engg. And Informatics, 2008.
[4] Moh‟d B. Al. Zoubi, “An Effective Clustering-BasedApproach for Outlier Detection”, European Journal for Scientific Research, 2009.
[5] A. Strehl and J. Ghosh, ”Cluster Ensembles — A Knowledge Reuse Framework for Combining Multiple Partitions”, Journal of Machine Learning Research 3, pp. 583-617, 2002.
[6] X.Z. Fern and C.E. Brodley, ”Random Projection for High Dimensional Data Clustering: A Cluster Ensemble Approach”, Proc. 20th Int’l Conf. Machine Learning, pp. 186-193, 2003.
[7] Z. Yu, H. S. Wong, J. You, Q. Yang, H. Liao, “Knowledge based Cluster Ensemble for Cancer
Discovery from Bio-Molecular Data”, IEEE Transactions on Nanobioscience, 2011.
[8] S. Monti, P. Tamayo, J. Mesirov, and T. Golub, ”Consensus Clustering: A Resampling Based Method for Class Discovery and Visualization of Gene Expression Microarray Data”, J. Machine Learning, vol. 52, pp. 1-2, 2003.
[9] D. Greene, A. Tsymbal, N. Bolshakova, and P. Cunningham, ”Ensemble Clustering in Medical Diagnostics”, Technical Report TCD-CS- 2004-12, Dept. of Computer Science, Trinity College, Dublin, Ireland, 2004.
[10]Han, J. and Kamber, M., Data Mining: Concepts and Techniques, Morgan Kaufmann, Second edition, 2006. [11]A. Asuncion, and D.J. Newman, ”UCI Machine Learning
Repository
http://www.ics.uci.edu/mlearn/MLRepository.html],” Irvine, CA: University of California, School of Information and Computer Science. 2007.