© 2017, IRJET | Impact Factor value: 6.171 | ISO 9001:2008 Certified Journal
| Page 934
A Study on Effect of Motivation on Employee Job Performance at
Anurag Group of Institutions
C.Supriya
1, CH.Siva Priya
21,2
Assistant Professor
Anurag Group of Institutions, Hyderabad
---***---
Abstract: Motivation is an active mechanism in the hands of the management in stimulating the work force .It is the major task of every manager to motivate his subordinate or to produce the will to work among the subordinates. It should also be recollected that the worker may be enormously capable of doing some work, nothing can be achieved if he is not willing to work .creation of a will to work is motivation in simple but true sense of term.
Human motives are internalized goals within individuals. A motive is an inner state that drives activates, or moves and directs or channels behavior towards goals. The present study is aimed at improving the performance of employees through motivation at Anurag group of Institutions, Hyderabad.
Keywords: Motivation, Work force, Goals, Behavior, Drives, Motives.
INTRODUCTION :
Motivation has been variously defined by scholars. Usually one or more of these words are included in the definition: desires, wants, aims, goals, drives, motives and incentives. Motivation is derived from the Latin word ‘Movere’ which means “to move”.
Employee motivation is the psychological forces that determine the direction of a person internal and external factors that stimulate desire and energy in people to be continually interested and committed to a job role or subject or to make an effort to attain a goal.
Motivation results from the interaction of both conscious and unconscious factors as the (1) intensity of desire or need, (2) incentive or reward value of the goal, and (3) expectations of the individual and of his or her peers. These factors are the reasons for behaving a certain way.
OBJECTIVES OF THE STUDY:
Identify the factors that motivate the employees.
To understand the impact of monetary and
non-monetary benefits
To identify the factors that de-motivates the
employees.
NEED FOR THE STUDY:
The research problem here in this study is associated with the motivation.
Motivated employees are a great asset to any organization. It is because the motivation and Job Satisfaction is clearly linked.
The study is intended to evaluate motivation of employees in the organization. A good motivational program procedure is essential to achieve goal of the organization.
This study helps the researcher to realize the importance of effective employee motivation. It provides strategic guidance for both providing and using reward/recognition programs.
SCOPE OF THE STUDY:
The present study on employee motivation helps to get a clear picture about the factors which motivates the employees. This in turn helps the management to formulate suitable policy to motivate the employees. It is necessary for every organization to study the different aspects that affect the organization development. In this survey the emphasis is on the motivation of employees.
RESEARCH METHODOLOGY:
© 2017, IRJET | Impact Factor value: 6.171 | ISO 9001:2008 Certified Journal
| Page 935
Primary Data:
The data regarding the opinion on the “Employee motivation” was collected from the employees through questionnaire, discussion with the employees.
Data Collection: The respondents in the study are 50 are all the faculty of Anurag Group of Institutions from different Disciplines.
Data Analysis:
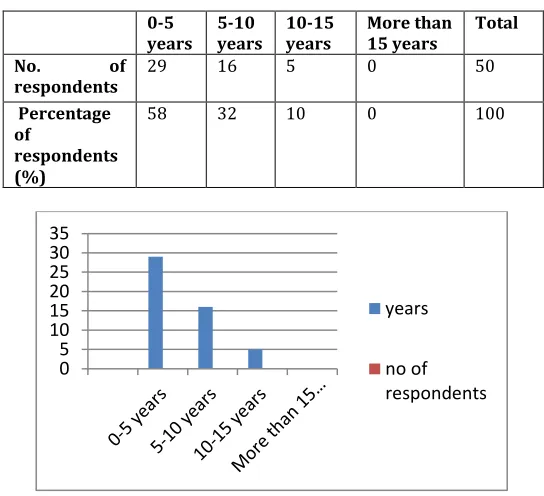
[image:2.612.313.578.142.396.2]1. Since how long employees are working in this organization.
Table No.1: Employees working in this organization.
0-5
years 5-10 years 10-15 years More than 15 years Total
No. of
respondents 29 16 5 0 50
Percentage of
respondents (%)
58 32 10 0 100
Figure No.1: Graphical representation working in this organization.
INTERPRETATION:
From the above graph most of the employees were working since 5 years because as they were comfortable with the organization culture. Employees are satisfied with organization culture & the organizational does have a problem of retention.
2. Incentive that motivate employees.
Table No.2: Incentive that motivate employees.
Monetary
incentives Non-financial incentives Both Total No. of
respondents 45 4 1 50
Percentage of respondents (%)
90 8 23 100
Figure No.2: Graphical representation of incentives motivates employees.
INTERPRETATION:
From the above graph it is understood 90% of employees are financial incentives motivates more than the non-financial incentive.
3. Factor that De-motives at work place.
Table No.3: Factors that De-motives at work place.
Company
policy Work environment Other factors Total No. of
respondents 2 7 41 50
Percentage of respondents
(%)
4 14 82 100
0 5 10 15 20 25 30 35
years
no of respondents
0 10 20 30 40 50
No. of respondents
[image:2.612.29.301.295.543.2]© 2017, IRJET | Impact Factor value: 6.171 | ISO 9001:2008 Certified Journal
| Page 936
Figure No.3: Graphical representation of De-motive at work place.
INTERPRETATION:
From the above graph it is observed there are other factors which de-motivates at work place. Like conflicts at work place, miscommunication, workload & stress.
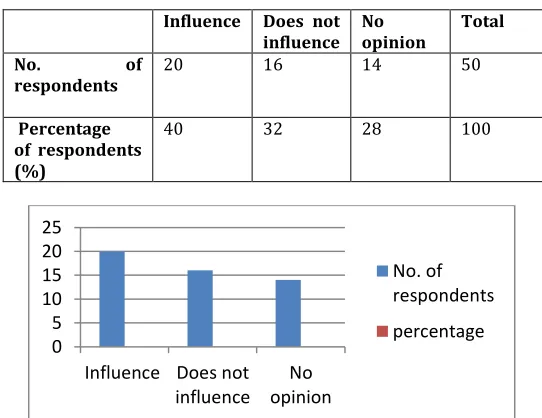
[image:3.612.60.285.94.214.2]4. The incentives and other benefits will influence your performance.
Table No.4: The incentives and benefits will influence your performance.
Influence Does not
influence No opinion Total
No. of
respondents 20 16 14 50
Percentage of respondents (%)
40 32 28 100
Figure No.4: Graphical representation of incentives and other benefits will influence your performance.
INTERPRETATION:
From the above graph most of the respondents expressed dual opinion towards the influence of benefits on their work
performance, so the employees are satisfied with the present incentives and benefits of the organization
5. Management involves you in the decision making which are connected to your department
Table No.5: The decision making which are connected to your department.
Yes No Occasionally Total
No. of respondents 23 14 13 50
Percentage
of respondents (%) 46 28 26 100
[image:3.612.316.577.199.387.2]
Figure No.5: Graphical representation of management involve you in the decision making which are connected
to your department.
INTERPRETATION:
Form the above graph 40% of the employees felt management involved them in decision making and management should focus more on grievances of employees.
6. Management is really interested in motivating the employees.
Table No.6: Management is really interested in motivating the employees.
Strongly
agree Agree Neutral Dis–agree Total No.of
respondents 28 18 3 1 50
Percentage of
respondents (%)
56 36 6 2 100
0 10 20 30 40 50
no if respondents
percentage
0 5 10 15 20 25
Influence Does not influence
No opinion
No. of respondents
percentage
0 5 10 15 20 25
[image:3.612.29.300.395.604.2]© 2017, IRJET | Impact Factor value: 6.171 | ISO 9001:2008 Certified Journal
| Page 937
Figure No.6: Graphical representation of management is really interested in motivating the employees.
INTERPRETATIONS:
From the above graph most of the respondents strongly agree that the management is really interested in motivating the employees.
7. Were the employees satisfied with the incentives provided by the organizations.
Table No.7: Employees are satisfied with the incentives provided by the organizations.
Highly satisfie d
satisfie d
Neutra
l Dis–satisfie d
Tota l
No.of
respondent 11 33 3 3 50
Percentage of
respondent s (%)
22 66 6 6 100
Figure No.7: Graphical representation of employees satisfied with the incentives provided by the
organizations.
INTERPRETATION:
From the above graph 66% of respondents are satisfied with the present incentives provided by the organization as they are reward for their merit.
[image:4.612.312.582.239.444.2]8. Are you encouraged to come up with new and better ways of doing things.
Table No.8: Encouraged to come up with new and better ways of doing things.
Strongly
agree Agree Neutral Dis–agree Total No.of
respondents 23 24 3 0 50
Percentage of
respondent
46 48 6 0 100
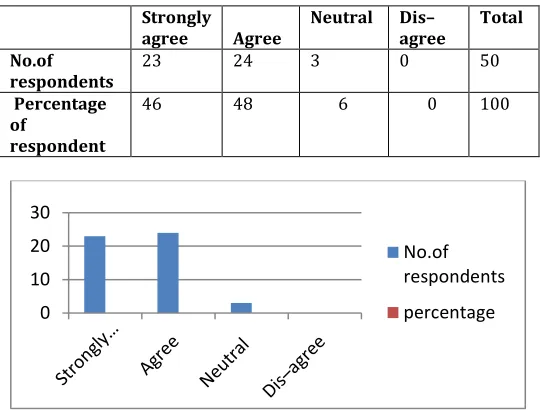
Figure No.8: Graphical representation of encouraged come up with new and better ways of doing things.
INTERPRETATION: From the above figure we can conclude that most of the employees agree that they are encouraged to come up with new and better ways of doing things in the organization.
[image:4.612.32.567.425.731.2]9. Management provides continuous feedback to improve their performance.
Table No.9: Management provides continuous feedback to improve their performance
0 5 10 15 20 25 30
No.of respondents
percentage
0 10 20 30 40
No.of respondents
percentage
0 10 20 30
No.of respondents
percentage
Strongly
agree Agree Neutral Dis–agree Total No.of
respondents 23 24 2 1 50
Percentage of
respondents (%)
© 2017, IRJET | Impact Factor value: 6.171 | ISO 9001:2008 Certified Journal
| Page 938
Figure No.9: Graphical representation of management provide continuous feedback to improve their
performance.
INTERPRETATION:
The above figure represents most of the employees agree that, the management supported with the sufficient feedback for improving their performance.
10. Employees are satisfied with the quality of work in their organization.
Table No.10: Employees are satisfied with the quality of work in their organization
Figure No.10: Graphical representations of Employees are satisfied with the quality of work in their
organization
INTERPRETATION:
From the above graph, the most of the employee’s opinions towards the quality of work satisfactory as they had dual opinion strongly agree and agree.
[image:5.612.312.579.168.383.2]11. Motivation is the key for job satisfaction and performance Improvement.
Table No.11: Motivation is the key for job satisfaction and performance Improvement.
Figure No.11: Graphical representation of motivation is the key for job satisfaction and performance
Improvement.
INTERPRETATION:
From the above graph most of the employees were agree with the motivation is the important area for improving their performance and satisfaction.
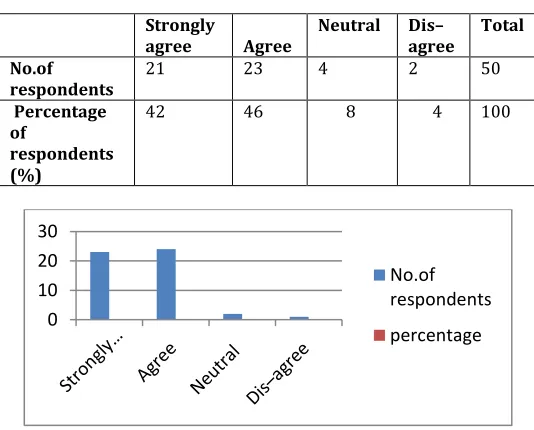
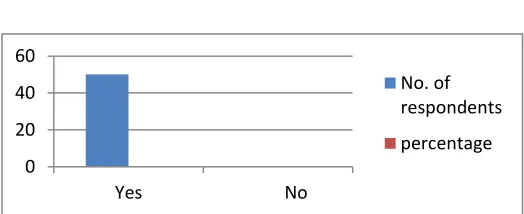
[image:5.612.35.303.441.558.2]12. Employee’s motivation influences the organization success.
Table No.12: Employees motivation influences the organization success.
Yes No Total
No. of respondents 50 0 50
Percentage
of respondents
(%)
100 0 100
0 5 10 15 20 25 30 35
No.of respondents
percentage
0 5 10 15 20 25
Strongly agree
Agree Neutral Dis–agree No.of respondents
percentage
0 10 20 30
No.of respondents
percentage Strongly
agree Agree Neutral Dis–agree Total No.of
respondents 21 23 4 2 50
Percentage of
respondents (%)
© 2017, IRJET | Impact Factor value: 6.171 | ISO 9001:2008 Certified Journal
| Page 939
Figure No.12: Graphical representation of employees motivation influence the organization success.
INTERPRETATION:
From the above graph number of respondents agree with the motivation is influence the by organization success or achieving the organization goals.
Results:
Most of the employees were working since 5 years
because as they were comfortable with the organization culture. Employees are satisfied with organization culture & the organizational does not have a problem of retention.
It is understood 90% of employees are financial
incentives motivates more than the non-financial incentives.
It is observed there are other factors which
de-motivates at work place. Like conflicts at work place, miscommunication, workload & stress.
Most of the respondents expressed dual opinion
towards the influence of benefits on their work performance, so the employees are satisfied with the present incentives and benefits of the organization.
40% of the employees felt management involved
them in decision making and management should focus more on grievances of employees.
Most of the respondents strongly agree that the
management is really interested in motivating the employees.
66% of respondents are satisfied with the present
incentives provided by the organization as they are reward for their merit.
We can conclude that most of the employees agree
that they are encouraged to come up with new and better ways of doing things in the organization.
Most of the employees agree that, the management
supported with the sufficient feedback for improving their performance.
The most of the employee’s opinions towards the
quality of work satisfactory as they had dual opinion strongly agree and agree.
Most of the employees agreed that motivation is the
important area for improving their performance and satisfaction.
The number of respondents agree with the
motivation is influence the by organization success or achieving the organization goals.
The organization maintains the good working conditions to their employees.
CONCLUSION
The study on employee motivation most of the employees mentioned that they will be motivated by monetary benefits, still organization can do better for the quality of work life of employees. Along with motivation, there are several other factors which de-motivate employees like conflicts, good interpersonal relationship with superiors, subordinates & colleagues.
The study concludes that, the motivational programs procedures at Anurag Group of Institutions are found effective but not highly effective. The study on employee motivation highlighted many factors which will help to
motivate the employees. Measurement, evaluation, and
recognition programs must be implemented continuously to gain an understanding of employees’ basic needs.
REFERENCES
Koontz, Weihrich & Aryasri, Principles of
Management, TMH, New Delhi, 2009.
Aswathappa, Human Resource Management, 4th
edition, TMH, 200
Golzadeh, E. 2010. “Factors Affecting Employee Job
Motivation in Organizations”. Management Central Website.
Gominian, V. 2004. “Ways to Increase Employee
Motivation in Workplace”. Journal of Work and Society 58.
Mohammad Zadeh, A., and A. Mehrvazhan. 1996.
“Organizational Behavior”. Tehran: Allameh
Tabatabaei University
0 20 40 60
Yes No
No. of respondents