© 2018, IRJET | Impact Factor value: 6.171 | ISO 9001:2008 Certified Journal | Page 2222
EVALUATION OF GROUNDWATER QUALITY OF COASTAL AQUIFER IN
SIRKALI BLOCK OF NAGAPATTINAM DISTRICT
Vijayachandran
1, Ravisankar
21
P.G.Student, Department of civil Engineering, Annamalai university, Chidambaram, India
.
2Assistant Professor, Department of civil Engineering, Annamalai university, Chidambaram, India
.
---***---Abstract
- Groundwater is an imperative source of water
supply throughout the world. Among the several reasons, the non-availability of potable surface water is predominant. Groundwater use in irrigation, industries, municipalities and rural homes continues to increase. The groundwater samples were assessed for its applicability in irrigation and drinking purposes. In this paper the suitability of groundwater for drinking and irrigation has been assessed in Sirkali Block of Nagapattinam district. A total of 9 groundwater samples were collected from coastal villages in the study area. The groundwater quality assessment has been carried out by evaluating the physico-chemical parameters such as pH, EC, TDS, HCO−3, Cl−, SO2−4SO42−, Ca2+, Mg2+, Na+ and K+. The test results are
compared with WHO standards and a statistical analysis was also done and correlated. The test results revealed that ground water of the study area found to be hard and alkaline.
Keywords: Groundwater, physico-chemical
parameters, water quality.
1.INTRODUCTION
Groundwater quality issues are gaining recognition as the groundwater depletion worsens. Nowadays the level of contaminants such as fluoride, arsenic, pesticides and insecticides is at an elevated level. There is a general belief that groundwater is purer and safer than surface water due to the protective qualities of the soil cover. Ground water quality has become an important water resources issue due to rapid increase of population, rapid industrialization, unplanned urbanization and flow of pollution from upland to lowland and too much use of fertilizers, pesticides in agriculture (Joarder et al, 2008). Pollution of water is due to increased human population, industrialization, use of fertilizers in agriculture and manmade activity (Rao et al, 2012). The physico-chemical parameters of water play a significant role in classifying and assessing water quality. It is the fundamental duty of every individual in this world to conserve water resources. The ground water quality is normally characterized by different physic chemical characteristics. These parameters change widely due to the type of pollution, seasonal fluctuation, ground water extraction, etc. Monitoring of water quality levels is thus important to assess the levels of pollution and also to assess the potential risk to the environment (Muthulakshmi et al, 2013).
Change in ground water levels with respect to mean sea elevation along the coast largely influences the extent of sea water intrusion in the fresh water. Its use in irrigation, industries and domestic usages continues to increase where perennial surface water source are absent. Climate change and sea level rise exacerbated saltwater intrusion, thereby jeopardizing water use safety, especially during the dry season (Li et al, 2009 and Chen et al, 2002). Saltwater intrusion occurred globally in more than 50 countries and regions, particularly North Africa, the Middle East, the Mediterranean, China, Mexico, and the Atlantic and Gulf Coasts of the United States, including Southern California (Lie et al, 2010).
Correlation among water quality parameters greatly facilitates the task of rapid monitoring of water quality (Anwar and Vanitha 2014).
The quality of water may depend on geology of particular area and also vary with depth of water table and seasonal changes and governed by the extent and composition of the dissolved salts depending upon source of the salt and soil. Good drinking water quality is essential for the well being of all people which has affected the major health and economic status of the population. One of the most significant environmental problems in coastal Tamilnadu, is the increase in salinity of the groundwater. In order to study the groundwater quality and its variation in coastal aquifer in Sirkali Block of Nagapattinam district a statistical approach is carried out. In this approach a linear analysis is considered in which the water quality kept preceding concern. In this analysis the coefficient of correlation is found out in order to identify the variation between the water quality parameters. The water quality parameter considered for the statistical analysis is pH, EC, TDS, HCO−3, Cl−, SO2−4SO42−, Ca2+, Mg2+, Na+ and K+.
2. STUDY AREA
© 2018, IRJET | Impact Factor value: 6.171 | ISO 9001:2008 Certified Journal | Page 2223 The town experiences long summers and short winters
and receives an average yearly rainfall of 1,250 mm mainly from the north-east monsoon between October and December. Its close proximity to the sea means that Sirkazhi receives more rainfall than neighbouring towns. Sirkazhi is part of the Cauvery delta region and has irrigation channels, called the Kollidam channels, which carry water from the rivers and provide a rich deposit of fertile silt before reaching the sea. The soil is black and contains fertile alluvial sediment. The area's main crop is rice and other crops grown in the area are coconut, tamarind and neem. The landscape mostly consists of plain lands with fields and small portions of scrub jungle. Antelope, spotted deer, wild hog, jackal and fox are present in the jungles and outlying areas of the town. Crow and ordinary game birds are found in large numbers in the town.
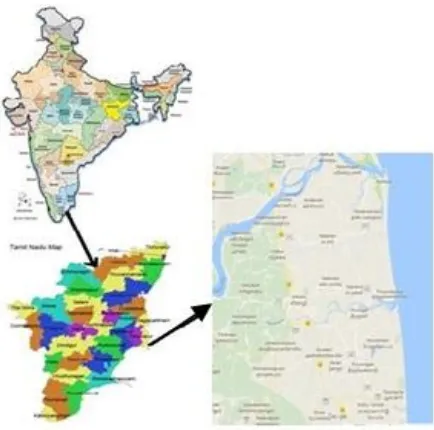
[image:2.595.319.553.95.236.2]The 2004 Indian Ocean earthquake was an undersea megathrust earthquake that occurred on 26 December 2004, with an epicentre off the west coast of Sumatra, Indonesia, triggering a series of devastating tsunamis along coastal fringes of the Indian Ocean. Nagapattinam district was the most affected part of Tamil Nadu, accounting for 6,064 off the 8,009 casualties in the state. Sirkazhi remained mostly unaffected by the tsunami, but the groundwater quality deteriorated where aquifers were close to the water bodies. There was heavy salt water intrusion inlands.
Fig -1: Location Map of Coastal Village
3.MATERIALS AND METHOD
[image:2.595.55.272.430.645.2]A total of 9 water samples were collected in pre monsoon (September and October) season during in the year of 2017. The samples were collected as per the standard method prescribed for sampling. Sampling was carried out without adding any preservative. The sampling locations are given in Table 1.
TABLE- 1: Sampling Locations
Samples were analyzed to determine the concentration of pH, EC, Total alkality, Total hardness, carbonate, Bi carbonate, Chloride, Sulphate, Sodium, Calcium, Potassium, Magnesium, TDS, Nitrate, Na% in the Environmental laboratory of annamalai university. All the test were conducted in accordance with the techniques described by Bureau of Indian standards (BIS):10500 pH was measured by digital pH meter model no: 335, make in systronics – Ahmadabad India. Electrical conductivity (EC) and total dissolved solids (TDS) were measured with analyzed digital EC model no: 304, Type CD :10, Nitrate and Sulphate were determined by spectrophotometer (model no: 106). Sodium, Calcium, Potassium, Magnesium was analyzed for Flame photometer model no: 126 and FPM –compressor 126, Type no: 126. Salinity was analysis for the hand refract meter. The various statically analyses of the experimental data were performed using Microsoft Excel 2007.The results obtained were assessed in accordance with the standards prescribed under Indian standard drinking and irrigation water specification BIS: 10500-2012. Table 2 shows the drinking water quality standards prescribed by BIS: 10500-2012.
TABLE - 2: Drinking Water Quality Standards(BIS: 10500-2012)
Sl.No Parameter Limits
1. pH 6.5
2. EC -
3. Potassium -
4. TDS 500
5. Turbidity 10
6. Total Alkalinity 200
7. Total Hardness 300
8. Calcium 75
9. Magnesium 30
10. Sodium 200
11. Iron 0.3
12. Manganese 0.1
13. Chloride 250
14. Fluoride 1.5
15. Sulphate 200
16. Nitrate 45
Sl. No Sample place (Area) Lattitude Longitude
1 Kodiyampalayam 11.2423 79.4843
2 Pudupattinam 11.2133 79.4916
3 Thandavakulam 11.1908 79.4924
4 Vettangudi 11.1722 79.4926
5 Thirumullai vaasal 11.1523 79.4956
6 Thennampattinam 11.1315 79.5013
7 Perunthottam 11.1150 79.5026
8 Kaveripoompattinam 11.0955 79.5051
[image:2.595.325.556.561.780.2]© 2018, IRJET | Impact Factor value: 6.171 | ISO 9001:2008 Certified Journal | Page 2224
4
.
RESULTS AND DISCUSSION
The experimental results groundwater samples of Sirkali block are compared with BIS Standards and presented in Table 3. Considerable deviations are observed in the water quality parameters from the standard limits.
4.1 pH
The permissible limits of drinking water are 7.0 - 8.5. In absence of any alternate source, water with pH 6.5 - 9.2 can be used. The pH values of the samples in Sirkali block ranges from 7.02 to 7.95 with average 7.24 during pre-monsoon and 6.92 to 7.78 with average 7.18 during post-monsoon. The test results revealed that the groundwaters are slightly alkaline in nature.
TABLE – 3: Comparison of Groundwater of Sirkali block with BIS Standards
Sl.No Parameter
Mean Standard Deviation
Mean Standard Deviation
BIS:
10500-2012 Limits
Pre-Monsoon Post Monsoon
1. pH 7.24 0.28 7.18 0.30 6.5 – 8.5
2. EC 2264.44 1705.80 1677.78 1445.12 -
3. Hardness Total 424.00 242.72 335.11 240.23 300
4. Chloride 713.78 709.46 570.67 571.18 250
5. Sulphate 97.44 48.55 133.33 84.43 200
6. Sodium 395.41 270.65 305.06 151.43 200
7. Calcium 159.90 91.29 47.60 40.35 75
8. Potassium 74.79 86.81 72.94 99.32 -
9. Magnesium 264.83 151.61 209.30 150.04 200
10. TDS 1471.89 1108.77 1090.56 939.33 500
11. Nitrate 8.94 0.66 4.64 3.26 45
Except pH and EC, other units mg/L
4.2 EC
The temporal changes in ground water quality were determined taking EC as the genera indicator of quality. EC is the measure of salinity which greatly affects the taste and thus has a significant impact on the user
acceptance of the water as potable. The EC values of the
samples in Sirkali block ranges from 620 to 6200 with average 2264 during pre-monsoon and 140 to 4400 with average 1678 during post-monsoon. The test results revealed that the groundwater is slightly alkaline in nature. The test results inferred that the groundwater can’t be used for irrigation purpose. It may be due to the
dissolved inorganic solids into water which
subsequently percolated to these bore wells polluting the water.
TABLE - 4: Classification of Irrigation Water based on Electrical Conductivity
Type of Water Classification Electrical Condutivity (micromhos/cm)
Low saline Medium
Saline Highly Saline
Very Highly Saline
Excellent Good Permissible
Doubtful Unsuitable
100-250 250-750 750-2000 2000-3000 Over 3000
4.3 Total Dissolved Solids
According to BIS, the acceptable concentration of TDS in
groundwater for domestic purposes is 500 mg/L. The
TDS values of the groundwater samples in Sirkali block ranges from 403 to 4030 with average 1472 during pre-monsoon and 91 to 2860 with average 1091 during post-monsoon. During both monsoon periods the TDS value exceeds the permissible limits and thus the groundwater found unsatisfactory for bathing and washing purposes
.
4.4 Total Hardness, Calcium and Magnesium
Calcium and magnesium are important parameter for
total hardness of water. The acceptable limits of Ca2+ and
Mg2+ in water for domestic use are 75 and 200 mg/L
respectively. The Ca2+ values of the samples in Sirkali
block ranges from 75 to 360 with average 160 during pre-monsoon and 6 to 140 with average 47.60 during post-monsoon. The Mg2+ values of the samples in Sirkali
block ranges from 125 to 600 with average 265 during pre-monsoon and 75 to 480 with average 209 during post-monsoon. The test results revealed that, only during pre-monsoon period the hardness value found within the permissible limits and bring into being with the drinking water quality.
4.5 Chloride
Maximum permissible limit of chloride in portable water is 200 mg/L, which may further be extended upto 1000 mg/L in Indian conditions. The Chloride values of the groundwater samples in Sirkali block ranges from 112 to 2408 with average 714 during pre-monsoon and 64 to 1736 with average 571 during post-monsoon
.
4.6 Potassium
The potassium (K+) concentration of the water samples from Sirkali block is between 1.6 mg/L to 264 mg/L with a mean value of 75 mg/L during pre-monsoon and 13.5 mg/L to 328.2 mg/L with a mean value of 73 mg/L during post-monsoon
.
4.7Sulphate
© 2018, IRJET | Impact Factor value: 6.171 | ISO 9001:2008 Certified Journal | Page 2225 groundwater samples in Sirkali block ranges from 20 to
165 with average 97.44 during pre-monsoon and 30 to 315 with average 133 during post-monsoon. The average sulphate content during pr-monsoon and post monsoon was lower than maximum permissible prescribed limit.
4.8 Sodium
Sodium (Na+) concentration more than 50 mg/L makes the water unsuitable for domestic use and causes severe health problems. The average sodium concentration was 395.41 and 305.06 during pre-monsoon and post-monsoon respectively which was higher than the permissible limit.
4.9 Nitrate
Maximum permissible limit of Nitrate is is 45 mg/L, which may further be extended upto 1000 mg/L in Indian conditions. The Nitrate concentration of the groundwater samples in Sirkali block ranges from 7.6 to 9.9 with average 8.94 during pre-monsoon and 0.2 to 9.1 with average 4.64 during post-monsoon In both periods the values are within the permissible limit.
4.10 Correlation Co-efficient
[image:4.595.316.561.111.278.2]The correlation matrix for the water quality parameters during pre-monsoon and post-monsoon period of Sirkali block are given in Table 4 and 5. The pH shows positive correlation between EC, Chloride, Sulphate, Sodium, TDS and Nitrate but pH shows negative correlation between Total hardness, Calcium, Potassium and Magnesium during pre-monsoon season. The same negative correlation was achieved during post-monsoon season. Nitrate show maximum negative correlation with other water quality parameters during pre-monsoon season. During post monsoon season the Potassium shows maximum negative correlation with other water quality parameters.
TABLE - 5: Correlation coefficients of water quality parameters of groundwater During Pre-Monsoon Period
TABLE - 6: Correlation coefficients of water quality parameters of groundwater during post-monsoon period
5.
CONCLUSION
Comparing the mean values of groundwater quality parameters of sirkali block, it can be concluded that variables pH , EC, nitrate, chlorides, and sulphate are permissible limits in the standards in during pre-monsoon period showing an improvement in quality due to fresh recharge without pollution from external sources and clearly indicated in seasonal variation. TDS and hardness found allowable in the standard limit prescribed by BIS: 10500, reveals that the groundwater of the study area is hard and alkaline in nature in the ground water quality. Hence, groundwater quality analysis should be carried out from time to time to monitor the rate and kind of contamination. This would help to prevent the overall groundwater system. It is need to expand and promote awareness among the end users to maintain ground water quality. There is urgent need of adopting judicious management strategy to mitigate the problem of deteriorating ground water
quality in the study area.
REFERENCES
[1] APHA Standard Methods for Examination of
water and Wastewater 2005 21st edition, APHA, AWWA & WPCF, Washington DC.
[2] Anwar, K.M. and Vanita, A., 2014. Analysis of
groundwater quality using statistical techniques: A case study of Aligarh city (India). International journal of technical research and applications, pp.2320-8163.
[3] Chen, Z., Grasby, S. E. and Osadetz, K. G. 2002.
© 2018, IRJET | Impact Factor value: 6.171 | ISO 9001:2008 Certified Journal | Page 2226
[4] Joarder, M. A. M., F. Raihan, J. B. Alam, and S.
Hasanuzzaman., 2008. Regression analysis of ground water quality data of Sunamganj District, Bangladesh. International Journal of Environ. Res., Vol. 2, no.3, pp. 291-296.
[5] Li, Z., Zhang, C. and Zhu, W., 2009. The present
and analysis of the sea water intrusion in coastland of Rizhao, Hydrogeology and Engineering Geology, vol. 36, no. 5, pp. 129–132, 2009.
[6] Liu, D., Chen, X., and Lou., Z, 2010. A model for
the optimal allocation of water resources in a saltwater intrusion area: a case study in Pearl River delta in China, Water Resources Management, vol. 24, no. 1, pp. 63–81.
[7] Muthulakshmi L., Ramu A., Kannan.N., and
Murugan A., 2013. Application of correlation and regression analysis in assessing groundwater quality. International Journal of ChemTech Research, Vol.5, No.1, pp. 353-361.
[8] Rao, Mushini Venkata Subba, Vaddi Dhilleswara
Rao and Bethapudi Samuel Anand Andrews, 2012. Assessment of Quality of Drinking Water at Srikurmam in Srikakulam District’, Andhra Pradesh, India, International Research Journal of Environmental Science, Vol. 1, No. 2, pp. 13-20 .
BIOGRAPHIES
Vijaychandran N
P.G.Student
Department of Civil Engineering Annamalai University
Dr. N. RAVISANKAR
Assistant Professor