© 2018, IRJET | Impact Factor value: 6.171 | ISO 9001:2008 Certified Journal | Page 975
Fuel cell based distributed generation using Re-lift Luo converter
Vijayalakshmi A
1Independent scholar, Power Electronics and Industrial Drives, No.25,Dr.Varadarajan street, Vedachalam Nagar, Chengalpet, Tamilnadu, India,
---***---Abstract – In this paper fuel cell based distributed generation for driving the brushless dc motor is presented. The low voltage extracted from the fuel cell has been increased to the utility voltage using re-lift Super-lift technique. The proposed converter with a simple structure effectively enhances voltage transfer gain, promising high efficiency and power density solution using single active switch, producing reduced ripple voltage and current. The working operation of the proposed converter has been discussed in detail. The Solid oxide fuel cell (SOFC) mathematical modeling has been presented for constant fuel utilization. Both the open-loop and closed loop control strategies are presented under different load-torque condition for the drive system. The conventional PI controller is devised for closed loop control operation and its performances are evaluated using Simulink/ Matlab platform.
Key Words: Distributed generation, Relift super-lift
technique, SOFC, Constant fuel utilization.
1. INTRODUCTION
The progress of any nation primarily depends on the energy sector which paves way for socio-economic up-liftment of the people. But the ever-demanding energy consumption threatens the depleting conventional fossil fuels, increasing global warming and greenhouse gas emissions. So energy harnessing should be met by other alternate renewable energy sources to curtail the energy crisis problem and global warming issues. Fuel cell technology is one among the renewable promising a safe, clean, eco-friendly, reliable and sustainable energy solution. They are electrochemical devices that convert chemical energy into electrical energy directly in a single stage processing. Thus they are simpler, flexible, and modular when compared to conventional power plants. They operate silently without any moving parts and combustion of gas resulting zero emission of greenhouse gases. The other advantages include their placement sites independent of geographic boundaries, not intermittent in nature, featuring high efficiency, even at part-load conditions. Thus they are suitable for power generation promoting the energy security and can be connected to the power grid to provide supplemental power. They also function as a standalone on-site power generator for ranches, dairy farms, flower growers and residences which are located far off from the power utilities [1].
1.1Problem Statement
A dc-dc converter accepts a low voltage, high current input from the fuel cells and convert the power to a high
voltage output [3].But this green technology powered by the fuel cell is limited by itssluggish response to the sudden load changes [10] with high ac ripples in its output dc voltage. So the major challenge lies in the development and selection of a suitable ripple mitigating power conditioning unit (PCU) to compensate for these limitations and its applicability to interface to the power utility applications. The PCU is thus the prime topic of this paper.
1.2 Power Conditioning Unit
The success of the power conditioning unit vests in the performance of the dc-dc converter to meet the demand requirements, ability to cope with the fuel cell behavior ensuring safe and stable operation despite the voltage variations. The transformer based DC-DC converters such as fly-back converter, push-pull converter, forward converter, half-bridge converter, bridge converter, and Zeta converter suffer from reduced overall operating efficiency due to leakage inductance, core loss.The inclusion of a transformer increases the operational cost, installation space and weight. They add objectionable ripples in the current flowing out of the fuel cell [8], besides the power switch of these converters is subjected to high voltage stress due to the leakage inductance of the transformer. Hence transformer-less DC-DC converters are of prime choice.
2. PROPOSED CONVERTER TOPOLOGY
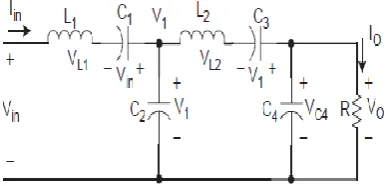
Fig -1: P/O SL Luo converter Re-lift circuit
[image:1.595.350.517.517.593.2]© 2018, IRJET | Impact Factor value: 6.171 | ISO 9001:2008 Certified Journal | Page 976 reducing the circuit control complexity, gate drive
requirements, switching losses thus enhancing the converter efficiency, involving less no of protective circuits, cooling, making the converter simple, compact in size.The positive output super-lift Luo re-lift converter shown in Fig.1 consists of only one static switch S, five diodes, four capacitors and two inductors.
2.1 Circuit Operation
Fig -2: Equivalent circuit of the converter during switch-on mode of operatiswitch-on
When the power switch S is turned on, the diodes D1, D3,
D4 are on and the equivalent circuit during switch-on
condition is obtained. During switch-on period, the first elementary power stage composed of L1-D1-D3-C1 is charged
by the input source voltage Vin. The voltage V1 which is the
output voltage of the elementary power stage appears across capacitor C2.It is given by
VC2 =V1= Vin (1)
The voltage re-lift power conversion is obtained by the topology formed by the inductor L2 and the capacitor C3 to
form a parallel connected pump circuit (super-lift pump) to absorb the stored energy from the preceding stage of the capacitor C2.Thus the capacitor C3 is charged to V1 during
the switch on mode period.
Fig -3: Equivalent circuit of the converter during switch-on mode of operatiswitch-on
When the power switch S is turned off, the diodes D2, D5 are
on and the equivalent circuit during switch-off condition is obtained. During switch-off mode of operation, L1 is in series
with capacitor C1 in the first power stage. The energy stored
in the elementary Luo pump is transferred to the capacitor C2.The voltage V1 which is the output voltage of the
elementary power stage appears across capacitor C2
Similarly L2 is in series with capacitor C3. The energy stored
in the second stage Luo pump of the re-lift circuit is
transferred to the capacitor C4.Now the relifted boost voltage
Vrelift appears across capacitor C4.It is given by
VC4 =Vrelift = 2 (2)
Thus the capacitors C1 and C3 function as storage capacitors. The capacitors C2 and C4 act as support capacitors. During switch-on mode of operation, the current in inductor L2 increases with voltage V1 for a period of kT while it decreases with voltage (Vo-2V1) for a period of (1-k) T during switch-off mode of operation. = (3)
The output voltage Vo is given by Vo = ( ) V1 (4) The output voltage Vo in terms of input voltage is given by Vo = ( )2 Vin (5)
The Voltage transfer gain is M = = (6)
Hence, the expressions for ripples in inductor current and current through inductor are obtained as under. The peak to peak current ripple in the inductor is the same during steady state operation and it is given as: ΔiL2 = = (7)
L2 = Io = (8)
ΔiL1 = (9)
IL1 = (10)
Therefore the variation ratio of inductor current L1 is ξ1 = = = (11)
Similarly the variation ratio of inductor current L2 is ξ2 = = = = (12)
[image:2.595.67.261.187.259.2] [image:2.595.62.256.518.611.2]© 2018, IRJET | Impact Factor value: 6.171 | ISO 9001:2008 Certified Journal | Page 977
3. SYSTEM DESCRIPTION
Fig -4: Block diagram of the proposed system
Figure 4 shows the general block diagram of the proposed system. The proposed fuel cell geared drive system consists of a Solid Oxide fuel cell stack, re-lift Luo converter, inverter with a control circuit for driving the Brushless-dc motor coupled load.
3.1 Solid Oxide Fuel Cell
SOFCs are highly instant reactive efficient fuel cell variants which reduces corrosion and heat management problems. It paves way for a more economical system using Ni in place of costly Platinum, thus tolerating carbon monoxide emission and its flexibility to feed any other forms of fuel, either hydrogen or hydrocarbon derived fuels.
Each of the electrode reactions constitutes a half-reaction [4].
Anode Reaction : H2 + O2- → H2O + 2e- (14)
Cathode Reaction: O2 +2e- → O2- (15)
The overall chemical reaction that takes place inside the fuel stack is given as
H2 + O2 → H2O (16)
The assumptions made for the fuel cell model are given as: • The fuel cell reactions are assumed to be in equilibrium. • The cathode and anode inlet and exit temperature of the fuel cell is assumed to be equal.
• The gases behave as ideal gases. • Gas leakage is negligible.
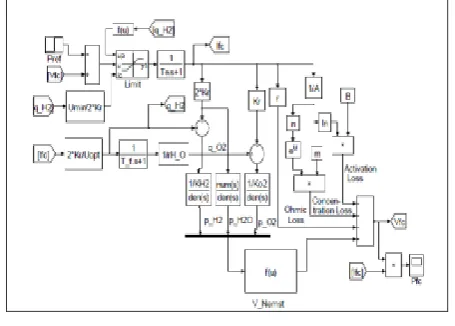
3.2 Solid Oxide Fuel Cell Mathematical Modeling
The developed SOFC model is based on the reference [9]. Gibbs’ free energy is referred to as the energy extracted from the fuel cell to do external work, regardless of any change in pressure or volume of the fuel reactants and products. Under standard operating conditions of temperature of 25°C and pressure of 0.1 MPa the change in Gibbs’ free energy of formation per mole is given as
Fig -5: SOFC mathematical modelling
Δ = H2O - H2 - O2 (17)
The reversible open circuit voltage in terms of the Gibb’s free energy of formation is given as
Eo= - where F =96.487x10⁶ J/kmol (18)
The change in Gibbs’fre energy Δ varies from its STP value with changes in pressure and temperature which eventually leads to change in stack voltage of the fuel cell.
Δ = Δ o – RT ln (19)
Where R- Universal gas constant=8314 J/ (kmol K) T - Operating temperature
pH2 - partial pressure of hydrogen
pO2 - partial pressure of oxygen
pH2O- partial pressure of water
Using (19) in (20) yields Nernst voltage at standard temperature with varying pressure values.
E = Eo + ln (20)
Fuel flow utilization factor is given from [5] as,
Uf =
= = (21)
Where qH2react -molar flow rate of hydrogen reacting with
the oxygen.
qH2inside -molar flow rate of hydrogen entering the anode.
[image:3.595.320.548.80.243.2] [image:3.595.39.287.89.223.2]© 2018, IRJET | Impact Factor value: 6.171 | ISO 9001:2008 Certified Journal | Page 978
pH2 (22)
Van - Volume of anode channel nH2 - hydrogen moles in the channel Taking the first-order derivative of the above equation yields, = = (23)
(24)
The amount of hydrogen reacts depends upon the demand load current and the total capacity of the no of cells connected in series with the stack which is given as, qH2react = (25)
Being No and 2F are numericals, qH2react α Ifc = 2KrIfc (26)
Where No - no of cells connected in series Ifc - fuel cell current Kr - modelling const = Upon substituting and integrating on both sides of the equation and upon Laplace transformation yields pH2 (27)
Similarly pO2 (28)
pH2O (29)
where τH2 = (30)
Nernst stack voltage is given from [6], Vfc = Efc – Vactivation – Vohmic –Vconc (31)
Where Efc = No {Eo + ln } (32)
3.2 Constant Fuel Utilization mode of Operation The fuel cell operation is carried out in constant fuel utilization mode.To prevent overused and underused fuel conditions, Uf is set between 0.8 and 0.9 for better performance [9]. So demand current Ifc is limited within the range ≤ Ifc ≤ (33)
The fuel utilization is maintained at about 85% for optimal performance by tracking the output stack current and adjusting the input fuel flow rate. qH2inside = (34)
3.3
Brushless DC Drive systemThe high performance featured work horse Brushless dc motor is chosen for our simulation study.Table.1 shows the switching logic used for electronic commutation.
Table -1: Switching logic in Brushless DC drive system
4. SIMULATION RESULTS
The simulation has been developed for the SOFC fed brushless drive system using re-lift Super lift technique with parameters listed in Table1, Table 2 and Table 3.
[image:4.595.44.277.433.608.2]Table -1: Proposed Converter parameters
Table -2: SOFC model parameters
Parametric indices Values
Universal gas constant 8314 J/(kmol K) Faraday’s constant 96.487x10⁶ J/kmol
Ideal standard potential 1.18 V Ohmic loss polarization for
each cell 3.2813x10⁻⁴ ohm
Absolute stack temperature 1273 K Air inlet temperature
(pre-heated) 773 K
Name of the
parameters Parametric Notation Value
Input voltage Vin 57 V
Output voltage Vout 513 V
Inductor L1,L2 100µH
Capacitor C1,C2,C3 5µf
Capacitor C4 100 µf
Switching frequency f 50 KHz
Conduction Duty ratio
range k 0.3 to 0.9
Used Conduction Duty
© 2018, IRJET | Impact Factor value: 6.171 | ISO 9001:2008 Certified Journal | Page 979 Fuel compressor pressure 100 psi
Air blower pressure 3 atm pressure Initial fuel cell stack current 100 A
No of cells arranged serially 65 Maximum fuel flow utilization 90% Minimum fuel flow utilization 80% Optimum fuel flow utilization 85%
Molar constant for hydrogen 8.43x10⁻⁴ kmol/S.atm
Molar constant for Oxygen 2.52x10⁻³ kmol/S.atm
Molar constant for water 2.81x10⁻⁴ kmol/S.atm
Ratio of hydrogen to oxygen 1.145 Response time of fuel processor 5 sec
[image:5.595.320.552.49.186.2]Electrical Response time 0.8 sec
Table -3: Brushless dc motor model parameters
Parametric indices Symbols Values
Stator resistance per
phase Rs 2.8750 ohm
Stator inductance per
phase Ls 8.5 mH
No. of poles pairs p/2 4
Moment of inertia J 0.8x10⁻³ Kgm2
Friction coefficient F 1x10⁻³ Nms
Voltage constant Kv 56.8335V/rpm
Torque constant KT 0.54372 Nm-A
Flux established by
magnets Ф 0.06784 V.s
4.1 Open loop control of BLDC motor
Fig -6: Open-loop control of the BLDC drive system
Case: 1Steady-state operating condition.
The simulation is performed for constant load torque of about 3 Nm and the performances are evaluated. Figure 7 shows the rotor speed of the drive system for the applied constant load torque.
[image:5.595.35.294.72.298.2]Fig -7:Rotor speed for constant load torque
[image:5.595.318.550.232.340.2]Figure 8 shows the drive generated electro-magnetic torque.
[image:5.595.35.288.331.518.2]Fig -8: Motor torque for constant load torque
[image:5.595.318.550.414.555.2]Figure 9 and figure 10 shows the corresponding stator per-phase current, back-emf waveforms and the inverter output voltage waveforms.
[image:5.595.55.275.559.654.2]Fig -9: Stator per-phase current, motor back-emf for constant load torque
[image:5.595.320.548.599.714.2]© 2018, IRJET | Impact Factor value: 6.171 | ISO 9001:2008 Certified Journal | Page 980 Figure 11 and figure12 shows the drive dc link voltage and
the proposed converter current.
[image:6.595.312.557.140.320.2]Fig -11: Drive dc link voltage
Fig -12: Proposed converter current
Case 2: Dynamic load torque disturbances
[image:6.595.37.287.144.356.2]The simulation is performed for load torque variation of 0 Nm to 1 Nm and to 3 Nm at time t=0 sec, 1 sec and 2 sec respectively and the drive’s response is studied under open loop system. The observed changes are the drop in inverter output voltage shown in figure 13, dynamic speed changes of the rotor seen in figure 14.
Fig -13: Drop in inverter output voltage from the time of load torque variation
Fig -14: Speed variation due to load torque disturbances
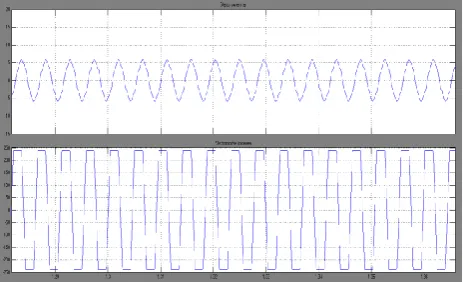
Figure 15 shows the corresponding changes in stator currents and the back-emf waveforms and the figure 16 shows the dynamically developed motor torque under variable load torque conditions.
[image:6.595.313.557.325.426.2]Fig -15: Stator per-phase current and the back-emf waveform variation
Fig -16: Developed motor torque under variable load torque condition
[image:6.595.41.283.489.594.2]4.2 Closed loop Speed control of BLDC motor
Fig -17: Closed loop simulation with PI control.
To tackle the load torque disturbances and source voltage variations, to have a constant speed control for the drive PI controller is implemented. The PI controller parameters chosen are Kp =0.001205 and Ki = 0.018. The desired
[image:6.595.324.551.495.664.2] [image:6.595.39.284.639.743.2]© 2018, IRJET | Impact Factor value: 6.171 | ISO 9001:2008 Certified Journal | Page 981 which is the difference between the actual and desired
speeds is given to the PI controller, which adjusts the duty cycle of the PWM generator which in turn adjust the corresponding re-lift Luo converter voltage required to maintain the desired speed.
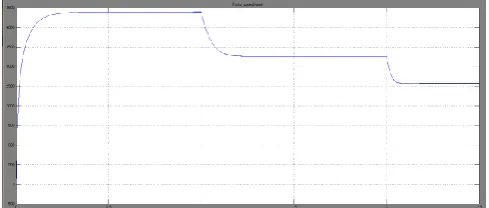
[image:7.595.316.552.136.365.2]The load torque variation is presented at about t=1 sec from 0 Nm to 3 Nm. and from 3 Nm to 5 Nm at t=2 sec. The PI controller is able to dynamically handle these changes and thus robust in its control action maintaining the speed to the set speed reference.
Figure 18 shows the constant drive speed accomplishment of PI controller control action under dynamically load torque variations.The desired speed is attained with the transients vanishing out quickly for every torque variations.
[image:7.595.41.283.272.377.2]Fig -18: PI control producing constant drive speed
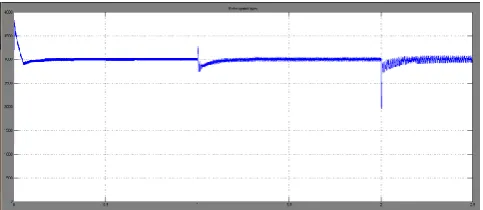
Figure 19 and figure 20 shows the motor’s stator per-phase current,back-emf per-phase waveform and the developed drive toque.
Fig -19: motor’s stator phase current ,back-emf per-phase waveform
Fig -20: Developed drive toque
The FFT analysis shown in the figure 21 was performed for the drive output voltage and the THD observed was 3.83% which is well below 5% of the IEEE standard of harmonic limits.
[image:7.595.305.564.438.648.2]Fig -21: FFT analysis for the output voltage for the developed system
Table -1: Performances indices of the proposed P/O SL Luo converter Re-lift circuit
Parameter Results
Obtained
Vfuel cell 57 V
Ifuel cell 200 A
Output voltage V0 513 V
Voltage transfer gain M 9
Peak to peak current ripple ΔiL1 1.71 A
Peak to peak ripple current ΔiL2 0.57 A
Steady state current in L2, IL2 400 A
Steady state current in L1, IL1 133.33 A
Variation ratio of inductor current L1, ξ1 2.137 x 10⁻³
Variation ratio of inductor current L2, ξ2 2.137 x 10⁻³ Variation ratio of the output voltage, Є 1.267 x 10⁻⁴
5. CONCLUSION
[image:7.595.38.287.455.601.2]© 2018, IRJET | Impact Factor value: 6.171 | ISO 9001:2008 Certified Journal | Page 982 controller has the ability to cope with the slow fuel cell
behavior, satisfies the dynamic load demand requirements ensuring safe, stable operation and accomplishes a desired speed control for the drive system. Thus the proposed re-lift Luo converter can be considered as an efficient interface for Solid oxide fuel cell distributed generation.
REFERENCES
[1] Muhammad H. Rashid “Power Electronics Handbook”, second edition Pg.: 322-323.
[2] Fang Lin Luo and Hong Ye “Advance DC/DC Converters”. CRC Press, London, U.K. Pg:38-41
[3] Kyle Sternberg Hongwei Gao, “A new DC/DC converter for solid oxide fuel cell powered residential systems”, IEEE Transactions, 2009.
[4] B.K.Singh, D N Gaonkar, R S Aithal, “Development of Solid Oxide Fuel Cell Model”, International Journal of Applied Engineering Research (IJAER),vol. 4, no. 8, 2009, pp. 1543–1556.
[5] Subhajit Roy, “Model Implementation and Performance Analysis of Solid Oxide Fuel Cell as a Micro Source in Micro Grid Modelling,”International Research Journal of Engineering and Technology,Vol.2 no. 5,May-2015
[6] Nagpal, M. and Moshref, A. et al. “Experience with testing and modeling of gas turbines", Proceedings of the IEEE/PES Winter Meeting, Columbus, Ohio, USA, pp. 652-656 (2001).
[7] P. Vijay, Arun Kumar Samantaray , “Constant Fuel Utilization Operation of a SOFC System: An Efficiency View point”, Journal 7(4), 2010.
[8] Seyezhai R, “Modeling and development of hybrid Cascaded multilevel inverter for Fuel cell power conditioning system”, Pg: 29, 2010.
[9] Y. Zhu and K. Tomsovic, “Development of models for analyzing the load following performance of micro-turbines and fuel cells”, Journal of Electric Power Systems Research, Vol. 62, No. 1, May 2002, pp. 1−11.