© 2018, IRJET | Impact Factor value: 6.171 | ISO 9001:2008 Certified Journal | Page 3221
STUDY ON STRENGTH CHARACTERISTICS OF KUTTANAD CLAY BASED
ON ITS WATER CONTENT AND CONSISTENCY LIMITS
Jipsymol Chacko
1, Dipty Sarin Jacob
21P.G. Student, Department of Civil Engineering, Saintgits College of Engineering, Kerala, India 2Assistant Professor, Department of Civil Engineering, Saintgits College of Engineering, Kerala, India
---***---Abstract –
In Kuttand region shear strength of the soil isless due to its very high initial moisture content and plasticity. It is an important property and is used to determine the bearing capacity of the soil. The main objective of the paper is to study the shear strength characteristics of remolded Kuttanad clay using the soil parameters such as water content, liquidity index, consistency index and water content ratio. This paper discusses relation between shear strength – water content, shear strength – liquidity index, shear strength – consistency index and shear strength –water content ratio. The correlation coefficient for each parameter is determined using R – software. The results shows that the shear strength is better correlated with liquidity index and water content ratio. The correlation coefficient for this parameter is 0.97.
Key Words: Remolded samples, Shear strength, Liquidity index, Consistency index, Water content ratio, Correlation coefficient.
1. INTRODUCTION
Kuttanad is the small region covering Alappuzha district. Kuttanad containing an area of about 1100sq.km in Kerala and the ground surface is below the sea level. The soil in this region is very soft, highly compressible and it contain high organic content. Due to these properties it severely affected the strength properties of the soil. The low shear strength and very high natural moisture content of Kuttanad clay made it poor foundation matrial, The main parameter which influences the soil strength are soil plasticity and moisture content. The strength characteristics of the soil varies widely from plastic to liquid limit of the soil. At plastic limit of the soil shear strength is maximum and at liquid limit shear strength is less.
Soil parameters like liquidity index, consistency index, and water content ratio are used to study the undrained shear strength of remolded samples. For the study remolded samples are used. Remolded samples are representative samples which are molded at different water content. For remolded samples these parameters are vary because samples are molded at different water content ranging from plastic to liquid limit.
Liquidity index and consistency index are the terms related to water content and it require only liquid limit and plastic limit values. Similarly water content ratio is another important property in order to determine the undrained shear strength. Water content ratio is the ratio between water content and liquid limit. It require only liquid limit of the soil.
In this study, series of vane shear test were conducted for the determination of undrained shear strength of remolded soil samples. 60 soil samples of different water content are tested in laboratory vane shear apparatus. The main advantage of this test is that shear strength at fully saturated condition is determined easily. For this study vane shear test conducted at different water content, i.e., from plastic limit to liquid limit. The shear strength obtained from laboratory vane shear shear test is nearly same as that of field vane shear test.
The main objectives of the paper is to study undrained shear strength of remolded Kuttanad clay. Water content, liquidity index, consistency index and water content ratio are used for the study. Using R – software calculate the correlation coefficient for each parameter and determine which parameter is more associated with the shear strength.
2. LITERATURE REVIEW
Beshy Kuriakose and Benny Mathews Abraham (2017) [1] studied the significance of water content ratio (WCR). The term water content ratio does not require plastic limit of the soil. The liquid limit to plastic limit ratio describes the relation between water content ratio and liquidity index. The test results shows that water content ratio is an effective substitute for liquidity index.
P J Varghese and S K Haigh (2017) [2] discusses about the parameter water content ratio (WCR) and check it is sufficient for studying behavior of undrained strength with different water content. The soil at particular water content for brittleness is not clear. From this results discussers concluded that soil behaviour at plastic range is not predict by using water content ratio. So in this case liquidity index is preferred.
Kamil Kayabali and Mustafa Fener (2015) [3] they redefine the Bjerrums correction factor. The authors validate the results of vane shear test with reverse extrution test. This study concludes that the undrained shear strength is better correlated with liquidity index only.
N Vijayakumar Raju and M Srimurali (2014) [4] they inferred that in strength behaviour consistency index have more effect. They concludes that for clayey soil plasticity index is more. So the undrained shear strength decreases as plasticity index increases.
© 2018, IRJET | Impact Factor value: 6.171 | ISO 9001:2008 Certified Journal | Page 3222 times that at the liquid limit. But in this paper researchers
conclude that the strength variation is not 100 times it can vary in different soil. The shear strength at liquid limit to plastic limit has a huge variation. So this study conclude that strength ratio can vary widely but not 100 times.
Ludic Trainer and Bomana Dubliner (2015) [6] the relation between untrained shear strength and water content is expressed by means of 2 unknown parameters which depends on soil composition and mineral content.
Binue Sharma and Padma K Bora (2003) [7] they relates plastic limit, liquid limit and shear strength values. This study lead to the redefinition of plastic limit. The results from the study shows that shear strength at plastic limit is hundred times that at the shear strength at liquid limit. The relation is shown to be a log linear and unique for a particular soil. This relation is valid for water content lower than plastic limit to higher than liquid limit.
3. MATERIALS
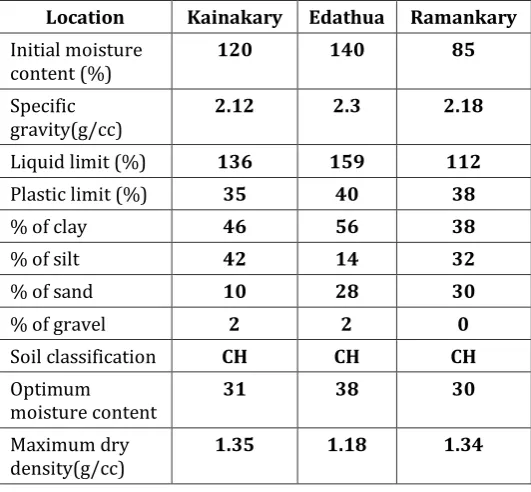
[image:2.595.31.297.398.644.2]The soft clay sample used in the study was collected from Kuttanad region, Alappuzha district, Kerala. The properties of clay samples are tabulated in table 1.
Table -1: Properties of collected clay samples.
Location Kainakary Edathua Ramankary Initial moisture
content (%) 120 140 85
Specific
gravity(g/cc) 2.12 2.3 2.18
Liquid limit (%) 136 159 112
Plastic limit (%) 35 40 38
% of clay 46 56 38
% of silt 42 14 32
% of sand 10 28 30
% of gravel 2 2 0
Soil classification CH CH CH
Optimum
moisture content 31 38 30
Maximum dry
density(g/cc) 1.35 1.18 1.34
The samples collected from different locations such as Kainakary, Ramankary, Edathua and collected from 2m below the ground level. For initial moisture content determination soil collected in an air tight container. The initial properties of 3 soil sites are determined. Initial tests include initial moisture content, specific gravity, liquid limit, plastic limit, hydrometer analysis and proctor compaction test.
4. METHODOLOGY
4.1 Vane shear test
Laboratory vane shear tests were conducted on 60 remolded samples of different water content. Vane shear test is conducted for the determination of undrained shear strength. The vane shear apparatus consist of four vanes which are welded together. The diameter and height of the vanes are 1.2cm and 2.4cm. Vanes are designed in such a way that it causes minimum disturbance and it does not deform under the maximum torque. Vane shear apparatus is either hand operated or motorized. The vane shear apparatus consist of a detachable cylindrical container. The sample is taken in cylindrical container and is placed properly in vane shear apparatus. Lower the vanes into the soil sample to a full depth and about 1cm below the soil sample. After that torque is applied through torque applicator. Angle of twist at the failure is noted. The vane shear test is conducted at different water content ranging from plastic limit to liquid limit. The vanes are cleaned after each test. The test is conducted in 3 soil samples (Ramankary, Kainakary, and Edathua). The care should be necessary while applying torque and inserting vanes into the soil sample. The torque obtained from the vane shear apparatus is in degrees it can be converted to kgfcm and then proceed calculations.
Samples prepared in wide range of water content ranging from plastic limit to liquid limit. Water content is determined for each sample using oven drying method. The corresponding liquidity index, consistency index and water content ratio are determined for each samples.
4.2 R – software
After the vane shear test analyze the test results using R – software. It is simple and more effective programming language. R software provides statical and graphical facilities so it become an effective data handling and storage handling language. Graphical plots showing shear strength relations are developed in R – software. The main purpose of R software is to check which parameter is more associated with shear strength. For this correlation plots are used. Correlation plots in R software are used to determine the association between two variables. It gives a matrix plot of correlation coefficient for two variable. Correlation plot in R software is obtained by installing the package corrplot.
5. RESULTS AND DISCUSSIONS
5.1 Shear strength relations
© 2018, IRJET | Impact Factor value: 6.171 | ISO 9001:2008 Certified Journal | Page 3223 The plot showing Shear strength – water content, Shear
strength – liquidity index, shear strength – consistency index and shear strength – water content ratio are discussed in this paper.
[image:3.595.309.553.110.252.2]5.2.1 Shear strength – water content
[image:3.595.37.278.224.348.2]Fig 5.1 shows the relationship of shear strength – water content. From this plot it is clear that shear strength decreases as water content increases.
Fig 5.1 shear strength – water content relation
5.2.2 Shear strength – liquidity index
[image:3.595.311.550.385.506.2]Fig 5.2 shows the relation between shear strength and liquidity index. The relation between these two are inversely proportional. Liquidity index increases as shear strength decreases.
Fig 5.2 shear strength – liquidity index relation
5.2.3 Shear strength – consistency index
The relation between shear strength and consistency index is direct relationship. When consistency index increases shear strength also increases which is shown in fig 5.3.
Fig 5.3 shear strength – consistency index relation
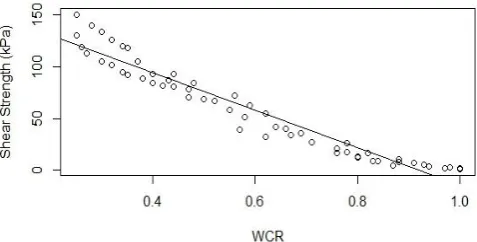
5.2.4 Shear strength – water content ratio
The relation between shear strength and consistency index is not a direct relation. i.e., water content ratio increases as shear strength decreases which is shown in fig 5.4.
Fig 5.4 shear strength – water content relation
Shear strength values varies widely from plastic to liquid limit. For liquidity index and consistency index the values vary from 0 to 1. Also from the data obtained from test results, the shear strength decreases as liquidity index increases and consistency index decreases. It shows that shear strength - consistency index relation is directly proportional. But for shear strength - liquidity index it is inversely proportional. At plastic limit liquidity index is zero and consistency index is 1. At liquid limit liquidity index is 1 and consistency index is 0. So, the liquidity index is zero means shear strength is high and liquidity index 1 means, shear strength is less. Similarly, consistency index zero indicates, shear strength is less and consistency index 1 indicates the shear strength value is more.
[image:3.595.37.273.488.611.2]© 2018, IRJET | Impact Factor value: 6.171 | ISO 9001:2008 Certified Journal | Page 3224 5.2 Correlation coefficient.
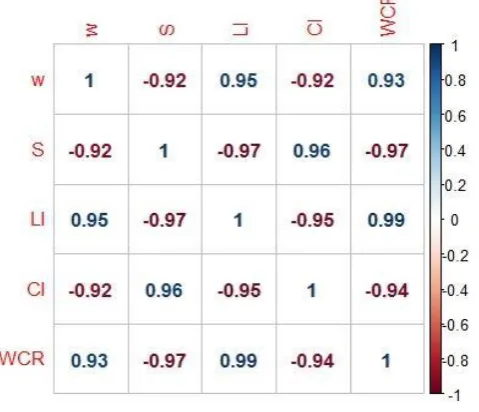
[image:4.595.46.286.253.459.2]Using R – software correlation coefficient for each parameter is determined. Correlation plot gives the clear idea of association between 2 variables. Correlation plot obtained from R – software is a matrix plot showing the relation. A correlation coefficient is a statistical measure of the degree to which changes to the value of one variable predict change to the value of another variable. The value of correlation coefficients are between -1 and 1. 1 indicates a strong positive correlation and -1 indicates a strong negative correlation. Also 0 indicates there is no relation between two variable. The correlation plot obtained from R – software is shown in fig 5.5
Fig 5.5 correlation plot
The correlation coefficient for shear strength - water content, shear strength – liquidity index, shear strength – consistency index and shear strength – water content ratio are -0.92, -0.97, 0.96, -0.97 respectively. The negative sign indicates that there is a strong negative correlation. It shows that, when shear strength increases water content, liquidity index and water content ratio are strongly decreases. The correlation coefficient for shear strength consistency index is 0.96. It is positively correlated i.e., shear strength increases with increase in consistency index.
6. CONCLUSIONS
Based on the detailed analysis carried out, the conclusions of this study are summarized as follows:
The test results shows that relations exists between shear strength values and the soil parameters such as water content, liquidity index and consistency index. The linearity in relationship is used for the formulation of an expression that gives the undrained shear strength of remolded soil.
From the graphs it clearly demonstrate that, shear strength decreases with increase in water content, liquidity index and water content ratio. So, there is an inverse relation exist. But for consistency index it is direct relation. i.e., shear strength increases as consistency index increases.
Correlation plot obtained from R - software shows that, the value of correlation coefficient for each parameter is close to1. So, the regression analysis using each parameters (w, LI, CI, and WCR) are best fit. The correlation coefficient for liquidity index and water content ratio are 0.97. So, they are more correlated.
These are useful for remolded samples of plastic limit ranges from 35% to 40% and liquid limit is in the range of 112% to 159%
REFERENCES
1. BeshyKuriakose, Benny Mathews Abraham, A. Sridharanand Babu T. Jose, ”Water Content Ratio: An Effective Substitute for Liquidity Index for Prediction of Shear Strength of Clays’;Geotechnical and geological engineering(2017)
2. P. J. Vardanega and S. K. Haigh, ”Discussion of Water Content Ratio: An Effective Substitute for Liquidity Index for Prediction of Shear Strength of Clays by Beshy Kuriakose, Benny Mathews Abraham, A. Sridharan Babu T. Jose”;Geotechnical and geological engineering (2017), 35, 3039-3044.
3. Shuying Wang, Ronaldo Luna, and Junsheng Yang, “Effect of Plasticity on Shear Behavior of Low-Plasticity Fine-Grained Soil”, Journal of materials in civil engineering 2017, 29 (3).
4. Kamil kayabali, Ozgur akturk, Mustafa fener, Orhan dikmen, “Revisiting the Bjerum’s correction factor: use of liquidity index for assessing the effect of soil plasticity on undrained shear strength”, Journal of rock mechanics and geotechnical engineering 7 (2015) 716 - 721.
5. N. Vijayakumar Raju , M. Srimurali , K. Nagendra Prasad, Functional Correlations between Compaction Characteristics, Un-drained Shear Strength and Atterberg Limits ; Journal of Mechanical and Civil Engineering , volume 11, issue 3, 2014, PP 109- 115.
© 2018, IRJET | Impact Factor value: 6.171 | ISO 9001:2008 Certified Journal | Page 3225
7. Xin Kang, Site Onyejekwe, Louis Ge, and Richard Stephenson; Spatial Variation and Correlation between Undrained Shear Strength and Plasticity Index; Geo-Frontiers (2011) 2631 – 2639.
8. Ludvik trainer, Bojana Dolinar and misha misic; Relationship between undrained shear strength, water content and mineralogical properties of fine grained soil; International journal of geomechanics 2005, volume 5, 350 – 355.
9. Binu Sharma and Padma k bora, “plastic limit, liquid limit and undrained shear strength of soil- reappraisal”, Journal of geotechnical and geo environmental engineering 2003, 129(8)774 - 777.
10. Brendan C. O Kelly, “Atterberg limits and remolded shear strength – water content relationships”, ASTM Geotechnical testing journal, volume 36, no.6, 939 – 947.
BIOGRAPHIES
Jipsymol Chacko PG Student
Dept. of Civil Engineering Saintgits College of Engineering Kottayam, Kerala