© 2017, IRJET | Impact Factor value: 5.181 | ISO 9001:2008 Certified Journal | Page 525
Data Analysis and Report Generation in Enterprise Mobility Solution
A.M.Ravishankkar
1, D.P.Sriridanya, N.Sarmila Devi, A.Sripriya, K.Santhoshini
21Assistant professor, Department of Computer Science and Engineering, Jay Shriram Group of Institutions, Tirupur Tamilnadu, India
2Student, Jay Shriram Group of Institutions, Tirupur Tamilnadu, India
---***---Abstract- Enterprise mobility is latest trend where
more employees working out of the office and using mobile devices and cloud services to perform business tasks. As these workers started using these devices in workplace for enterprise related activity, the need for Data analysis is increased in enterprise mobility solution. The role is to analyze enterprise data collected from multiple sources and present report to the Business manager so that they can make more informed decision. The analysis also helps to improve customer service where customer is served better on day today process. In this project data analysis and report generation is made using Drupal framework. The data are acquired from backend component using Restful web service. The data are in JSON format and it is converted to report format by using AmCharts API. The next step is to select the method to generate the report and it is submitted to the API’s for evaluation with visual analytics such as Google chart and Google analytics. The result of the analyzed data is taken for output using some user interface tools called HTML5 and CSS. We can generate the output according to the requirements of the end users like Tables, Graphs and Charts etc...
Key Words: Enterprise Mobility Solution, Data Analysis, Visualization, Report Generation, Amcharts API, Drupal Framework, Business Intelligence.
I. Introduction
Enterprise Mobility Management is the set of people, processes and technology focus on managing mobile devices, wireless networks, and other mobile computing services in a business context. E-commerce has evolved from simple websites into
providing support for end-to-end business and recently four technology areas have emerged, namely mobility, social media networks, cloud and analytics[1].Human mobility data can be potentially used in business intelligence-oriented systems, for providing added value commercial services or insight to internal enterprise[2]. With the rise of smartphones and tablets, the workforce began to shift toward mobility this made data analysis increasingly significant in enterprise mobility solution. Enterprise mobility is particularly prominent among companies that rely on field operations and field services to service end consumers, as well as in field sales operations.
The termData analysisrefers to the process of inspecting, cleansing, transforming and modeling data with the goal of discovering useful information, suggesting conclusions, and supporting decision-making[3]. The term Data visualization refers to presenting data in a pictorial or graphical format (chart, graph, diagram etc..) which enables the decision maker to see analytic present visually and helps them to take more informed decision and visual analytics is a very promising field of research[4].
© 2017, IRJET | Impact Factor value: 5.181 | ISO 9001:2008 Certified Journal | Page 526
II. MAIN CONCEPTS
A. Drupal Framework
Drupal is a free and open-source content-management framework written in PHP and distributed under the GNU General Public License It is used as a back-end framework for at least 2.1% of all Web sites worldwide ranging from personal blogs to corporate, political, and government sites including WhiteHouse.gov and data.gov.uk. It is also used for knowledge management and business collaboration.
The standard release of Drupal, known as Drupal core, contains basic features common to content management systems. These include user account registration and maintenance, menu management, RSS feeds, taxonomy, page layout customization, and system administration. The Drupal core installation can serve as a simple Web site, a single- or multi-user blog, an Internet forum, or a community Web site providing for user-generated content
B. JSON
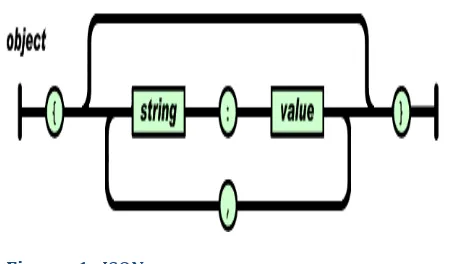
JSON (JavaScript Object Notation) is a lightweight data-interchange format. It is easy for humans to read and write. It is easy for machines to parse and generate. It is based on a subset of the JavaScript Programming Language, Standard ECMA-262 3rd Edition - December 1999. JSON is a text format that is completely language independent but uses conventions that are familiar to programmers of the C-family of languages, including C, C++, C#, Java, JavaScript, Perl, Python, and many others. These properties make JSON an ideal data-interchange language. JSON provides a higher level of flexibility and efficiency [6].
JSON is built on two structures:
•A collection of name/value pairs. In various languages, this is realized as an object, record, struct, dictionary, hash table, keyed list, or associative array.
•An ordered list of values. In most languages, this is realized as an array, vector, list, or sequence.
These are universal data structures. Virtually all modern programming languages support them in one form or another. It makes sense that a data format that
[image:2.612.321.547.158.290.2]is interchangeable with programming languages also be based on these structures
Figure -1: JSON
C. AmCharts
AmCharts is a private proprietorship focusing on development on mostly developer- oriented programming tools for data visualization – charts and maps. AmCharts is an advanced charting library that will suit any data visualization need. Amchart charting solution includes Column, Bar, Line, Area, Step, Step without risers, Smoothed line, Candlestick, OHLC, Pie/Donut, Radar/ Polar, XY/Scatter/Bubble, Bullet, Funnel/Pyramid charts as well as Gauges. The set includes serial (column, bar, line, area, step line, step without risers, smoothed line, candlestick and graphs), pie/donut, radar/polar, y/scatter/bubble, Funnel/Pyramid charts and Angular Gauges. The AmCharts offers unmatched functionality and performance in a modern, standards compliant package. JS charting library is responsive and supported by touch/mobile devices
Features of AMCHARTS:
(a)Supports All Modern Browsers
(b)Super and Powerful
© 2017, IRJET | Impact Factor value: 5.181 | ISO 9001:2008 Certified Journal | Page 527 III. METHODOLOGY
A. Input
Inputs are collected from various web services like restful services. All the services are collected from different areas and stored in local and process are carried out based on user requirements. The basic inputs are in the form of JSON. But it does not follow proper format. The main thing is to change the inappropriate format to correct format by using JavaScript language.
B. Work flow
The basic workflow is formatted input is sent to AmChart API. By using the AmChart API the charts are created based on the user requirements. The result is produced in charts and graphs. The advantage is the user can easily understand the basic workflow of the project. It supports user friendly and more look and feel effect. And support for browser integration and versions. More animation effects are used to attract the users.
C. Modules
1)
USER GENERATION:
In this module two processes are carried out. The first process allows the customer to create their name, location, phone number, image and email-id. It also provides the user to edit their personal details. In second process it allows the employee to enter their details like their name, location, phone number, image and email-id and setting IMEI number.
2)
ADMINISTRATION:
In administration module 5 processes are carried out namely approval for employee and customer, altering the employee, altering the customer, work assignment and tracking. The admin has the rights to altering the details of both customer and employee. It allows the admin to add, edit, and delete customer details and
employee details. In work assignment process the administrator assigns the daily task to all sales person and set sales person target. Admin assign the Sales person IMEI number to track daily location for checking the visiting details
3)
PDGSCB CALCULATION:
PDGSCB calculation modules calculate the awarding criteria. PDGSCB is calculated based on product purchased, based on the amount and based on the date. The criteria calculate the overall average in the form of Platinum, Gold, Diamond, Silver, Copper and Bronze.
PDGSCB Calculation Rules:
Platinum = Customer purchase amount >= 1, 50,000
Diamond = Customer purchase amount < 1, 50,000
Gold =Customer purchase amount <90,000
Silver =Customer purchase amount <45,000
Copper =Customer purchase amount <21, 000
Bronze =Customer purchase amount < 12,000
4) ORDER COLLECTION TRACKING:
© 2017, IRJET | Impact Factor value: 5.181 | ISO 9001:2008 Certified Journal | Page 528 the process is carried out in order collection tracking
process
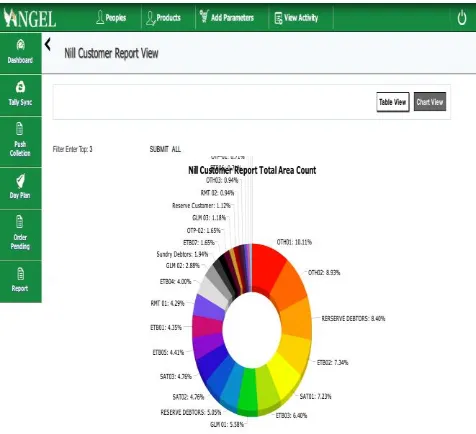
5) CUSTOMER MONITORING:
[image:4.612.323.545.107.365.2]In customer monitoring module it involves two processes namely nil customer and bad debit customer. The nil customer describes the customer who are all not involving in the order are referred as nil customer the time period for the nil customer is allotted for 30 days. The second process is bad debit customer it represents the customers who are not paying the amount within 30 days.
Figure -2:System Flow Diagram
6)
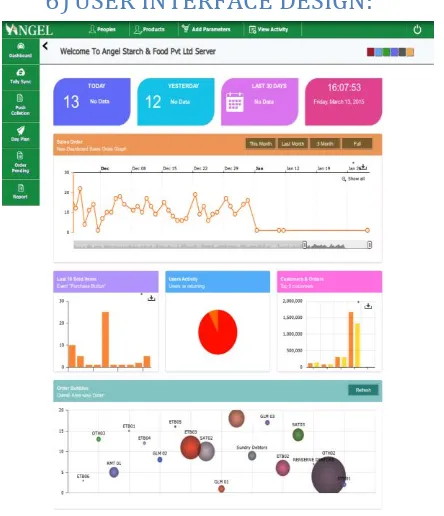
USER INTERFACE DESIGN:
Figure -3:Dashboard
[image:4.612.46.280.326.571.2] [image:4.612.322.539.401.653.2]© 2017, IRJET | Impact Factor value: 5.181 | ISO 9001:2008 Certified Journal | Page 529
[image:5.612.38.269.98.384.2]Figure -5: Bad Debit Chart View
Figure -6: Nil Customer Chart View
Figure -7:PDGSCB Donut Chart View
[image:5.612.36.274.418.635.2] [image:5.612.323.540.431.659.2]© 2017, IRJET | Impact Factor value: 5.181 | ISO 9001:2008 Certified Journal | Page 530
IV.CONCLUSION
This “DATA ANALYSIS AND REPORT GENERATION” provides a convenience to the customer for easy understanding in the way of graph, chart. It eliminates manual work for the customer or user in searching a specific data instead of table format or HTML table view. It also reduces time. From the generated report Business manager can take more informed decision and customer is served better in the day to today process.
REFERENCES
[1]. V.Shankararaman and L.E. Kit, “Enterprise
systems enabling smart commerce,” Proc. - 16th IEEE Conf. Bus. Informatics, CBI 2014, vol. 2, pp. 50–53, 2014.
[2]. A. Antoniou, E. Theodoridis, I.
Chatzigiannakis, and G. Mylonas, “Human mobility trace acquisition and social interactions monitoring for business
intelligence using smartphones,” Proc. 2012 16th Panhellenic Conf. Informatics, PCI 2012, no. i, pp. 1–6, 2012
[3]. P. Bihani and S. T. Patil, “A Comparative Study
of Data Analysis Techniques,” Int. J. Emerg. Trends Technol. Comput. Sci., vol. 3, no. 2, 2014.
[4]. D. a. Keim, F. Mansmann, and H. Ziegler,
“Challenges in Visual Data Analysis,” Inf. Vis., no. IV 2006, pp. 9–16, 2006.
[5]. C. Xiaoli and W. Ziniu, “The Web Development
Based on the Drupal System,” Bus. Comput. Glob. Informatiz. (BCGIN), 2012 Second Int. Conf., pp. 778–780, 2012.
[6]. B. Lin, Y. Chen, X. Chen, and Y. Yu,