Neurobiology of Disease
Source-Reconstruction of Event-Related Fields Reveals
Hyperfunction and Hypofunction of Cortical Circuits in
Antipsychotic-Naive, First-Episode Schizophrenia Patients
during Mooney Face Processing
Davide Rivolta,
1,2,3Nazareth P. Castellanos,
4Cerisa Stawowsky,
5Saskia Helbling,
6Michael Wibral,
5Christine Gru¨tzner,
1Dagmar Koethe,
7,8,9Katharina Birkner,
1,2Laura Kranaster,
7,8Frank Enning,
8Wolf Singer,
1,2,10F. Markus Leweke,
7,8*
and Peter J. Uhlhaas
1,2,11*
1Department of Neurophysiology, Max Planck Institute for Brain Research and2Ernst Stru¨ngmann Institute (ESI) for Neuroscience in Cooperation with
Max Planck Society, Frankfurt am Main 60528, Germany,3School of Psychology, University of East London, London E15 4LZ, United Kingdom, 4Laboratory of Cognitive and Computational Neuroscience, Center for Biomedical Technology, Universidad Polite´cnica de Madrid, Madrid 28223, Spain,
5MEG Unit, Brain Imaging Centre, Johann Wolfgang Goethe University, Frankfurt am Main 60529, Germany,6Institute for Medical Psychology, Johann
Wolfgang Goethe University, Frankfurt am Main 60054, Germany,7Department of Psychiatry and Psychotherapy, University of Cologne, Cologne 50924,
Germany,8Department of Psychiatry and Psychotherapy, Central Institute of Mental Health, Medical Faculty Mannheim, Heidelberg University, Mannheim
68159, Germany,9Department of General Psychiatry, Medical Faculty Heidelberg, Heidelberg University, Heidelberg 69115, Germany,10Frankfurt Institute
for Advanced Studies, Johann Wolfgang Goethe University, Frankfurt am Main 60438, Germany, and11Institute of Neuroscience and Psychology,
University of Glasgow, Glasgow G12 8QB, United Kingdom
Schizophrenia is characterized by dysfunctions in neural circuits that can be investigated with electrophysiological methods, such as EEG
and MEG. In the present human study, we examined event-related fields (ERFs), in a sample of medication-naive, first-episode
schizo-phrenia (FE-ScZ) patients (
n
⫽
14) and healthy control participants (
n
⫽
17) during perception of Mooney faces to investigate the
integrity of neuromagnetic responses and their experience-dependent modification. ERF responses were analyzed for M100, M170, and
M250 components at the sensor and source levels. In addition, we analyzed peak latency and adaptation effects due to stimulus repetition.
FE-ScZ patients were characterized by significantly impaired sensory processing, as indicated by a reduced discrimination index (A
⬘
). At
the sensor level, M100 and M170 responses in FE-ScZ were within the normal range, whereas the M250 response was impaired. However,
source localization revealed widespread elevated activity for M100 and M170 in FE-ScZ and delayed peak latencies for the M100 and M250
responses. In addition, M170 source activity in FE-ScZ was not modulated by stimulus repetitions. The present findings suggest that
neural circuits in FE-ScZ may be characterized by a disturbed balance between excitation and inhibition that could lead to a failure to gate
information flow and abnormal spreading of activity, which is compatible with dysfunctional glutamatergic neurotransmission.
Key words:
ERFs; face processing; first-episode psychosis; M170; MEG; Mooney faces
Introduction
Event-related potentials (ERPs) and their neuromagnetic
coun-terparts, event-related fields (ERFs), reveal the timing of
neuro-nal events underlying sensory and cognitive processes with
millisecond precision. In addition to important insights into
nor-mal brain functioning, ERPs/ERFs have been used to identify
aberrant cortical processes in schizophrenia (ScZ;
Luck et al.,
2011
). These studies have revealed impairments both in the
la-tency and amplitude of ERP/ERF components for early,
sensory-driven potentials, such as the P50 (
Freedman et al., 1983
) and
P/M100 (
Doniger et al., 2002
), and later components, such as
N/M170 (
Herrmann et al., 2004
) and P/M300 (
Ford, 1999
),
which are involved in higher cognitive functions such as face
processing and decision making (
Onitsuka et al., 2006
;
Lee et al.,
2010
).
The large majority of studies investigating ERP/ERF
compo-nents have been conducted in chronically medicated ScZ
pa-tients. Because antipsychotic medication has an immediate
impact on brain activity (
Tost et al., 2010
) and may affect GABA
and glutamate levels (
Kegeles et al., 2012
), data from medicated
Received Sept. 2, 2013; revised March 4, 2014; accepted March 7, 2014.Author contributions: M.W., C.G., D.K., L.K., F.E., W.S., F.M.L., and P.J.U. designed research; C.G., D.K., L.K., and F.E. performed research; D.R., N.P.C., C.S., S.H., M.W., and K.B. analyzed data; D.R. and P.J.U. wrote the paper.
D.R. received support from LOEWE Grant Neuronale Koordination Forschungsschwerpunkt Frankfurt (NeFF). Peter J. Uhlhaas and Wolf Singer were supported by the Max-Planck Society.
The authors declare no competing financial interests.
Correspondence should be addressed to Dr. Peter J. Uhlhaas, Institute of Neuroscience and Psychology, University of Glasgow, Hillead Str. 58, Glasgow G12 8QB, United Kingdom. E-mail: peter.[email protected].
*M.F.L. and P.J.U. contributed equally to this work. DOI:10.1523/JNEUROSCI.3752-13.2014
patient populations need to be complemented by patient samples
that are free from the confounding influence of antipsychotics,
ideally, in first-episode (FE) patients that are medication naive.
Indeed, evidence on the presence of ERP/ERF abnormalities in
FE-ScZ has been less consistent, suggesting potential differences
in the underlying pathophysiological mechanisms during
differ-ent illness stages. For example, mismatch negativity aberrations
have been found to be more impaired in chronic than in FE-ScZ
patients (
Umbricht et al., 2006
), with some studies failing to find
a deficit at illness onset (
Salisbury et al., 2002
). Similarly, P50 and
N100 responses during sensory gating have been found to be
intact in FE-ScZ patients (
Bachmann et al., 2010
).
In the present study, we examined ERFs during perception of
Mooney faces in a sample of never-medicated FE-ScZ patients.
Mooney faces are two-tone images of human faces that are
asso-ciated with face-sensitive ERP/ERF responses such as the
N/M100 and N/M170 (
George et al., 2005
;
Eimer et al., 2011
) and
a negative deflection occurring between 200 and 250 ms indexing
the “closure” of incomplete visual information (
Gru¨tzner et al.,
2010
;
Castelhano et al., 2013
). Previously, we had reported that
FE-ScZ patients in the present sample are characterized by a
dys-regulation of beta/gamma-band activity during Mooney face
per-ception (
Sun et al., 2013
).
To further investigate the neurophysiology of visual
dysfunc-tion in ScZ, we examined ERFs in combinadysfunc-tion with advanced
source localization of face-sensitive MEG components (M100,
M170, and M250) to identify the cortical regions and processing
stages underlying impaired Mooney face perception in FE-ScZ
patients. Previous work highlighted the possibility that
abnor-malities in early sensory-driven potentials, such as the P100,
could drive impairments in higher cortical areas during
percep-tual tasks (
Doniger et al., 2002
;
Dias et al., 2011
) and that this
pattern of dysfunction is consistent with abnormal dorsal stream
activity and glutamatergic abnormalities caused by NMDAR
def-icits (
Bickel and Javitt, 2009
). In addition, neural responses of
visual perceptual learning were investigated to test the
experience-dependent modifications of neural responses, a
pro-cess critically mediated by NMDARs (
Kleinschmidt et al., 1987
;
Philpot et al., 2007
).
Materials and Methods
Participants
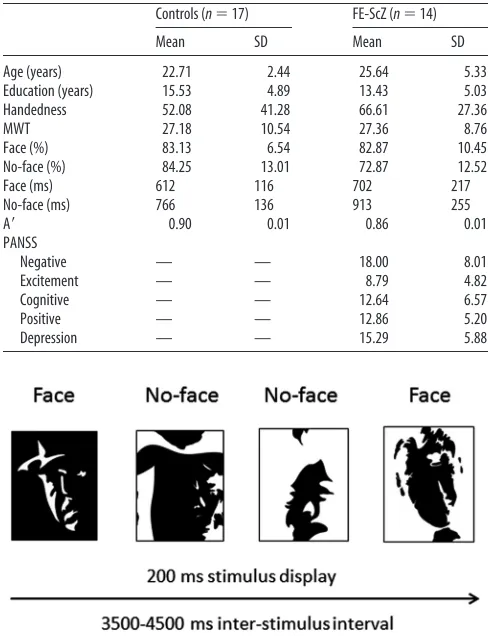
Fourteen antipsychotic-naive ScZ patients (4 females) who were experi-encing their first hospitalization were recruited from the Department of Psychiatry and Psychotherapy, University of Cologne, and the Depart-ment of Psychiatry, Psychosomatics and Psychotherapy, Goethe University Frankfurt. All FE-ScZ patients met DSM-IV criteria for paranoid-ScZ and the duration of untreated psychosis was 10.2 months (5.17 SD). Seventeen healthy controls (4 females) were recruited from the local community and screened for psychopathology with the German version of Structured Clin-ical Interview for DSM-IV-R (SCID; for demographic information for pa-tients and controls, seeTable 1). Premorbid verbal intelligence was assessed with the Mehrfachwahl-Wortschatz-Intelligenztest (MWT;Lehrl, 2005).
The study was performed according to the Declaration of Helsinki and approved by the ethical committees of the Goethe University Frankfurt and the University of Cologne. After complete description of the study to the participants, written informed consent was obtained. DSM-IV diag-nosis of ScZ was established with the SCID by thorough chart review and in consultation with the treating psychiatrists. Patients and controls were excluded if they had any neurological or ophthalmologic disorders that might have affected performance or if they met criteria for alcohol or substance dependence within the last month. Current psychopathology was assessed with the Positive and Negative Syndrome Scale (PANSS;Kay et al., 1986) and symptoms were grouped into five factors according to the model ofLindenmayer et al. (1995), including the factors “positive,”
“negative,” “depression,” “excitement,” and “cognitive.” Patients with first episode and healthy controls were of similar age.
Stimuli and task
Mooney and Ferguson (1951)developed a visual closure task consisting of degraded pictures of human faces in which all shades of gray are removed. Perception of Mooney faces involves the grouping of the frag-mentary parts into coherent images based on the Gestalt principle of closure. We used a set of 160 different stimuli consisting of the 40 original Mooney stimuli presented in the upright orientation, mirrored at the vertical axis, and in corresponding versions mirrored at the horizontal axis (Fig. 1). The inverted stimuli were scrambled by moving single, contiguous white or black foreground patches across the black or white background areas, respectively. Participants were presented with a ran-dom sequence of upright and inverted-scrambled stimuli that were shown for 200 ms. The interstimulus interval ranged between 3500 and 4500 ms. Participants indicated via button press whether a face or a no-face was presented. The hand assignment (left/right hand; face/no-face response) was counterbalanced across subjects.
All participants completed four experimental runs, each of which was composed of 60 upright and 30 inverted-scrambled stimuli. The stimuli were displayed in the center of a translucent screen at a viewing distance of 53 cm and subtended 19 degrees of visual angle. An LCD projector located outside of the magnetically shielded room of the MEG was used to project the stimuli onto the screen via two front-silvered mirrors. Stimulus presentation was controlled using the Presentation software package (Neurobehavioral Systems).
MEG data acquisition
[image:2.585.299.543.92.410.2]MEG data were acquired using a 275-sensor whole-head system (Omega 2005; VSM MedTech) with a sampling rate of 600 Hz in a synthetic
Table 1. Biographical information, MWT, performance on face/no-face stimuli, and Aⴕof healthy control participants and FE-ScZ patients and PANSS scores for FE-ScZ patients
Controls (n⫽17) FE-ScZ (n⫽14)
Mean SD Mean SD
Age (years) 22.71 2.44 25.64 5.33
Education (years) 15.53 4.89 13.43 5.03
Handedness 52.08 41.28 66.61 27.36
MWT 27.18 10.54 27.36 8.76
Face (%) 83.13 6.54 82.87 10.45
No-face (%) 84.25 13.01 72.87 12.52
Face (ms) 612 116 702 217
No-face (ms) 766 136 913 255
A⬘ 0.90 0.01 0.86 0.01
PANSS
Negative — — 18.00 8.01
Excitement — — 8.79 4.82
Cognitive — — 12.64 6.57
Positive — — 12.86 5.20
[image:2.585.300.544.93.412.2]Depression — — 15.29 5.88
third-order axial gradiometer configuration. Data were offline band-pass filtered between 1 and 40 Hz and participants’ head movements were monitored before and after each run using coils placed in the nasion and 1 cm anterior to the tragus of the left and right hear. Runs with movement larger than 5 mm were excluded from further analysis.
Anatomical (MRI) data acquisition
A high-resolution anatomical MRI scan was acquired for each partici-pant using a 3D magnetization-prepared rapid-acquisition gradient echo sequence (160 slices; voxel size: 1⫻1⫻1 mm; FOV: 256 mm; TR: 2300 ms; TE: 3.93 ms). During the structural scan, vitamin E pills were applied to the nasion and 1 cm anterior to the tragus of the right and left ear to allow for coregistration of the MEG and MRI data. Scanning was per-formed with a 3 tesla Siemens Trio scanner.
Behavioral data
Reaction times (RTs) and detection rates were analyzed using a 2⫻2 ANOVA with “group” (controls vs FE-ScZ) as the between-subject factor and “condition” (face vs no-face) as the within-subject factor. In addi-tion, we examined changes in behavioral parameters for face responses during the first versus the second half of trials to test for changes in perceptual learning. Statistically significant interactions were followed by
post hoc ttests. We also calculated the discrimination index A⬘(Grier, 1971) and compared it across groups using attest.
MEG data processing and analysis
The preprocessing routines and calculation of ERFs was performed with Fieldtrip software (http://fieldtrip.fcdonders.nl/). Trials were defined through a⫺1000 ms prestimulus and 1000 ms poststimulus interval and
only trials with correct responses were consid-ered for data analysis. Trials containing eye blinks or artifact due to muscle activity or sen-sors (SQUIDs) jumps were discarded using au-tomatic artifact rejection routines. To control for the higher number of trials in the face con-dition versus the no-face concon-dition, we ran-domly excluded face trials to obtain the same number of trials in the two conditions for each participant. Overall, controls had a mean of 79 trials (SEM⫽5.5) for each condition, whereas FE-ScZ had 58 trials (SEM⫽3.8). Statistics at the sensor and at source level were calculated within three time windows: M100 (70 –100 ms), M170 (140 –190 ms), and M250 (250 –300 ms;Figs. 2,Fig. 3) and baseline corrected (base-line window: from⫺500 until⫺100 ms pre-stimulus onset).
Sensor-level statistics. A nonparametric mixed-design two-way ANOVA based on a permutation approach (Anderson and Ter Braak, 2003;Suckling and Bullmore, 2004) with one between-subject factor, “group” (controls vs FE-ScZ), and one within-subject factor, “condi-tion” (face vs no-face), was used for the statistical analysis at the sensor level. The analysis was performed considering all MEG sensors. Sensors were selected when theF-value surpassed anF-value corresponding to an
␣level of 0.05 and assigned to clusters based on their spatial adjacency defined by the template implemented in Fieldtrip. Cluster-level statistics were calculated by taking the sum of theF-values within each cluster. These calculations were performed for each main effect and the interac-tion individually.
The observed cluster-level statistics were than tested against the distri-bution of the maximum cluster-level statistics obtained from Monte Carlo simulations with 1000 permutations for each effect. For each per-mutation, group and condition assignments were shuffled and the esti-mation ofF-values and the clustering procedure were repeated on the resampled data. The resulting maximum cluster values were used to construct the maximum cluster-level distribution under the null hypoth-esis. Clusters were considered to be significant at an␣level of 0.05 if the initially observed cluster value was greater than the 95th percentile of the maximum cluster-level statistic distribution. Post hoc comparisons on channels showing statistically significant interactions were computed with nonparametricttests based on a permutation approach (1000 permutations).
Source-level statistics. The statistical analysis at the source level was computed with Statistical Parametrical Mapping (SPM8; http://www.fil. ion.ucl.ac.uk/spm/), adopting a Bayesian inversion of hierarchical Gaussian process models (Litvak et al., 2011). For each participant, a head mesh with 8196 vertices was obtained by computing the nonlinear transformation from the individual MRI to the template (MNI) space. In a second step, we coregistered the sensor positions to the individual MRI using the nasion and the preauricular points as fiducials and calculated the forward solution by computing the lead field for each dipole (vertex) on the cortical mesh with a “single shell” model. Finally, the inverse solution was calculated using the multiple sparse priors algorithm. For all components of interest (M100, M170, and M250), we calculated the condition⫻group interaction and the main effect of condition (face vs no-face) of a full-factorial 2⫻2 ANOVA model (two tails,␣: 0.05). We further performed post hoc contrasts (ttests, two tails,␣Bonferroni corrected to 0.008) to test the direction of the statistically significant effects of the ANOVA.
Peak latency analysis
For each ERF-component, we extracted latency values over the anatom-ical regions showing the strongest source group⫻condition interaction (ANOVA; Tables2,3). These were defined based on the size of the
p-value. When two or more regions had the samep-value, the region with the biggest cluster size was selected. A 2⫻2 ANOVA with one between-subject factor,“group” (controls vs FE-ScZ), and one within-between-subject
[image:3.585.44.371.64.207.2]fac-Figure 2. Corresponding ERF traces for all sensors and all trials. Black, Face condition; red, no-face condition.
[image:3.585.46.282.244.429.2]tor, “condition” (face vs no-face), was used for the latencies statistical analysis.
Perceptual learning
To examine the effects of stimulus repetition on ERF responses, we per-formed a within-group median-split analysis of amplitude values in the face condition. In particular, for each subject, we divided trials in first and second half according to their presentation order and compared
them at the source level using multiplettests with SPM. We restricted the analysis to those anatomical regions that previously showed significant main effects of condition and interactions at the source level (for a list of the masks adopted, seeTable 4). The ROI selection was performed using the WFU-PickAtlas (http://fmri.wfubmc.edu/software/PickAtlas). Be-cause of the multiplettests involved, the␣level was set at 0.0083.
Correlations of MEG activity, behavior variables, and
PANSS ratings
For each ERF component, we extracted amplitude and latency values over the anatomical regions showing the strongest source group⫻ con-dition interaction (Table 3). We then calculated Pearson correlation co-efficients between amplitude values and Mooney face accuracy and RT data (␣⫽0.025). We also calculated Pearson correlation coefficients between amplitude values and the five PANSS subscales (negative, excite-ment, cognitive, positive, depression;␣⫽0.01).
Results
Behavioral results
A main effect of group showed that controls were overall more
accurate than FE-ScZ patients (F
(1,29)⫽
6.76,
p
⫽
0.015).
How-ever, there was no effect of condition (F
(1,29)⫽
1.90,
p
⫽
0.179)
nor a group by condition interaction (F
(1,29)⫽
2.97,
p
⫽
0.095).
RTs showed a main effect of condition (F
(1,29)⫽
50.12,
p
⬍
[image:4.585.300.544.82.131.2]0.001), with face responses being faster than RTs for no-faces.
There was a trend for slowed responses in the FE-ScZ group
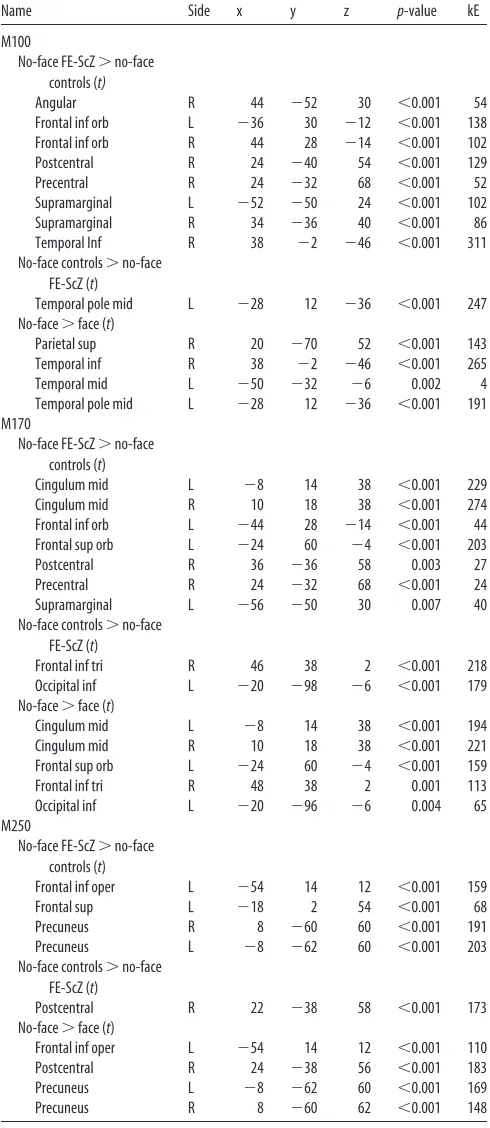
Table 3. Anatomical regions showing the strongest groupⴛcategory interaction (ANOVA)Name Side x y z p-value kE MEG
Middle orbitofrontal cortex L ⫺18 50 ⫺13 ⬍0.001 548 M100
Parahippocampal gyrus L ⫺22 ⫺20 ⫺24 ⬍0.001 765 M170
Inferior frontal gyrus R 50 38 2 ⬍0.001 204 M250
[image:4.585.42.287.84.648.2]Amplitude and peak latencies values of these regions were extracted for the calculation of correlation with PANSS scores. Side (right, R; left, L), MNI coordinates (x,y, andz),pvalues, cluster size (kE), and MEG component showing the effect are reported.
Table 4. Anatomical regions selected for the preparations of anatomical masks adopted in the calculation of the stimulus repetition effect because they showed a main effect of condition and/or a groupⴛcondition interaction
M100 M170 M250
Name Side Name Side Name Side
Angular R Angular R Angular L
Calcarine L Calcarine R Angular R
Calcarine R Cingulate mid L Calcarine L
Frontal inf orb L Cingulate mid R Calcarine R
Frontal inf tri R Cuneus L Cingulate ant R
Frontal mid orb L Cuneus R Frontal inf oper L
Fusiform L Frontal inf orb L Frontal inf tri R
Fusiform R Frontal inf orb R Frontal mid L
Lingual R Frontal inf tri R Frontal mid R
Parietal inf R Frontal mid L Postcentral R
Parietal sup R Frontal sup orb L Precuneus L
Postcentral L Fusiform R Precuneus R
Postcentral R Lingual L
Precentral R Occipital inf L
Precuneus L Occipital mid L
Rolandic oper R Parahippocampal L
Supp motor area R Postcentral L
Supramarginal L Postcentral R
Supramarginal R Precentral R
Temporal inf L Supramarginal R
Temporal inf R Temporal sup L
Temporal mid L
Temporal mid L
Abbreviations: inf, inferior; sup, superior; mid, middle; orb, orbital; tri, pars triangularis; oper, operculum; ant, anterior.
Table 2. Anatomical regions showing statistically significant post-hoc (t) comparisons for the M100, M170, and M250
Name Side x y z p-value kE
M100
No-face FE-ScZ⬎no-face controls (t)
Angular R 44 ⫺52 30 ⬍0.001 54
Frontal inf orb L ⫺36 30 ⫺12 ⬍0.001 138
Frontal inf orb R 44 28 ⫺14 ⬍0.001 102
Postcentral R 24 ⫺40 54 ⬍0.001 129
Precentral R 24 ⫺32 68 ⬍0.001 52
Supramarginal L ⫺52 ⫺50 24 ⬍0.001 102
Supramarginal R 34 ⫺36 40 ⬍0.001 86
Temporal Inf R 38 ⫺2 ⫺46 ⬍0.001 311
No-face controls⬎no-face FE-ScZ (t)
Temporal pole mid L ⫺28 12 ⫺36 ⬍0.001 247
No-face⬎face (t)
Parietal sup R 20 ⫺70 52 ⬍0.001 143
Temporal inf R 38 ⫺2 ⫺46 ⬍0.001 265
Temporal mid L ⫺50 ⫺32 ⫺6 0.002 4
Temporal pole mid L ⫺28 12 ⫺36 ⬍0.001 191
M170
No-face FE-ScZ⬎no-face controls (t)
Cingulum mid L ⫺8 14 38 ⬍0.001 229
Cingulum mid R 10 18 38 ⬍0.001 274
Frontal inf orb L ⫺44 28 ⫺14 ⬍0.001 44
Frontal sup orb L ⫺24 60 ⫺4 ⬍0.001 203
Postcentral R 36 ⫺36 58 0.003 27
Precentral R 24 ⫺32 68 ⬍0.001 24
Supramarginal L ⫺56 ⫺50 30 0.007 40
No-face controls⬎no-face FE-ScZ (t)
Frontal inf tri R 46 38 2 ⬍0.001 218
Occipital inf L ⫺20 ⫺98 ⫺6 ⬍0.001 179
No-face⬎face (t)
Cingulum mid L ⫺8 14 38 ⬍0.001 194
Cingulum mid R 10 18 38 ⬍0.001 221
Frontal sup orb L ⫺24 60 ⫺4 ⬍0.001 159
Frontal inf tri R 48 38 2 0.001 113
Occipital inf L ⫺20 ⫺96 ⫺6 0.004 65
M250
No-face FE-ScZ⬎no-face controls (t)
Frontal inf oper L ⫺54 14 12 ⬍0.001 159
Frontal sup L ⫺18 2 54 ⬍0.001 68
Precuneus R 8 ⫺60 60 ⬍0.001 191
Precuneus L ⫺8 ⫺62 60 ⬍0.001 203
No-face controls⬎no-face FE-ScZ (t)
Postcentral R 22 ⫺38 58 ⬍0.001 173
No-face⬎face (t)
Frontal inf oper L ⫺54 14 12 ⬍0.001 110
Postcentral R 24 ⫺38 56 ⬍0.001 183
Precuneus L ⫺8 ⫺62 60 ⬍0.001 169
Precuneus R 8 ⫺60 62 ⬍0.001 148
[image:4.585.299.541.202.455.2](F
(1,29)⫽
3.73,
p
⫽
0.063), but no group by condition interaction
(F
(1,29)⫽
1.22,
p
⫽
0.278). The discrimination index A
⬘
(
Grier,
1971
) indicated that controls had a better discrimination
perfor-mance compared with FE-ScZ patients (t
(29)⫽
2.41,
p
⫽
0.023;
Table 1
).
The 2
⫻
2 ANOVA to examine differences in perceptual
learn-ing showed a trend toward a statistically significant group
⫻
presentation interaction for RTs (F
(1,29)⫽
3.88,
p
⫽
0.059),
indi-cating that RTs did not improve in FE-ScZ patients through
stim-ulus repititions. No main effect was statistically significant (p
⬎
0.05). The analysis of accuracy did not reveal main effects nor
interaction (p
⬎
0.05).
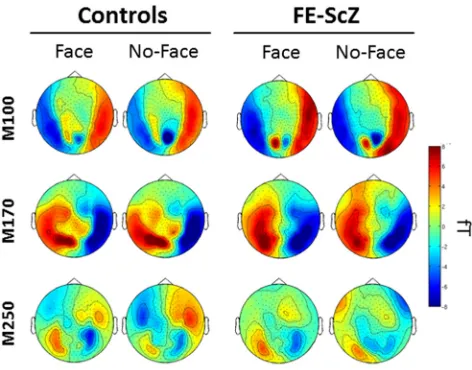
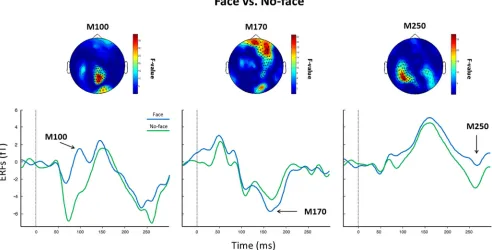
MEG results: sensor data
A main effect of condition for the amplitude of the M100
com-ponent was found, with face responses showing higher positive
amplitude in occipitoparietal sensors (
Fig. 4
). Similarly, there was
a main effect of condition for the M170 and face responses were
characterized by higher negative amplitude in frontocentral
sen-sors compared with no-face responses (
Fig. 4
). There were no
main effects of group or group
⫻
condition interactions for
ei-ther the M100 or the M170 amplitudes. In contrast, a main effect
of condition for the M250 indicated that the no-face condition
elicited higher activity in temporoparietal sensors bilaterally (
Fig.
4
). There also was a condition
⫻
group interaction over
fronto-temporal sensors, indicating that controls had increased M250
responses for no-faces relative to the FE-ScZ group (
Fig. 5
).
MEG results: source data
For condition effects (face vs no-face responses), there were
sta-tistically significant main effects of condition for any component.
Post hoc
comparisons showed increased M100 responses for face
versus no-face responses in the left middle orbitofrontal lobe,
right inferior frontal gyrus (pars triangularis), left precuneus, and
right and left fusiform gyrus. M170 responses were higher in the
face condition in a network including the fusiform gyrus
(bilat-eral), the left parahippocampal gyrus, the right cuneus, the left
medial occipital gyrus, and the postcentral gyrus (bilateral).
Fi-nally, M250 face activity was elevated in the right inferior frontal
gyrus (pars triangularis) compared with the no-face condition
(
Fig. 6
).
[image:5.585.48.540.68.318.2]For the condition
⫻
group interaction (controls vs FE-ScZ),
source analysis revealed statistically significant condition
⫻
group interactions for M100, M170, and M250.
Post hoc
compar-isons showed that FE-ScZ generated stronger M100 responses
than controls to stimuli in the face condition within the left
mid-dle orbitofrontal lobe, bilateral right inferior frontal gyrus (pars
triangularis), left precuneus, right fusiform gyrus, and left
calca-rine area (
Fig. 7
). Similarly, activity in the no-face condition was
elevated in FE-ScZ patients in the orbitofrontal cortex bilaterally,
supramarginal gyrus (bilateral), inferior temporal gyrus, and
right angular gyrus (
Table 2
). The only region where controls
Figure 4. Sensor-level statistics. Shown is the main effect of condition (face vs no-face) for the M100 (left), M170 (middle), and M250 (right). Top, Topoplot indicating theF-map distribution. Statistically significant channels are highlighted. *p⬍0.01;x⫽p⬍0.05. Bottom, Face and no-face ERFs averages over sensors showing a statistically significantF-value.showed increased activity relative to the FE-ScZ group was within
the left middle temporal pole during the no-face condition (
Table
2
).
M170 amplitudes to face responses in FE-ScZ patients
gener-ated stronger activity than in controls within the fusiform gyrus
(bilateral), left parahippocampal gyrus, lingual gyrus, and middle
frontal gyrus. Conversely, controls showed higher face activity in
the left medial occipital gyrus and the right cuneus (
Fig. 7
). In the
no-face condition, FE-ScZ patients were characterized by
ele-vated activity within the left frontal superior and inferior orbital
cortex, cingulate cortex (bilateral), left supramarginal gyrus, and
right precentral and postcentral gyri. In contrast, controls
showed higher no-face activity within the left inferior occipital
gyrus and the right inferior frontal lobe (pars triangularis)
rela-tive to the FE-ScZ group (
Table 2
).
The analysis of the M250 indicated higher face-related activity
in controls in the medial frontal gyrus (bilateral) and the right
inferior frontal gyrus (pars triangularis;
Fig. 7
), whereas FE-ScZ
were characterized by a circumscribed increase relative to
con-trols within the precuneus (bilaterally), left inferior frontal lobe
(pars opercularis), and the medial part of the left superior frontal
lobe during the no-face condition. In addition, controls showed
higher no-face activity than FE-ScZ within the right postcentral
gyrus (
Table 2
).
ERF latencies
The analysis of the M100 revealed a main effect of group, with
controls showing an earlier M100 peak than FE-ScZ patients
(controls: mean
⫽
80 ms, SEM
⫽
2.1; FE-ScZ: mean
⫽
96 ms,
SEM
⫽
2.3; F(1, 29)
⫽
25.74,
p
⬍
0.001). The group
⫻
condition
interaction indicated that the difference between controls and
FE-ScZ was higher in the no-face (mean
⫽
21 ms, SEM
⫽
3.2) than
the face condition (mean
⫽
11 ms, SEM
⫽
4.5;
F
(1,29)⫽
4.53,
p
⫽
0.042). However, there was no main effect or interaction for the
M170. In contrast, the analysis of the M250 showed a main effect of
condition (face: mean
⫽
271 ms, SEM
⫽
3.2; no-face: mean
⫽
280
ms, SEM
⫽
3.5;
F
(1,29)⫽
5.91,
p
⫽
0.021) and a group
⫻
condition
interaction (F
(1,29)⫽
14.00,p
⬍
0.001).
Post hoc
analysis showed that
controls (mean
⫽
261 ms, SEM
⫽
4.3) had an earlier peak latency in
the face condition than FE-ScZ (mean
⫽
280 ms, SEM
⫽
4.8;
p
⫽
0.007), and that the face component (mean
⫽
261 ms, SEM
⫽
4.3)
peaked faster than the no-face component (mean
⫽
285 ms, SEM
⫽
4.6) in controls only (p
⬍
0.001).
Perceptual learning
M100 and M250 components showed no differences between the
first and the second half of trials in both groups. However, the
M170 was characterized by significantly reduced activity in later
trials in controls within the medial cingulate cortex (bilateral),
the right fusiform gyrus, and the left parahippocampal gyrus (
Fig.
8
). In contrast to controls, no change in the M170 amplitude was
observed in FE-ScZ during stimulus repetition.
Correlation between MEG activity and
behavioral performance
Results showed a negative correlation between no-face M100
ac-tivity and ratings on the excitement (r
(14)⫽ ⫺
0.66,
p
⫽
0.010)
and cognitive dimensions (r
(14)⫽ ⫺
0.679,
p
⫽
0.008). No
addi-tional correlation reached statistical significance.
Discussion
Here, we demonstrate that source-reconstructed ERFs in
medication-naive FE-ScZ patients reveal a complex pattern of
hyperfunction and hypofunction of early visual regions and
higher cortical areas, which suggests the possibility of a disturbed
balance in excitation and inhibition (E/I balance). This contrasts
with the prominent evidence of reduced amplitudes of ERP/ERF
responses in ScZ, especially in chronic ScZ patients (
Onitsuka et
al., 2006
;
Lee et al., 2010
). In addition, given the aberrant
percep-tual learning during repetition suppression, a process that
impli-cates NMDARs (
Schmidt et al., 2013b
), our results are potentially
compatible with abnormal glutamatergic neurotransmission
during the early stages of psychosis.
Mooney faces and ERFs: sensor- and source-level analysis
Consistent with previous electrophysiological studies (
Liu et al.,
2002
;
Schweinberger et al., 2002
;
Rivolta et al., 2012c
),
face-sensitive MEG components (M100, M170, and M250) showed
prominent activity over posterior-lateral sensors (
Fig. 3
). In
ad-dition to the sensor-level analysis, we used an advanced
source-localization approach (
Litvak et al., 2011
) for the detection of
ERF components.
M100 is the earliest face component and is crucial for face
detection (
Liu et al., 2002
) and familiarity processing (
Rivolta et
al., 2012c
). M100 activity to face stimuli was elevated in the
fron-tal (i.e., left orbitofronfron-tal cortex and right inferior fronfron-tal cortex),
temporal (i.e., bilateral fusiform gyri), and parietal (i.e., left
pre-cuneus) regions. The activation of frontal circuits with a latency
⬃
100 ms is consistent with previous intracranial recordings (
Bar-beau et al., 2008
) and MEG studies (
Bar et al., 2006
), suggesting
an initial matching of feedforward-mediated sensory processing
with memory templates in frontal regions (
Liu et al., 2010
), which
Figure 6. Source reconstructions:t-contrasts for face versus no-face. For M100: (1) leftcould guide further processing in posterior brain areas (
Lafon-taine et al., 2013
).
The M/N170 has been previously shown to mediate the
pro-cessing of face features, holistic propro-cessing, and memory for faces
(
Harris and Aguirre, 2008
;
Harris and Nakayama, 2008
;
Caharel
et al., 2011
;
Rivolta et al., 2012b
). Consistent with these functions,
the sources of the M170 originated in the left middle occipital
gyrus, fusiform gyri, and left parahippocampal gyrus (
Gorno-Tempini et al., 1998
;
Leveroni et al., 2000
). Previous evidence
suggested that activity in the latency range of the M250 mediates
perceptual closure (
Doniger et al., 2002
), which is likely relevant
for the perception of Mooney faces (
Gru¨tzner et al., 2010
). In our
study, the M250 was localized to the right inferior frontal gyrus, a
region that has been shown to be involved in perceptual closure
(
Sehatpour et al., 2006
).
Aberrant network activity in ScZ patients during Mooney
face perception
FE-ScZ patients were characterized by a reduced discrimination
ability (A
⬘
) and a decrease in detection accuracy for both
catego-ries of stimuli. In addition, there was a trend toward an impaired
ability to improve RTs during stimulus repetition, suggesting
dysfunctional perceptual learning in the FE-ScZ group.
Sensor-level M100 and M170 responses were intact in FE-ScZ,
which contrasts with previous studies in chronic ScZ reporting
reduced ERP responses during face processing (
Lee et al., 2010
).
The only difference for sensor-level ERF components was observed
for the M250, which has been related to
clo-sure processes during perception of
frag-mentary/incomplete visual information
(
Doniger et al., 2002
).
The source analysis of ERF
compo-nents revealed, however, a more extended
pattern of dysfunctions in FE-ScZ. We
found increased M100 amplitudes in
FE-ScZ patients in response to face stimuli
relative to controls, in sensory (primary
motor and primary somatosensory
cor-tex), face (fusiform gyrus, orbitofrontal
cortex), and memory (precuneus)
re-gions. Similar to the M100 component,
face-related M170 amplitudes were also
elevated in FE-ScZ within the left
parahip-pocampal and right inferior occipital gyri
and within the postcentral, fusiform,
lin-gual, and superior temporal gyri
bilater-ally. Contrary to early MEG components,
the M250 amplitude in FE-SCZ was
re-duced over medial frontal gyri, the right
inferior frontal gyrus, and earlier peak latencies relative to
FE-ScZ.
Overall, the increased amplitudes and delayed latency of the
M100 to both face and no-face stimuli highlight that the earliest
stage of face identification is impaired in FE-ScZ patients. Early
face-processing abnormalities are furthermore supported by the
increased M170 amplitude in FE-ScZ. These findings are
consis-tent with a large body of work implicating impaired sensory
sig-naling in ScZ as a mechanism for impaired perceptual and
cognitive processes. (
Javitt, 2009
;
Yeap et al., 2009
;
Rissling et al.,
2010
). This reduced bottom-up-driven sensory precision could
lead to a compensatory excessive reliance on top-down
informa-tion, as reflected by the M250, thus potentially causing a state of
aberrant salience, the tendency to assign meaning to otherwise
irrelevant information (
Kapur, 2003
). This is further supported
by our data showing reduced behavioral accuracy and
discrimi-nation ability in FE-ScZ with respect to controls.
To examine whether the abnormalities in ERF responses in
FE-ScZ are related to impaired perceptual learning, we compared
ERF responses to the first versus the second half of trials. Results
showed that the increased M100 and M170 responses in FE-ScZ
can only be partially explained by a failure to adapt to repeated
stimulus presentation. In controls, the M170 face activity was
significantly decreased between the first and second half of trials
within the left/right middle cingulate cortex, left middle frontal
gyrus, left parahippocampal gyrus, and right fusiform gyrus,
whereas in the FE-ScZ group, this effect was absent. Specific
rep-etition suppression of the M170 component is consistent with
evidence that neural populations in the ventral stream use
predic-tions regarding expected inputs that lead to reduced activation in
face-sensitive areas such as the fusiform gyrus (
Yovel and Kanwisher,
2004
). In FE-ScZ, this mechanism seems to be impaired, because the
M170 was not modulated by repeated exposure to face stimuli,
which is in agreement with previous EEG and fMRI studies (
Onit-suka et al., 2009
;
Schwartz et al., 2013
) and with the behavioral
evi-dence of a failure to adapt RTs during stimulus repetition.
Impaired E/I balance of neural circuits in FE-ScZ: relationship to
previous research and pathophysiological hypotheses
Elevated M100 and M170 responses in FE-ScZ are potentially
compatible with the possible role of aberrant glutamatergic
neu-Figure 7. Source reconstructions of the face condition showingt-maps of FE-ScZ⬎controls (a) and controls⬎FE-ScZ (b).a,For M100: (1) left mid-orbitofrontal gyrus (⫺18, 50,⫺16); (2) left precuneus (⫺8,⫺52, 12); (3) right inferior frontal gyrus (pars triangularis; 54, 24, 4); (4) right fusiform gyrus (44,⫺34,⫺20); (5) right superior temporal lobe (56,⫺42, 14); (6) left inferior temporal gyrus (⫺42,⫺34,⫺18); (7) left rolandic operculum (⫺46,⫺28, 16); and (8) left calcarine cortex (⫺4,⫺92,⫺12). For M170: (1) left parahippocampal gyrus (⫺22,⫺24,⫺22); (2) right postcentral gyrus (64,⫺10, 18); (3) left postcentral (⫺62, ⫺12, 26); (4) left fusiform gyrus (⫺44,⫺40, 22); (5) right fusiform gyrus (42,⫺38,⫺24); (6) right lingual gyrus (10,⫺82,⫺8); (7) right inferior occipital gyrus (38,⫺82,⫺16); (8) left lingual gyrus (⫺12,⫺94,⫺18); (9) right superior temporal gyrus (62, ⫺42, 22); and (10) left superior temporal gyrus (⫺50,⫺36, 12).b, For M170: (1) left middle occipital gyrus (⫺24,⫺62, 32); (2) right cuneus (18,⫺68, 28). For M250: (1) right inferior frontal gyrus (pars triangularis; 50, 38, 2); (2) right middle frontal gyrus (26, 48, 2); and (3) left middle frontal gyrus (⫺26, 46, 2). L, Left hemisphere; R, right hemisphere.
rotransmission at illness onset.
Schobel et al. (2013)
demon-strated glutamatergic-mediated hypermetabolism as an early
marker for the beginning of psychosis. Ketamine, an antagonist
of the NMDAR, reproduces this pattern and furthermore leads to
a disturbance in E/I-balance parameters, as demonstrated
through elevated firing rates, BOLD activity, and neural
oscilla-tions (
Abel et al., 2003
;
De Simoni et al., 2013
). Moreover, there is
preliminary evidence that ketamine leads to an increase of ERP
amplitudes and latencies (
Church and Gritzke, 1987
;
Connolly et
al., 2004
;
Schmidt et al., 2013a
) and impairs perceptual learning,
both of which are compatible with the present findings. Finally, it
is also conceivable that deficits in NMDARs effect circuit
func-tions by affecting GABAergic interneurons (
Behrens et al., 2007
),
thus inducing a transitory state of disinhibition (
Schobel et al.,
2013
). Because E/I balance parameters are crucial for the
emer-gence of coordinated network oscillations, in particular at beta/
gamma-band frequencies (
Uhlhaas and Singer, 2012
), the
present findings are potentially compatible with the observation
of reduced gamma-band activity and a failure to downregulate
beta-band activity during Mooney face processing (
Sun et al.,
2013
).
Our results are also consistent with previous fMRI work
dem-onstrating increased activity during face perception in people at
risk of psychosis (
Seiferth et al., 2008
), thus highlighting the
im-portance of early perceptual deficits in the explanation of
face-related processing impairments in ScZ. Although previous work
has highlighted impairments in dorsal stream functioning
under-lying early visual processing deficits (
Doniger et al., 2002
;
Butler
et al., 2007
), the high-contrast levels of Mooney faces are mainly
targeting parvocellular pathways that project predominantly to
the ventral stream. Therefore, it is likely that, in addition to dorsal
stream impairments, ventral stream dysfunctions are also
in-volved in perceptual deficits in FE-ScZ (
Plomp et al., 2013
).
Summary
Our study shows that source reconstructed ERF responses in
MEG data may allow novel insights into the neurophysiological
basis of complex visual processing deficits in ScZ. The results
demonstrate that individuals with FE-ScZ are characterized by a
dysregulation of neuronal activity, as indicated by increase ERF
responses during early face processing (i.e., M100 and M170) and
by an hypoactivity of regions involved in late face processing (i.e.,
M250). We suggest that the early hyperactivity could be due to a
shift of the excitation/inhibition balance toward excitation,
which can be potentially driven by NMDAR hypofunction and
is furthermore consistent with impaired perceptual learning
in FE-ScZ.
The difference between sensor- and source-level results may
reflect the fact that sensor-level data can be complicated due to
the cancellation of sources (
Hari and Salmelin, 2012
).
MRI-constrained source reconstruction of MEG data may thus allow a
clearer insight into the electrophysiological dysfunctions (
Gross
et al., 2013
). Future studies could investigate the potential
con-tribution of low-frequency (theta/
␣
) activity and compare
source-level ERF responses between chronic and FE-ScZ patients
and the effects of NMDAR antagonists such as ketamine on
neu-romagnetic activity.
References
Abel KM, Allin MP, Kucharska-Pietura K, Andrew C, Williams S, David AS, Phillips ML (2003) Ketamine and fMRI BOLD signal: distinguishing be-tween effects mediated by change in blood flow versus change in cognitive state. Hum Brain Mapp 18:135–145.CrossRef Medline
Anderson MJ, Ter Braak CJF (2003) Permutation tests for multi-factorial analysis of variance. Journal of Statistical Computation Simulation 78:85–113.
Bachmann S, Weisbrod M, Ro¨hrig M, Schro¨der J, Thomas C, Scherg M, Rupp A (2010) MEG does not reveal impaired sensory gating in first-episode schizophrenia. Schizophr Res 121:131–138.CrossRef Medline
Bar M, Kassam KS, Ghuman AS, Boshyan J, Schmidt AM, Dale AM, Ha¨ma¨la¨inen MS, Marinkovic K, Schacter DL, Rosen BR, Halgren E (2006) Top-down facilitation of visual recognition. Proc Natl Acad Sci U S A 103:449 – 454.CrossRef Medline
Barbeau EJ, Taylor MJ, Regis J, Marquis P, Chauvel P, Lie´geois-Chauvel C (2008) Spatio temporal dynamics of face recognition. Cereb Cortex 18: 997–1009.CrossRef Medline
Behrens MM, Ali SS, Dao DN, Lucero J, Shekhtman G, Quick KL, Dugan LL (2007) Ketamine-induced loss of phenotype of fast-spiking interneurons is mediated by NADPH-oxidase. Science 318:1645–1647. CrossRef Medline
Bickel S, Javitt DC (2009) Neurophysiological and neurochemical animal models of schizophrenia: focus on glutamate. Behav Brain Res 204:352– 362.CrossRef Medline
Butler PD, Martinez A, Foxe JJ, Kim D, Zemon V, Silipo G, Mahoney J, Shpaner M, Jalbrzikowski M, Javitt DC (2007) Subcortical visual dys-function in schizophrenia drives secondary cortical impairments. Brain 130:417– 430.CrossRef Medline
Caharel S, Jacques C, d’Arripe O, Ramon M, Rossion B (2011) Early elec-trophysiological correlates of adaptation to personally familiar and unfa-miliar faces across viewpoint changes. Brain Res 1387:85–98.CrossRef Medline
Castelhano J, Rebola J, Leita˜o B, Rodriguez E, Castelo-Branco M (2013) To perceive or not perceive: the role of gamma-band activity in signaling object percepts. PLoS One 8:e66363.CrossRef Medline
Church MW, Gritzke R (1987) Effects of ketamine anesthesia on the rat brain-stem auditory evoked potential as a function of dose and stimulus intensity. Electroencephalogr Clin Neurophysiol 67:570 –583.CrossRef Medline
Connolly PM, Maxwell C, Liang Y, Kahn JB, Kanes SJ, Abel T, Gur RE, Turetsky BI, Siegel SJ (2004) The effects of ketamine vary among inbred mouse strains and mimic schizophrenia for the P80, but not P20 or N40 auditory ERP components. Neurochem Res 29:1179 –1188.CrossRef Medline
De Simoni S, Schwarz AJ, O’Daly OG, Marquand AF, Brittain C, Gonzales C, Stephenson S, Williams SC, Mehta MA (2013) Test-retest reliability of the BOLD pharmacological MRI response to ketamine in healthy volun-teers. Neuroimage 64:75–90.CrossRef Medline
Dias EC, Butler PD, Hoptman MJ, Javitt DC (2011) Early sensory contribu-tions to contextual encoding deficits in schizophrenia. Arch Gen Psychi-atry 68:654 – 664.CrossRef Medline
Doniger GM, Foxe JJ, Murray MM, Higgins BA, Javitt DC (2002) Impaired visual object recognition and dorsal/ventral stream interaction in schizo-phrenia. Arch Gen Psychiatry 59:1011–1020.CrossRef Medline
Eimer M, Gosling A, Nicholas S, Kiss M (2011) The N170 component and its links to configural face processing: a rapid neural adaptation study. Brain Res 1376:76 – 87.CrossRef Medline
Ford JM (1999) Schizophrenia: the broken P300 and beyond. Psychophys-iology 36:667– 682.CrossRef Medline
Freedman R, Adler LE, Waldo MC, Pachtman E, Franks RD (1983) Neuro-physiological evidence for a deficit in inhibitory pathways in schizophre-nia: comparison of medicated and drug-free patients. Biol Psychiatry 18: 537–551.Medline
George N, Jemel B, Fiori N, Chaby L, Renault B (2005) Electrophysiological correlates of facial decision: insights from upright and upside-down Mooney-face perception. Brain Res Cogn Brain Res 24:663– 673.
CrossRef Medline
Gorno-Tempini ML, Price CJ, Josephs O, Vandenberghe R, Cappa SF, Kapur N, Frackowiak RS (1998) The neural systems sustaining faces and proper-name processing. Brain 121:2103–2118.CrossRef Medline
Grier JB (1971) Nonparametric indexes for sensitivity and bias: Computing formulas. Psychol Bull 75:424 – 429.CrossRef Medline
and returning MEG research. Neuroimage 65:349 –363. CrossRef Medline
Gru¨tzner C, Uhlhaas PJ, Genc E, Kohler A, Singer W, Wibral M (2010) Neuroelectromagnetic correlates of perceptual closure processes. J Neu-rosci 30:8342– 8352.CrossRef Medline
Hari R, Salmelin R (2012) Magnetoencephalography: From SQUIDS to neu-roscience. Neuroimage 20th anniversary special edition. 61:386 –396.
CrossRef Medline
Harris AM, Aguirre GK (2008) The effects of parts, wholes, and familiarity on face-selective responses in MEG. J Vis 8:4.1– 4.12.CrossRef Medline
Harris A, Nakayama K (2008) Rapid adaptation of the M170 response: im-portance of face parts. Cereb Cortex 18:467– 476.CrossRef Medline
Herrmann MJ, Ellgring H, Fallgatter AJ (2004) Early-stage face processing dysfunction in patients with schizophrenia. Am J Psychiatry 161:915–917.
CrossRef Medline
Javitt DC (2009) Sensory processing in schizophrenia: neither simple nor intact. Schizophr Bull 35:1059 –1064.CrossRef Medline
Kapur S (2003) Psychosis as a state of aberrant salience: a framework linking biology, phenomenology, and pharmacology in schizophrenia. Am J Psy-chiatry 160:13–23.CrossRef Medline
Kay SR, Opler LA, Fiszbein A (1986) Significance of positive and negative syndromes in chronic schizophrenia. Br J Psychiatry 149:439 – 448.
CrossRef Medline
Kegeles LS, Mao X, Stanford AD, Girgis R, Ojeil N, Xu X, Gil R, Slifstein M, Abi-Dargham A, Lisanby SH, Shungu DC (2012) Elevated prefrontal cortex gamma-aminobutyric acid and glutamate-glutamine levels in schizophrenia measured in vivo with proton magnetic resonance spec-troscopy. Arch Gen Psychiatry 69:449 – 459.CrossRef Medline
Kleinschmidt A, Bear MF, Singer W (1987) Blockade of “NMDA” receptors disrupts experience-dependent plasticity of kitten striate cortex. Science 238:355–358.CrossRef Medline
Lafontaine MP, The´oret H, Gosselin F, Lippe´ S (2013) Transcranial direct current stimulation of the dorsolateral prefrontal cortex modulates repe-tition suppression to unfamiliar faces: an ERP study. PLoS One 8:e81721.
CrossRef Medline
Lee SH, Kim EY, Kim S, Bae SM (2010) Event-related potential patterns and gender effects underlying facial affect processing in schizophrenia pa-tients. Neurosci Res 67:172–180.CrossRef Medline
Lehrl S (2005) Mehrfachwahl-Wortschatz-Intelligenztest MWT-B. Balin-gen: Spitta Verlag.
Leveroni CL, Seidenberg M, Mayer AR, Mead LA, Binder JR, Rao SM (2000) Neural systems underlying the recognition of familiar and newly learned faces. J Neurosci 20:878 – 886.Medline
Lindenmayer JP, Bernstein-Hyman R, Grochowski S, Bark N (1995) Psy-chopathology of schizophrenia: initial validation of a 5-factor model. Psychopathology 28:22–31.CrossRef Medline
Litvak V, Mattout J, Kiebel S, Phillips C, Henson RN, Kilner J, G. B., Oosten-veld R, Daunizeau J, Flandin G, Penny WD, Friston KJ (2011) EEG and MEG data analysis in SPM8. Comput Intell Neurosci 2011:852961.
CrossRef Medline
Liu J, Harris A, Kanwisher N (2002) Stages of processing in face perception: an MEG study. Nat Neurosci 5:910 –916.CrossRef Medline
Liu J, Harris A, Kanwisher N (2010) Perception of face parts and face con-figurations: An fMRI study. J Cogn Neurosci 22:203–211.CrossRef Medline
Luck SJ, Mathalon DH, O’Donnell BF, Ha¨ma¨la¨inen MS, Spencer KM, Javitt DC, Uhlhaas PJ (2011) A roadmap for the development and validation of event-related potentials biomarkers in schizophrenia research. Biol Psychiatry 70:28 –34.CrossRef Medline
Mooney CM, Ferguson GA (1951) A new closure test. Can J Psychol 5:129 – 133.CrossRef Medline
Onitsuka T, Niznikiewicz MA, Spencer KM, Frumin M, Kuroki N, Lucia LC, Shenton ME, McCarley RW (2006) Functional and structural deficits in brain regions subserving face perception in schizophrenia. Am J Psychi-atry 163:455– 462.CrossRef Medline
Onitsuka T, Spencer KM, Lucia LC, Shenton ME, McCarley RW, Niznikie-wicz MA (2009) Abnormal asimmetry of the face N170 repetition effect in male patients with chronic schizophrenia. Brain Imaging Behav 3:240 – 245.CrossRef Medline
Philpot BD, Cho KK, Bear MF (2007) Obligatory role of NR2A for meta-plasticity in visual cortex. Neuron 53:495–502.CrossRef Medline
Plomp G, Roinishvili M, Chkonia E, Kapanadze G, Kereselidze M, Brand A, Herzog MH (2013) Electrophysiological evidence for ventral stream deficits in schizophrenia patients. Schizophr Bull 39:547–554.CrossRef Medline
Rissling AJ, Makeig S, Braff DL, Light GA (2010) Neurophysiologic markers of abnormal brain activity in schizophrenia. Curr Psychiatry Rep 12:572– 578.CrossRef Medline
Rivolta D, Palermo R, Schmalzl L, Williams MA (2012b) Investigating the features of the M170 in congenital prosopagnosia. Front Hum Neurosci 6:45.CrossRef Medline
Rivolta D, Palermo R, Schmalzl L, Williams MA (2012c) An early category-specific neural response for the perception of both places and faces. Cogn Neurosci 3:45–51.CrossRef Medline
Salisbury DF, Shenton ME, Carlye B, Griggs CB, Bonner-Jackson A, McCar-ley RW (2002) Mismatch negativity in chronic schizophrenia and first-episode schizophrenia. Arch Gen Psychiatry 59:686 – 694. CrossRef Medline
Schmidt A, Kometer M, Bachmann R, Seifritz E, Vollenweider F (2013a) The NMDA antagonist ketamine and the 5-HT agonist psilocybin pro-duce dissociable effects on structural encoding of emotional face expres-sions. Psychopharmacology (Berl) 225:227–239.CrossRef Medline
Schmidt A, Diaconescu AO, Kometer M, Friston KJ, Stephan KE, Vollen-weider FX (2013b) Modeling ketamine effects on synaptic plasticity during the mismatch negativity. Cereb Cortex 23:2394 –2406.CrossRef Medline
Schobel SA, Chaudhury NH, Khan UA, Paniagua B, Styner MA, Asllani I, Inbar BP, Corcoran CM, Lieberman JA, Moore H, Small SA (2013) Im-aging patients with psychosis and a mouse model establishes a spreading pattern of hippocampal dysfunction and implicates glutamate as a driver. Neuron 78:81–93.CrossRef Medline
Schwartz BL, Vaidya CJ, Shook D, Deutsch SI (2013) Neural basis of im-plicit memory for socio-emotional information in schizophrenia. Psychi-atry Res 206:173–180.CrossRef Medline
Schweinberger SR, Pickering EC, Jentzsch I, Burton AM, Kaufmann JM (2002) Event-related brain potential evidence for a response of inferior temporal cortex to familiar face repetitions. Brain Res Cogn Brain Res 14:398 – 409.CrossRef Medline
Sehatpour P, Molholm S, Javitt DC, Foxe JJ (2006) Spatiotemporal dynam-ics of human object recognition processing: an integrated high-density electrical mapping and functional imaging study of “closure” processes. Neuroimage 29:605– 618.CrossRef Medline
Seiferth NY, Pauly K, Habel U, Kellermann T, Shah NJ, Ruhrmann S, Klosterko¨tter J, Schneider F, Kircher T (2008) Increased neural response related to neutral faces in individuals at risk for psychosis. Neuroimage 40:289 –297.CrossRef Medline
Suckling J, Bullmore E (2004) Permutation tests for factorially designed neuroimaging experiments. Hum Brain Mapp 22:193–205.CrossRef Medline
Sun L, Castellanos N, Gru¨tzner C, Koethe D, Rivolta D, Wibral M, Kranaster L, Singer W, Leweke MF, Uhlhaas PJ (2013) Evidence for dysregulated high-frequency oscillations during sensory processing in medication-naive, first episode schizophrenia. Schizophr Res 150:519 –525.CrossRef Medline
Tost H, Braus DF, Hakimi S, Ruf M, Vollmert C, Hohn F, Meyer-Lindenberg A (2010) Acute D2 receptor blockade induces rapid, reversible remod-eling in human cortical-striatal circuits. Nat Neurosci 13:920 –922.
CrossRef Medline
Uhlhaas PJ, Singer W (2012) Neuronal dynamics and neuropsychiatric dis-orders: Towards a translational paradigm for dysfunctional large-scale networks. Neuron 75:963–980.CrossRef Medline
Umbricht DS, Bates JA, Lieberman JA, Kane JM, Javitt DC (2006) Electro-physiological indices of automatic and controlled auditory information processing in first-episode, recent-onset and chronic schizophrenia. Biol Psychiatry 59:762–772.Medline
Yeap S, Kelly SP, Reilly RB, Thakore JH, Foxe JJ (2009) Visual sensory pro-cessing deficits in patients with bipolar disorder revealed through high-density electrical mapping. J Psychiatry Neurosci 34:459 – 464.Medline