Control of texture and formability in ferritic stainless
steels.
BOULTON, Catherine Dorothy.
Available from Sheffield Hallam University Research Archive (SHURA) at: http://shura.shu.ac.uk/19374/
This document is the author deposited version. You are advised to consult the publisher's version if you wish to cite from it.
Published version
BOULTON, Catherine Dorothy. (1986). Control of texture and formability in ferritic stainless steels. Doctoral, Sheffield Hallam University (United Kingdom)..
Copyright and re-use policy
POLYT-rM?^ CITY
,£~ND Sl’mCBTl' SHhb&IELD Si JVVB
100 90S 401 1
H lllltl!
TELEPENSheffield City Polytechnic Library
ProQuest Number: 10694255
All rights reserved
INFORMATION TO ALL USERS
The quality of this reproduction is dependent upon the quality of the copy submitted.
In the unlikely event that the author did not send a com plete manuscript and there are missing pages, these will be noted. Also, if material had to be removed,
a note will indicate the deletion.
uest
ProQuest 10694255
Published by ProQuest LLC(2017). Copyright of the Dissertation is held by the Author.
All rights reserved.
This work is protected against unauthorized copying under Title 17, United States C ode Microform Edition © ProQuest LLC.
ProQuest LLC.
789 East Eisenhower Parkway P.O. Box 1346
CONTROL OF TEXTURE AND FORMABILITY IN FERRITIC STAINLESS STEELS
by
CATHERINE DOROTHY BOULTON
A THESIS SUBMITTED TO THE COUNCIL FOR NATIONAL ACADEMIC AWARDS IN
PARTIAL FULFILMENT OF THE REQUIREMENTS FOR THE DEGREE OF
DOCTOR OF PHILOSOPHY
SEPTEMBER, 1986
SPONSORING ESTABLISHMENT :
DEPARTMENT OF METALS AND MATERIALS ENGINEERING, SHEFFIELD CITY POLYTECHNIC,
SHEFFIELD, ENGLAND.
COLLABORATING ESTABLISHMENT :
BRITISH STEEL CORPORATION (STAINLESS), SHEPCOTE LANE,
OS' . . 1
*
0\ • A 5<.-PREFACE
The work described in this thesis was carried out at Sheffield City Polytechnic between 1st October 1982 and 30th September 1985, under the supervision of
Dr. R.P. Stratton, Direction of Studies, and Dr. M.J. Dickson.
Mr. J. Wilkinson, of BSC Stainless, acted in an advisory capacity.
In accordance with the regulations for the PhD. in Industrial Metallurgy, the relevant parts of the MSc. in Metallurgical Process Management (Director of Studies
Dr. A.J. Fletcher) were successfully completed.
candidate*s performance during this course was assessed by means of written examinations and continuous assessment of
specific assignments. The details of the course are given below
:-MODULE I
1. Process Metallurgy. 2. Mechanical Metallurgy. 3. Applied Thermodynamics. MODULE II
1. Economics. 2. Accountancy 3. Finance
J+. Operational Research
MODULE III
1. High Strength Steels 2. Stainless Steels
3. Secondary Steelmaking 4-. Heat Treatment
5. Automatic and Computer-aided Control 6. Quality Assurance.
MODULE IV CASE STUDIES
1. Why have Stainless Maraging Steels never taken off?
2. The Japanese approach to Quality.
3. Properties, Applications and Processing of Ferritic Stainless Steels. *
% This case study, which is related to the
'ACKNOWLEDGEMENTS
The author is grateful to the Sponsoring Establishment, Sheffield City Polytechnic, and the Collaborating Establishment, BSC Stainless', for enabling this work to be carried out. I am particularly indebted to the supervisors, Dr. R.P. Stratton and Dr. M.J. Dickson, for all their help and advice. In
addition,’ ,1 would like to thank Mr. J. Wilkinson, the Industrial Supervisor, Dr. B.* Harkness of BSC'Stainless, and all SCP
academic staff involved in the MSc. in Metallurgical Process Managemento I am also grateful to the following technical staff for their assistance:** Dr. D.B. Lewis, Dr. J. Cawley, Mr. P. Haythome, Mr. P. Slingsby, Mrs. R. Thomas, Mr. S. L«igh, and
UUNTKUL.UF TEXTURE AND FQRMABILITY IN’ FERRITIC STAINLESS STEELS
CATHERINE DOROTHY BOULTON ABSTRACT
The effects of processing variables on the microstructures, textures and press-formability of
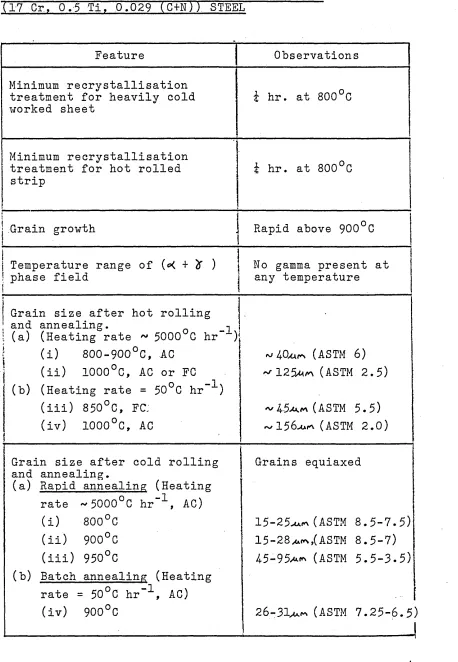
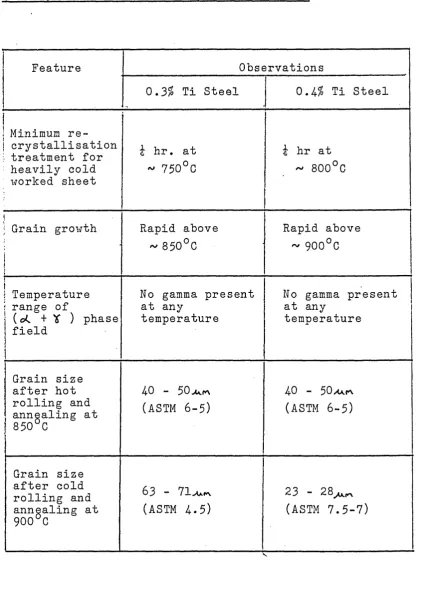
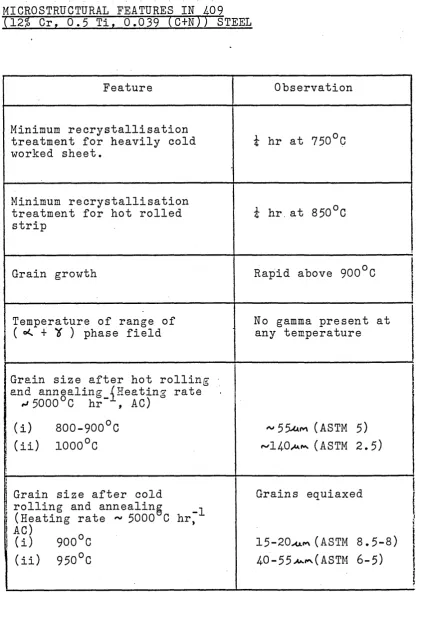
commercial 17 Cr, 0.05C (4-30) steel and low-interstitial Ti-stabilised 12 Cr (4-09) and 17 Cr (4-30 Ti) steels have been studied. The annealing textures have been
correlated with tensile strain ratio measurements
and from this correlation it has been possible to select combinations of cold rolling reduction and annealing
treatments for texture control to improve deep drawability. Electron microscope examination has been used to identify possible nucleation mechanisms for the observed
recrystallisation textures. Cold rolling texture
development and tensile strain ratios have been discussed from theoretical considerations of slip in bcc metals.
Pronounced differences in microstructural
features between high interstitial 4-30 and low-interstitial Ti-stabilised steels are reflected in differences in
texture development at all stages. Hot band condition is an important variable, affecting texture development during subsequent cold rolling and annealing.
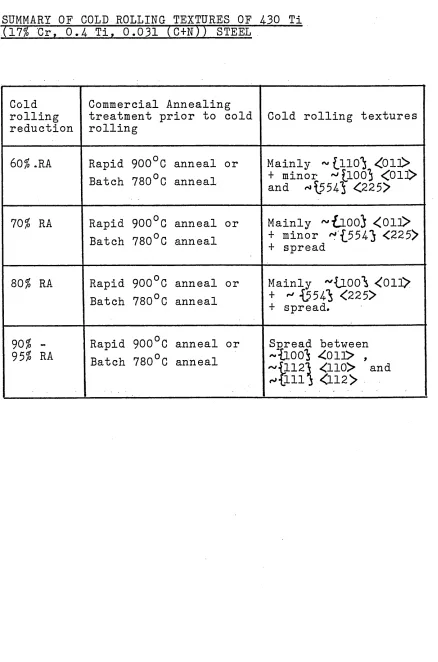
All three steels develop similar cold rolling textures, consisting mainly of
^{1003
<01]> ,~ {llli ^112> and ~ {1123 components. The ^ {1123 <110> orientation is more prominent in 4-30 Ti steel than in 4-30 steel, and it is suggested that this
difference may be due to irregular flow in high interstitial 4-30 steel. Other differences in cold rolling textures are attributed to texture inheritance from the hot band.
Recrystallisation textures in 4-30 steel are mainly "'{114-3 ^84-l>_ , with 'v'{223} ^962^ present after high reductions, and r-values are generally low.
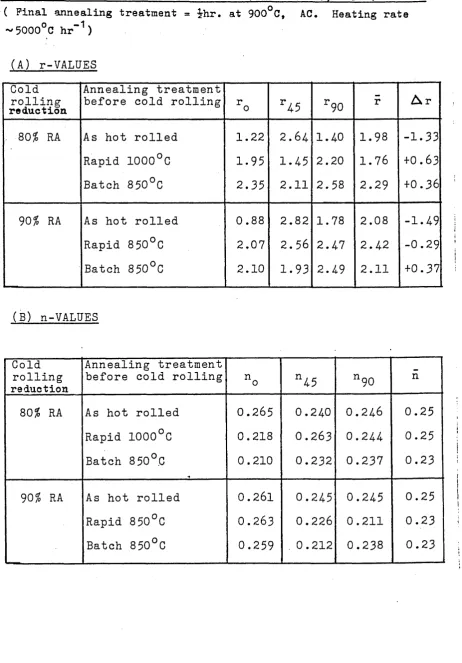
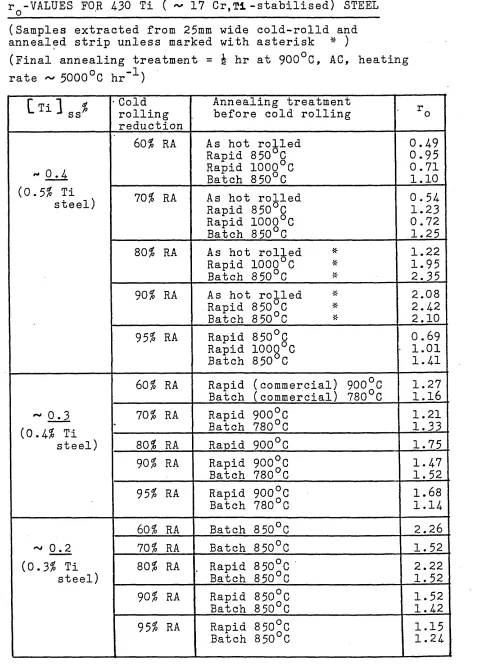
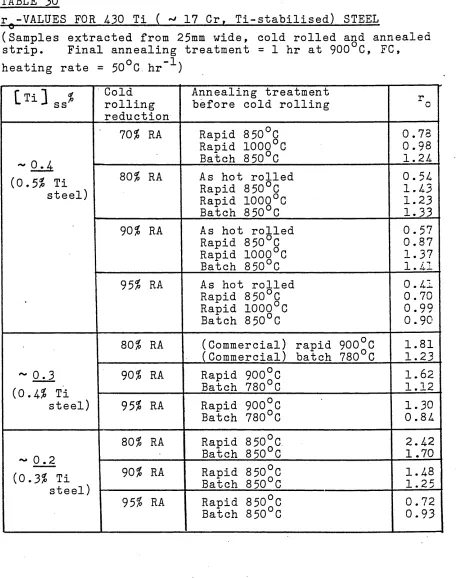
Recrystallisation textures in 4-09 and 4-30 Ti steels are mainly ^ O-IO} <001> after low cold rolling reductions, ~ {554-3 ^225> after moderate or high reductions and '*{2233 ^962/> after very high reductions. In most cases, ^{1003 ^0l!> is only a minor component. Batch annealing of the hot rolled strip followed by cold rolling to 90$ RA and rapid final annealing promotes maximum
^ {.554-3 <’225/> intensity with low ^ {1003 <uvw> intensity, and a correspondingly high r-value.
The ^{2233 <962> and «{j.l4-3 <84-l> orientations,
INTRODUCTION
REVIEW OF LITERATURE
2.1. Texture in Metals ... 2.2. Theories of Deformation Textures
in BCC Metals ... 2.3. Theories of Recrystallisation
Textures in BCC Metals ... 2.4-. Press Formability of Metals ... 2.5. Physical Metallurgy of Ferritic
Stainless Steels ... ... 2.6. Previous work on Texture and
Formability of Ferritic
Steels ... EXPERIMENTAL METHODS
I. EXPERIMENTAL RESULTS 94 - 135
4.1. Microstructural Features ... 96 4.2. Hot Rolling Textures ... 106 4. 3. Cold Rolling Textures ... 110 4-.4- Primary Recrystallisation Textures. 116 4-. 5. Uniaxial Tensile Data ... 127 4-. 6. Roping Tests ... 132 4-.7. Simulative Formability Tests .... 133
5. DISCUSSION 136 - 169
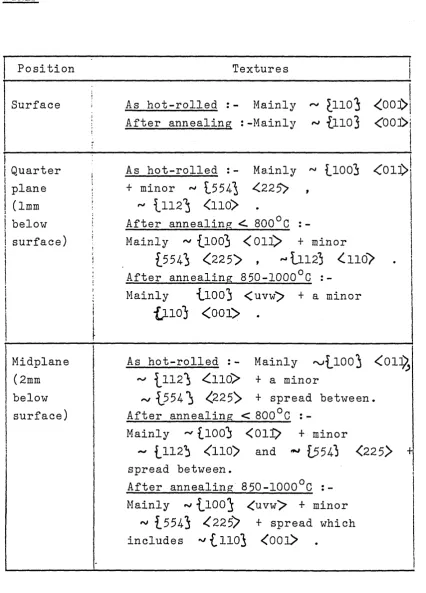
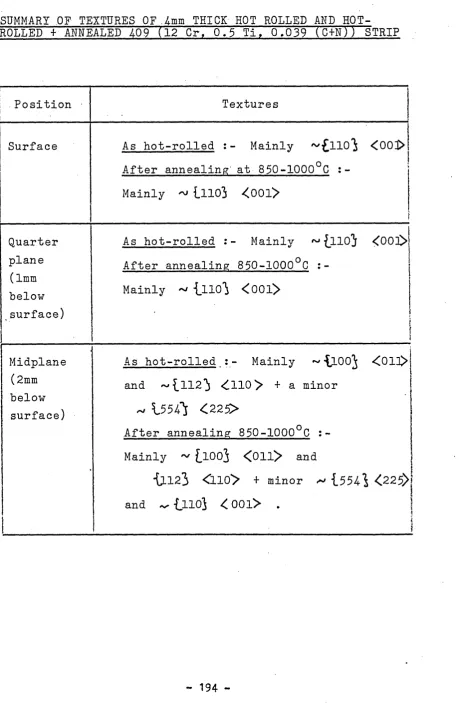
$.1. Textures of hot rolled or hot
rolled and pre-annealed strip ... 136 5.2. Cold Rolling Textures ... 139 5.3. Recrystallisation Textures ... 14-9 5.4-. Press Formability ... 160 5.5. Processing Schedules for Optimum
Texture and Formability ... 167
6. - CONCLUSIONS ... 170 - 171
7. SUGGESTIONS FOR FURTHER WORK 172 - 173
8. REFERENCES 174- -
184-9. TABLES 185 - 222
10. FIGURES ... 223 - 428 APPENDICES ... I - LXII APPENDIX A Crystal Rotations due to
Slip in Plane Strain Rolling... . I APPENDIX B Calculation of Theoretical r-values and earing profiles using the
1. INTRODUCTION
Since the advent of the AOD process, commercial production of low interstitial grades of ferritic stainless steels has become viable. Coupled with the possibility of stabilising with niobium or titanium, or of alloying with molybdenum, this has led to a new generation of ferritic alloys which are weldable and have enhanced corrosion resistance. Although
ferritic stainless steels still cannot rival austenitic grades in terms of general corrosion resistance and stretch formability, they are readily cold worked and have adequate corrosion resistance for many applications. New markets are emerging for these alloys, especially as
cheaper replacement materials for more costly grades of steel, and/or as improved replacement materials for lower grades of steel with inferior corrosion resistance.
Recent interest has been shown in the
2
2.1 TEXTURE IN METALS 2.1.1. Origins of Texture
(a) Solidifcation
A texture can arise as a result of directional solidifcation, and columnar grains in an ingot usually exhibit preferred orientation. For example, the growth. direction in bcc metals is invariably 4100> , i.e.,
^lOO^ directions are normal to the mould wall and parallel with the direction of heat flow and hence the axis of
columnar grains. The central equiaxed zone of an ingot does not show preferred orientation.
(b)______ Deformation
A deformation texture is developed due to rotation of crystals by slip under the action of imposed stress/ strain. The re-orientation is gradual, proceeding until a texture is reached that is stable against indefinitely
continued flow of the same type. The nature of the stable texture is influenced by the imposed stress system and the slip systems operative in the material. Under tension the stress axis moves towards the operative slip direction whilst in compression it moves towards the pole
(2)
of the operative slip plane.
directions parallel with the axis of stressing. This type of preferred orientation is known as a "wire11 or "fibre” texture. In general there are no special radial orientations, although in wire drawing radial compressive ^stresses may cause certain planes to lie parallel with
the surface of the wire to produce a "cylindrical”
■Gexture. a simp±e more texture is usually
described in terms of a direction <uvw> parallel with the stress axis.
Rolling of sheet or strip under plane strain conditions causes alignment of specific crystallographic directions with the rolling direction and specific planes with the rolling plane. Renee rolling textures are often described in terms of one or more ideal orientations
expressed as {hkli <uvw> where {hkiy iS the rolling plane and<uvw>the rolling direction.
Deformation textures can be influenced by
temperature, particularly if it is high enough to permit recrytallisation, e.g., hot rolling produces a much less pronounced texture than cold rolling due to dynamic
recrystallisation. The occurrence of a phase transformation may further randomise the crystal orientations.
Second phases may also have an effect, e.g., high carbon steels form less pronounced textures than low
carbon steels due to Fe^C being harder than ferrite and forcing it to flow in irregular directions.
( c)______ Re crystallisation
Ifhen a cold worked metal containing a strong preferred orientation is annealed there are a number of . possibilities. The final annealing texture could be :
(i) the same as the deformation texture, particularly if recovery alone occurs,
(ii) a different texture due to recrystallisation into new grains with orientations different from but
deformation texture, or
(iii) a randomised texture, especially if a phase transformation occurs during annealing.
Recrystallisation textures are affected by
composition, time and temperature of annealing, and prior processing. In particular, important factors include the deformation texture, microstructure and presence or absence of a phase transformation.
2.1.2. Representation of Texture
Although a texture can be labelled by a single ideal orientation, <uvw> or {hkll <’uvw> , this type of description is often inadequate in practice. More
usually, descriptions are in terms of more than one ideal orientation or the spread between ideal orientations.
A more complete description of a texture is given by a pole figure, determined by X-ray texture
(5)
goniometry. A pole figure is a stereographic
projection which shows the variation in pole density with (5) orientation for a selected set of crystal planes.
Intensities are plotted as multiples of the intensity expected from a randomly oriented specimen and the pole figure is contoured. Ideal orientations may be plotted on the pole figure for reference. For cubic crystals, a- particular orientation on a pole figure can be
(6)
Three ^1003 poles
Four {lll\ poles
Six {.HO} poles Twelve {hkO} poles Twenty-four {hkl} poles
For simplicity, practical selection of poles is normally limited to {100} , {in} or {no} . Hoi^ever,
since there is no Bragg reflection from the {100} planes of bcc or fee metals, the second order {.200*i reflection must be measured, and it is usual to refer to the pole figure in terms of the {200} reflection used in its
determination. A similar situation arises with the {222\ reflection in bcc metals and the {,220} reflection in fee metals. Bcc textures are therefore described by {no} ,
- {200} or {222} pole figures and fee textures by *{llli , {200} or {220} pole figures.
Conventional pole figures are the most common method of presenting textural data for processes
requiring specification of two perpendicular directions. For deformation processes of higher symmetry that require only one axis to be specified, an inverse pole figure or axis distribution chart can be useful. This figure uses a stereographic unit triangle as a reference frame and contour lines to show the frequency at which various directions in the crystal coincide with the specimen axis
(7)
under consideration.
An alternative description of texture is
(8)
a given orientation. Methods of calculating the orientation distribution function from conventional pole
(9)
figure data are now available 7 and have been used for quantification of relationships between texture and
mechanical properties. (8,10) Three-dimensional odf1s are computed from data obtained from several pole figures of different reflecting planes. Preferred orientations can be described by density functions within the three-dimensional figure, using contour surfaces to separate volumes of higher and lower orientation density. In order to present the results it is usual to take a series of sections through the figure, showing the contour
(8)
surfaces as a series of contour lines. 0dffs have not be applied as widely as conventional pole figures and
axis distribution charts, due to their greater complexity and the large amount of data needed.
2.1.3* General Observations in BCC Metals (a ) Tension and Compression Textures
Body cnntred cubic metals invariably have a (l 3) simple <110> fibre texture after cold drawing. * Compression textures consist of a major <111> fibre
(1 3)
texture component plus a weaker <100> component. (b )_______Rolling Textures
The cold rolling textures of. all bcc metals are essentially the same and are largely unaffected by alloy
Uoolj <011> through {lll'i <011> to {ill] <il2>. (7) The spread has also been described in terns of partial fibre textures.
Barrett and Levenson, investigating rotations of single crystals of iron, recorded two continuous sets of orientations
(i) <110*^ parallel with ED and £001^ between 0° and 4-5-55° from the rolling plane,
(ii) {.lllls parallel With the rolling plane and a spread about the sheet plane normal (HD); (i.e. a partial tension axis along ED and a partial compression axis along ND (RD// < 110> , HD//^111*> ).
(12)
Richards and Ormay preferred to depict the cold rolling textures of low carbon steels in terms of two partial <110> fibre textures A and B
(A) ... <110<> parallel to RD, with orientations in the spread from (211) [Oil] (100) [Olll
-(211) [Oil] ;
(S) .... O.10> 60° away from RD (30° from ND) in the plane containing RD and ND, and comprising the
spread from (211) [110] - (554-) [225] - (121) [101] .
In general, it is found that the strongest
component is £l00\ <011> and that {.1121 ^llO^ is always present. The { m l <110 > orientation has been reported less frequently and {llli <'112> has been reported as a
(3) strong component in some instances but not in others.
( c)______ Recrystallisation Textures
and annealed bcc metals have included the following
2
.
2.
THEORIES 0? -DEFORMATION TEXTURES III BCC. METALS 2.2.1. Slip SystemsDevelopment of a deformation texture is brought about mainly by crystal rotations due to slip. In bcc crystals the slip direction is invariably <111> , but the slip plane is not well defined. For many years there has been a dispute (-*-4-20) ag ^cc Ee-ta]_s deform by
(i) <111> pencil glide (non-crystallographic slip in closest packed directions on planes of maximum shear stress),
(ii) a combination of £110}
<m> ,
<m>
and £.123} <111> slip, or(iii) elementary slip on £110} and/or i.112} planes giving the appearance of (i) or (ii).
It is often assumed that, when all three slip planes
( U 10} , £112} and £123} ) operate, the critical resolved shear stress for slip ( ) on.each plane is equal.
(21)
However, Smoluschowski and Opinsky suggested that the magnitudes of the critical resolved shear stresses for
slip on {no} , {112} and -{123^ planes are in the ratio 1:1.03:1.05 respectively.
2.2.2. Deformation Models
Theories of texture development tend to fall into two categories depending on the deformation model chosen, i.e., either the imposed stress model (Sachs) or the
imposed strain model (Taylor).
(2 2)
operative slip systems is governed by the principle of minimum internal work, i.e., the combination which will operate is that giving the lowest algebraic sum of shears. An indication of the work necessary to carry out the
deformation of a grain in a particular orientation is given by the Taylor nM-Faetorl! or stress factor, which is the ratio of the applied stress to the shear stress
( O O P Q\
developed on the operative slip plane(s). 9
Grains of low M-value deform easily, but high M-value (22 23)
grains are crystallographically hard. '
Although Taylor failed to recognise the necessity of ensuring that the yield criterion was not violated, it
(p) p ^ )
was later shown that Taylor1s minimum shear sum
was in fact equivalent to fulfilment of the yield criterion. The equivalence of Taylor*s theory with a later analysis,
(26)
developed by Bishop and Hill and based on maximum ( p / P ^ )
external work, was also demonstrated.
vJhereas the Taylor model ignores stress equilibrium requirements and concentrates on grain
continuity, the reverse is true of the Sachs constant stress (27)
model which, for a uniaxial tensile test, leads to results that would be obtained assuming a series of
(9 5)
parallel but free single crystals. ^he component of strain in the tensile direction would be the same for every grain, although all other strain components would vary
The Sachs model is considered a lower bound theory and the Taylor model an upper bound 'theory. The Taylor analysis generally leads to superior predictions of the flow curve, strain ratios and deformation
(10 28)
textures. * Recently Wierzbanowski and (29)
Jasienski concluded from numerical predictions that the essential difference between the two models is the
occurrence of latent slip in Taylor-type deformation, i.e., principal slip systems account for the macroscopic shape change but differences in shape between individual grains are accounted for by latent slip.
2.2.3. Rolling: Textures C 22)
Taylor considered only fee metals in his analysis, and for a long time this mathematical solution was considered too unwieldy to apply to bcc metals, in which the large number of slip systems available results in there being over a million ways of choosing five. However, more recently a number of authors have applied computer simulation studies to the deformation of bcc metals, using the generalised Taylor model to predict the combination of slip systems which would operate for any given initial orientation and hence, to calculate lattice .
rotations. (20,23,30,31) Earlier theories of bcc texture development required additional assumptions to make the data manageable.
(2)
slip. For the high degree of preferred orientation observed after severe plastic deformation, there must, therefore, be a considerable amount-of single and duplex slip to effect the necessary grain rotations, with some multiple slip to maintain grain boundary cohesion.
Once the effective tensile stress reaches a direction sufficiently symmetrical for multiple slip to take place, no further rotation would occur and a stable end
orientation would be achieved. In order to predict rolling textures, it was assumed that orientations would persist which satisfied both tension and compression end points simultaneously. The bcc rolling textures predicted
(2)
for slip on various systems were listed as follox^s.
Slip System Textures in order of decreasing magnitude
[no\, <111> tL12?S <111> ll23h <11I>
3 systems
{211^ <110 *— 3ii> , {iiil<no> ,{ioo3 <oi]> tLlli <110 <— 211> , lioo3<on>
{311} <110 <— 3ii> , {ni!j<iio> ,Uoo3 <oil> (111^ <110 ~5il>, {liii <no> , {.1003 <oii>
(32)
Dillamore and Roberts developed a theory of rolling textures based on primary and conjugate slip followed by cross-slip, assuming a bi-axial state of
stress. For bcc metals, assuming operative slip systems of type {110 S < 111> , they concluded that most material would rotate under the action of primary and conjugate
slip to orientations of type {_112"i ^llO^ and that, after cross slip, the rolling texture should be adequately
{211} <011> .
(2)
Neither Calnan and Clews nor Dillamore and Roberts (32) accounted for the strong {lll*i 0-12>
component observed in some, but not all, rolling textures. (33)
However, Dillamore, Butler and Green later predicted, from the results of a total strain analysis of slip
rotations during rolling, that the stable end orientations for bcc metals were {.1123
<no>
, {.001S<no>
ana{ll, 11, S <4-, 4-, 11> . They concluded that -{.111} ^112'> x^as not a stable end orientation.
(31)
Kamijo used a method similar to that of
Dillamore and Roberts considering slip on {.110} {112} and {.123} planes and assuming T' {.123} = V L {ll2} =
1.0 5 T 0 U l ° 3 , to study slip rotations tox/ards stable end positions on a stereographic projection. He proposed that the operation of slip systems of types
ton's 4m >
and {112"S <lir> would account for development oftexture components till's <112> , {.1123 <110> and
tlOOls <011> , although only the latter tx^ro components would remain as stable end orientations. The gradual displacement of {ill} <Cll2> toxvrards {.112} ^110^ x^as attributed to conjugate slip on {lio} ^lll^> systems. Kami jo a]_so concluded that the {110'S < 001>
orientation (when present), although not developed by slip rotations, is stable provided that the rolling direction does not deviate even slightly tox^ards *0.11> . If this deviation does occur, slip rotations lead to development of the {.111} <112'> orientation (inevitably via
Dillamore and Katoh compared theoretical pole figures and odf maps, derived using both Sachs and Taylor theories and assuming <111> pencil glide, with experimental results for iron cold rolled to 70% RA. Discrepancies between predicted and observed data were
attributed to'non-homogeneous deformation. It was pointed out that, if favourably oriented grains (low Taylor
M-value) are to undergo exactly the same strain as harder, less favourably oriented grains (high Taylor M-value), the stress continuity condition is violated. In reality the softer grains will yield first and it will require stress concentrations within these grains to cause the harder grains to deform. Hence the softer grains will incur more lattice curvature, since they will be forced to accommodate any harder grains which fail to conform to
(28)
the imposed shape change. Dillamore and Katoh
suggested that it would be more favourable for the harder grains to deform heterogeneously, with a strain different from the mean strain, if this resulted in a reduction of the total energy of deformation. The pofter grains must then accommodate these heterogeneities.
In view of the complexity of deformation of real polycrystals in which equilibrium, yield and
compatibility requirements must be met simultaneously and there is the additional complication of non-homogeneous flow and deformation bands, discrepancies between
observations and predictions of deformation texture, based on either constant stress or constant strain, are
2.3. ■ THEORIES OF R5CR-YSTALLISATION TEXTURES- IN
BCC METALS 2.3.1. • Oriented Growth versus Oriented Nueleation
Historically, two principal mechanisms have been proposed to account for annealing textures
(i) The Oriented Growth theory, assumes that
all possible orientations are present at the start of recrystallisation and that
selection of favoured ones occurs during growth.
(ii) The Oriented Nueleation theory assumes that the growth rate is independent of the
orientation of newly formed grains, and that this orientation depends on the availability of nuclei in the deformation substructure# More recently, compromise theories have been proposed in which both nueleation and growth conditions have to be satisfied. There has been much
experimentation and discussion in trying to decide which . (13 35“q8) approach best describes the observed behaviour. ^
It is found that recrystallisation textures often bear crystallographic relationships to the original
deformation texture. For bcc metals, the relationship is described as a 25°- 35° rotation about a <110> axis which is common to both the cold working and
recrystallisation textures. (3,7,19*36) g u ^
relationships were supposed to correspond to high rates (19) of growth associated with high boundary mobility,
low angle (<15° misorientation) and possibly of very high angle (>4-5°) boundaries are restricted compared with the
(10 38)
intermediate range.
(13)
Dillamore used a purely geometric method, based on oriented growth, to predict major components of annealing textures. Under conditions of high growth rate, the major components were predicte a as {hhl} <110> with
{.111$ <110 > predominating, whereas for low growth rate, the major components were predicted as
{55l\
<225> and110,8,7} <1,3,5>. (It should be pointed out that the latter is not actually a true orientation and was possibly meant to be 111,8,7} <1,3,5> ).
(37)
Dillamore, Smith and Watson later compared growth and nueleation theories on the basis of results obtained from electron miscroscope examination of pure iron and low carbon steels. Having evaluated the driving force for recrystallisation as a function of orientation, they concluded that, although both theories forecast broadly similar textures, oriented nueleation predicts a component near {00l3 <110> (arising from grain-boundary nueleation), which is in fact observed experimentally but is not accounted for by oriented growth.
It is now generally agreed that experimental evidence is more in favour ofioriented. nueleation, at
(7 10 39 L0)
least as far as bcc metals are concerned. j Dillamore has criticised his earlier geometric approach, deciding that, although simple formal
The ’’special growth relationship” concept of pure
oriented growth theory was refuted on the basis of electron microscope observations which showed that all probable nueleation sites occur in regions of high lattice
curvature where, by definition, a special growth relationship cannot be sustained.
Although oriented nueleation is more widely
accepted, it is still recognised that growth processes can be important, e.g., in situations where precipitation and recrystallisation interact. During recrystallisation, precipitates forming preferentially on new grain
boundaries inhibit growth of the first formed grains, forcing further nueleation to occur in unrecrystallised regions from less favourable nuclei. In such cases, the resultant annealing texture tends to be similar to the deformation texture. Also, alloying elements in dilute
solid solution have the effect of increasing the ratio of nueleation rate to growth rate, thereby reducing the
sharpness of the annealing texture and causing it to
resemble the deformation texture more closely. The effect of decreasing solute content is seen in steels with very low manganese and/or interstitial contents, where the {.111^
sheet plane texture component is markedly strengthened during recrystallisation.
2.3*2. Nueleation
envisaged as a continuous process of growth, in which the embryo is stable with respect to its surroundings at all stages. However, the velocity of growth is not constant: there' is an initial slow growth or incubation period
corresponding with the nueleation stage, followed by a sharp increase in grox^th rate coinciding with the start of the classical growth stage.
Most workers (^2-4-5) nQW agree that no new orientations are developed during recrystallisation, so that a nucleus must either pre-exist in the deformed state or be evolved in the recovery process. A nucleus
comprises a nearly perfect lattice region, of the order of l ^ m diameter, which is separated from the deformed matrix by a nearly formed high angle boundary and is capable of growth into the matrix in at least one direction. (^>4-6) The nueleation process consists of development of such a region, usually by grox^th of subgrains in the deformed matrix, and electron microscope observations have shoxm a number of configurations in which such nuclei are likely to occur. Nueleation sites available at low
(a) -In-situ Nueleation
For a subgrain to act as a nucleus it must be capable of growing into the deformed matrix and quickly
(4.7)
achieving a high angle boundary. High ^.ocal stored energy (associated with small subgrain size but large variation in size) and sharp lattice curvature (which allows the growing embryo to develop a high angle grain boundary quickly) are necessary for rapid subgrain
growth. (4-6-49) Consequently, nuclei develop
preferentially in those regions where there are high local misorientations, e.g., grain boundaries and transition bands. However, after moderate to high cold reductions, individual subgrains in the grain interiors may be
sufficiently misoriented to achieve these conditions. The distribution of stored energy within a
deformed structure can vary with orientation of individual grains, but conflicting results exist as to the ranking of
(19)
various orientations. According to Smith and Dillamore, the stored energy of cold working (V) in bcc metals
increases in the following order
V {.100} <013>^V l21l} <011>-=-V fr.ll} <uvw>^V {pilJs <100> .
In-situ nueleation should, therefore, normally occur in the reverse order, i.e., {oil}, {ill} , {211} , lioo} . However, Takechi, Kado and Nagashima '^0) foun(j that, in low carbon steel rolled to very high reductions
(^ 90% RA), the order of stored energy of the main
components changed to
whereas, in low carbon, niobium-stabilised steels cold rolled to 12% RA, Willis and Hatherly (51) recorded
V {.211$ > V tL00$ > V {111$ .
In the absence of restrictions to growth, nuclei formed earliest should constitute the largest grains in the recrystallis.ed:_material and should, therefore, dominate the recrystallisation texture, provided that there are
sufficient numbers of viable nuclei of that component. In heavily cold worked bcc metals, the fact that in-situ nucleated luo'i grains do not constitute a major component of the recrystallisation texture is attributed to limited
/ ; nj availability of 1110$ nuclei in the deformed structure.
(b) Grain Boundary Nueleation
(Ll)
According to Hutchinson ^ there are two possible mechanisms for grain boundary nueleation
3-.-(i) an existing high angle boundary may bow out into the grain which has the higher stored energy at the interface (termed strain induced boundary migration), or (ii) a nucleus may develop from a subgrain
close to the grain boundary.
Strain induced boundary migration (SIBM) is accepted by many authors as an important origin of new grains at low to moderate (l0%-50% RA)
deformations, ^ ^ 9 although Doherty and Gahn
suggested that preferential subgrain growth close to the boundary might be a necessary precursor to this mechanism.
(L6)
metals, according to the following diagrams
After Cold Deformation During Annealing Rolling direction--- >
O; > 120° y
The shape change produced by deformation causes the
triple point to deviate from 120°. During annealing, as the boundaries attempt to re-establish the equilibrium angle, subgrains in the 6--^ region may become enlarged and more favourable as nuclei.
Grain boundary nueleation favours orientations close to, although often rotated slightly away from, the
( L^ 17)
stable deformation texture. ' Dillamore and
(12)
Katoh considered that material at the extremities of the deformation texture spread would probably be
associated with grain boundary regions. Bcc
recrystallisation texture components believed to originate from grain boundary nuclei include
iiooj <oii> ,
{.554-^ <225> , { i l l } <110>
and{ iu }
<&ll> .(42,46,47)
(e)______Transition Band Nueleation and Shear Band Nueleation
(i) Transition Bands
known as deformation bands. These are separated by fairly narrow nicrobands, known as transition bands, accommodating the misorientation but containing a small volume of the original orientation. Within a transition band, the high local stored energy and rapid change in orientation create a suitable source of potential
recrystallisation nuclei. (^,4-2) Deformation bands and (52)
transition bands may arise in several ways
(i) local differences in stress may cause different parts of a crystal to undergo different strains, inducing relative rotation within the grain,
(ii) different combinations of slip systems may separately accommodate the imposed strain in different parts of the crystal, giving different slip rotations,
(iii) orientations which are metasable during deformation may split into two twin-related orientations during rolling.1 - *
A {110\ ^001> texture component in bcc metals can, with increasing deformation, split into two twin- related .{ill} <112> components, an(j transition band nueleation is responsible for reproduction of the original
{_110*i <001^ component on annealing. (3/) gu (53) rep0rted
that microbands separating neighbouring deformation bands in silicon iron, cold rolled to 30$ RA, were sources of {.113 J <uvw> recrystallisation nuclei.
(52)
Dillamore et al analysed the conditions under which transition bands develop and proposed a model
They envisaged the structure of a transition band to be of the form shown in the following diagrams
:-After Gold Rolling During Annealing
8
D
^ = energy of vertical sub-boundaries O" = energy of horizontal sub-boundaries
dr = length of average subgrain
= length of large subgrain ahgfdb d^ = width of average subgrain.
The vertical sub-boundaries of energy are parallel with the transition band and would have a relatively large
misorientation; the horizontal boundaries of energy or, may have smaller misorientations. During annealing,
the triple point angles should relax to an equilibrium configuration, as shown, with the angle (j) given by
:-COS (f)
2 or Equation (l)
grow, points b and c must cone into contact before this equilibrium angle is achieved. This will only occur if the particular subgrain has a sufficient size advantage compared with the average subgrain such that
~) ....Equation (2) Dr ^ L (dr + at Acr.2 \ - 1
( ^ )
Under these conditions, it will be able to grow both normal to the transition band and along it. Growth
perpendicular to the transition band would increase the misorientation of the subgrain boundaries and hence their
(52)
mobility. From their analysis, the authors concluded that intermediate lattice curvatures were necessary for transition band nueleation. At high strains the critical value of increases such that transition bands may cease to be viable nueleation $ites, whereas at low strains
transition bands are not sufficiently well developed for equation (2) to be satisfied.
(ii) Shear Bands
After heavy cold rolling reductions ( E > 1.0), instabilities may develop during deformation and "shear bands" of elongated subgrains may form, inclined at an angle of ^ - 35° to the rolling direction (as viexvred
perpendicular to the transverse direction). These macroscopic shear bands cross grain boundaries without deviation, and the planes of the shear bands are related to specimen geometry rather than crystallography.
Unlike transition bands, changes in orientation across
(cL 55)
of material, and neighbouring volumes develop bands of (54-)
opposing image.
Shear band development is preceded by formation of microbands of elongated subgrains, which form initially on the slip planes and become .aligned with the rolling plane at strain levels of £e*1.0 ( ^ 60$ RA) . (54->55) These microbands are separated by lou-angle boundaries. They do not cross grain boundaries.
Shear bands are reputed to provide favoured sites for nueleation. However, in ferritic materials,
macroscopic shear bands do not appear to develop at strains below £ — 1.6 (80$ RA) and they are not abundant at strains ^ ^ 4- (98$ RA) . ^54.) Osterle, tJever and Bunge (55)
observed shear bands optically in alpha-iron cold-rolled to 85$ RA, but were unable to detect shear bands in the sane material using the electron microscope
(d)______Effect of Dispersed Second-phase Particles
A dispersion of second-phase particles may affect recrystallisation in the following ways
:-(i)____ Precipitation after cold work
Precipitation after cold work but before
recrystallisation influences the mobility of dislocations during recovery, inhibiting subgrain growth except for a few "breakaway" subgrains. The resultant structure tends to be coarse grained with a relatively sharp
(39) recrystallisation texture.
Precipitation during recrystallisation occurs predominantly on moving grain boundaries, impeding their motion and allox^ing time for less favoured nueleation
consumes the deformed matrix. In this instance, the annealing texture is likely to be similar to the
(3 9)
deformation texture, but reduced in intensity. (ii): Particles present before cold work
The effect of second phase dispersion present before cold deformation depends to a large extent on particle size and distribution: a coarse dispersion accelerates recrystallisation whereas very fine
(/I 56-59)
precipitates inhibit recrystallisation. ^ 9
Coarse particles stimulate nueleation at or near their surfaces, generally promoting a relatively fine
grained structure with a texture similar to the
(5 6 57) (60)
deformation texture. * Chan and Humphreys have recently studied particle-stimulated nueleation
in situ using the High Voltage Electron I4icroscope (HVEM) . In an aluminium-nickel alloy containing a coarse
dispersion of Al^Ni particles, the majority of such nuclei were misoriented by 15°-4-5° to the matrix. It was also noted that some particle-nucleated grains stopped growing at an early stage. The authors concluded that particle stimulated nueleation causes a randomisation of texture in the early stages of recrystallisation, and that sharper textures observed after completion of recrystallisation could be associated with more rapid growth of selected orientations.
Fine particles interact with dislocations,
retarding recovery and hindering subgrain boundary motion. Only the largest subgrains can act as nuclei, leading to a coarse grained structure showing marked texture
actually utilised this effect to enhance the {llli <Cuvt/> component of aluminium-killed, low-carbon steel,at the expense of the {.100^, component.
(6l)
Nes found that co-existence of fine and
coarse dispersions reduces the effectiveness of the coarse particles in stimulating nueleation. He argued that
this reduced performance is inevitable, given that the fine dispersion introduces subgrain growth selectivity in the manner outlined.
In a study of the effect of carbide and nitride particles on the recrystallisation of ferrite, C-ladman,
( ^ D )
Mclvor and Pickering reported that particles ~ 0.5 - 20^-m (5 x 10³ - 200 x 103 A0) diameter
acclerated nueleation whereas fine particles 5 nm (50 A0) diameter retarded nueleation. It was. also found that
small volume fractions of intermediate sized particles 20 nm (200 A0) diameter had little effect on
recrystallisation, although they could be effective in (62) inhibiting subsequent grain growth. Other studies indicated a marked retardation of recrystallisation at interparticle spacings equivalent to the deformation
cell diameter.
Model for particle-retarded nueleation (63)
:-quation (3)
where
= length of favoured subgrain parallel with
= width of average subgrain
O' *u = energy of vertical sub-boundaries CT, = energy of horizontal sub-boundaries c< = a constant of the order of unity f = volume fraction of precipitate r = mean particle radius.
This model implies that it is the relationship between cell size and interparticle spacing which is important. For a constant volume fraction of precipitate, smaller particle sizes can be tolerated without risk of inhibiting nueleation as the average subgrain size decreases.
Models for particle-stimulated nueleation
noted that the cell structure in the matrix remote from coarse particles showed well-developed plate shaped
subgrains elongated parallel with the rolling direction, whereas subgrains in a narrow region around each
particle were much smaller and more equiaxed.
Misorientations of up to 35° were observed between these regions, termed deformation zones,and the matrix. It was suggested that the size of these deformation zones
transition band dr length of average subgrain parallel with
transition band
Particle stimulated nueleation in deformed
(58)
I tu ]
themselves. Humphryes proposed a model for
nueleation within such zones from pre-existing subgrains. The nucleus is envisaged as growing towards and around the particle to consume the entire deformation zone, as illustrated in the following sequence of diagrams
(a) After cold
deformation (d) Entire deformationis consumed by A
favoured \ subgrain A ^
(b)—(c) Subgrain A grows towards and around the partiole~
At this stage growth may continue into the matrix, or it may cease and eventually the nucleus will be consumed by more favourable growing grains. The critical particle diameter for effective particle stimulated nueleation is given by the following equation
:-r ^ ... ... Equation (4-)
where :
r = radius of nucleus (assumed = particle diameter) If = grained boundary energy
E = stored energy.
(59)
( 58)
substructure envisaged by Humphreys and
(12)
D i l l a m o r e fs r e p r e s entation of a transition band, such
that the Dilla m o r e analysis could be used to determine the
critical dimensions for nue l e a t i o n from a f a v o u r e d
over-(5 9) ' '
size subgrain. Ne s re-expressed the critical
condition for continued growth of a nucleus beyond the
d e f o r mation zone as follows
:-£ = i P X... ... Equation (5) K An g'
w here :
(T = mean diameter of ne w grain (= particle
diameter)
- mean m a t r i x sub-boundary spacing
Y = specific energy of n e w grain bou n d a r y towards m a t r i x
Y = mean matr i x sub-boundary specific energy
K = dimensionless constant ~ 1.
Since
Y
is ^Y
(for small m i s o r i e n t a t i o n s ,Y
>Y
;for miso r i e n t a t i o n s ^ 1 5 ° , T = Y ‘ •), the value of £
must be greater than the average subgrain size, or at least
equal to it at h igh strains.
2.3.3» Grain Growth
Grain grox>rth occurs after completion of primary recrystallisation, with larger than average grains growing at the expense of subcritical grains. The driving force for grain growth is a reduction in grain boundary
(U5f 4-7) energy.
this component should be enhanced by grain growth. The dominant components of a primary recrystallisation texture will often have this size advantage and so grain growth normally makes the primary recrystallisation texture
sharper and more well-defined, (hi,ok)
Fine second phase particles may present a
2,4. PRESS F0RMA3ILITY OF METALS
There is no single index which will enable the press formability of a specific material to be reliably
(66)
predicted for all products or production conditions. However, for a given tool configuration and lubrication conditions, the forming limit (which relates primarily to
(66 67)
the exhaustion of ductility ’ is governed by the inherent formability of the metal itself. The most influential characteristics are plastic anisotropy, work hardening ability and grain size.
Anisotropy caused by mechanical fibering may have a profound effect on both stretching and drawing
characteristics. However, mechanical fibering is not a significant source of anisotropy in lowT carbon, clean steels and will not be considered further.
Preferred orientation is the other source of
plastic anisotropy, which affects mainly deep drawability. The orientation of grains affects the ease of deformation in a particular mode and determines whether the material is resistant to thinning, in bcc metals texture components with {llli planes parallel to the sheet surface are effective in improving deep drawability whilst
v i (6°)
1100$ <uvw> components are most detrimental.
Stretch formability is controlled by the work hardening rate, which is largely unaffected by
2.4-»l. Principles of Press Forming Operations
Most press forming operations are a complex
interaction of stretching and deep drawing. Usually one of these processes will predominate, but both will be '• taking place simultaneously. However, in orcier to analyse the factors which influence pressing behaviour it is
necessary to consider their effect on simple stretch forming and deep drawing operations.
(a) Simple Bi-axial Stretching
The tool configuration for simple bi-axial stretching is shown in the following diagram
Punch Pressure (or hydraulic pressure)
Blankholder pressure
iBlankholder
The blankholder pressure is sufficient to prevent the inward movement of material in the flange. When
pressure is applied, either hydraulically or via a round nosed punch, the material over the die becomes stretched biaxially to form a dome-shaped cup. The operation is completed when the maximum; or required depth of cup is obtained.
plane of the sheet ( O ’ and ^eing of equal
magnitude and the normal stress C = 0. Also, since d = -d deformation and failure can occur
2
only by sheet thinning. When a punch is used, the
material which is in contact with the punch is restrained and the stress system is not pure biaxial tension.
(b)_______ Flat-bottomed Cup Drawing
The tool configuration during simple flat- bottomed cup drawing, starting with a circular blank, is shown in the following diagram
:-Punch Pressure
Drawing zone''
Blankholder pressure
punch profile
radius h
'
\
Stretch-formed zones
^Blankholder "Flange ’
‘Die profile radius SEroning
The pressure on the blankholder is insufficient to prevent inward movement of material in the flange, so that as the punch descends it causes material to flow inwards over the die profile radius to form the walls of the cup. The operation is complete when the periphery of the blank is reduced to the circumference of the cup wall. Since there occurs a zone of material which is stretched over the punch profile radius the operation is not,
The requirement of blank holder pressure becomes apparent from the following argument. The following diagram shows a sector from a circular blank prior to drawing
:-During movement into the die mouth, arc and radius R-^ have to reduce to and R2 causing a
>
displacement of material in the shaded areas. This
condition prevails throughout the circular blank, setting up a hoop compressive stress around the annular rim
outside the die aperture. Without some blankholder pressure this stress would cause buckling or wrinkling.
The following diagram shows the directions of the principal stresses in the flange and the wall of a partly-drawn cup
:-:or
In the flange, the effect of blankholder pressure is relatively small and can be ignored ( 0“ ^ 0). The
important stresses are therefore, C"^ (radial tension) and (circumferential compression). Also, since little thickening occurs, d £. ^ = 0, and a condition of plane strain is imposed.
2.A.2. Earing
Earing is the waviness of the. rim of cylindrical cups deep drawn from circular blanks ^; it is not observed in articles produced by pure stretch forming. The waviness appears in the extremities of the wall and in
/ nr\ \
a trough is significantly thicker than material beneath an ear, the variation in thickness being most pronounced at a level corresponding with the bottom of the troughs. For quantitative comparisons, the extent of earing is
f r*r\ \ usually calculated from the following formula
t Earing = - trough height } 1Q0
® Mean cup neishtcup height
Equation (6)
2.k*3. The Erichsen Test
The Erichsen test is a widely used simulative test for stretch formability. >71,72) .^is £@3-5
a spherical ball punch is used to bulge sheet metal at a specified rate until either necking or fracture occurs, punch movement to drop-in-load, necking or fracture being
(72)
recorded. The test is covered by an ASTM
(72) (73)
standard and a British standard describes a modified version, although the only difference is the
(73) specification of a range of blankholder force.
Test results can vary with blankholder force,
(72) type of lubrication and choice of end point criterion.
Use of polythene sheet over the punch as a lubricant seems (71)
to give the most reproducible conditions.
2.A.4. - The Swift Cupping Test
Kemmis. jn this test, a standard sized punch
(32 mm. diameter or 50 mm. diameter) is used and
drawability is measured as the maximum blank diameter (D )c which can be drawn x^ithout failure. Blank sizes are increased by increments of 2.5 mm. and sheet metal is rated in terms of the limiting drawing ratio (LDR) defined as (65’66)
p Equation (7) .
critical blank diameter punch diameter
The test results can vary with deformation rate, (7 type of lubrication and die clearance/design. Kemmis recommends die sizes appropriate to various sheet
thicknesses in the range of 0.3 mm. to 1.86 mm., and a drawing speed which is constant but below 35 mm. sec.”**'. Use of polythene sheet lubricant applied only to the die
side of the blank seems to give the most reproducible
(71)
conditions.
The Sx^ift test is essentially a trial and error method of determining the LDR. As such, it is time consuming and requires relatively large amounts of
(7^—77)
material. Modified tests have been developed which make use of the fact that for many materials,
including ferritic stainless steels and other low carbon steels, there is a linear relationship between maximum drawing load and blank diameter. The slope (K) and
LDR =
where
intercept (P ) of this relationship can be obtained by testing two subcritical blanks.
between Dq and a parameter N, x^hich is related to K, PQ and the UTS, to determine D from two subcritical blanksc and a tensile test.
that, if the flange of the blank is clamped after the maximum drawing load is achieved (secondary clamping), then both the drawing load (P^) and the fracture load (P^) can be measured using one blank of subcritical size. If the value of P^ for a second subcritical blank size is determined then the relationship between punch load and blank size is established, and the value of D at thec fracture load can be predicted, according to the
following diagram :>
(75)
In one approach Thorpe used a relationship
(77)
I'Jilson, Sunter and Martin used the principle
Punch Load
(P)
o
D,1 D,2 Dc
2.4. 5» ■' Uniaxial Tensile Data
(a) Maximum Unifora strain ( S-u)
The maximum uniform strain ( £-u) in uniaxial tension is an indication of stretch formability and is, in principle, simple to determine from the maximum point on the load/extension curve. However, this is often flat and extended, making direct determination of £u difficult and inaccurate.
(b )_____ Work hardening coefficient (n)
For many engineering materials, (including ferritic stainless steels), whose flow curves are of the familiar form
CT = V +
J K £ n, the work hardeningcoefficient (n) is equal in value to £ u and is more easily determined, being the gradient of a Ja cr/ft* £ graph.
The n-value effectively controls the increase in yield stress or strength of the material during deformation. The higher the n-value,the steeper is the stress/strain
(66)
curve and the larger the uniform elongation. Low carbon steels and ferritic stainless steels have n-values in the range 0.2 - 0.3 whereas austenitic stainless steels have n-values of the order of 0.4-5-0.5, reflecting their
(67 7°) superior stretch formability. 9
The method of determining strain hardening exponents is covered by an ASTM standard .
(c) Plastic strain ratio (r)
n a u oesu piece. m e vaiue 01 r is given oy :
-■ £ )
r = ' f ' Equation (8)
In
or, since there is less inaccuracy involved in measuring length (L) than thickness (t), (66,81) -^y
Equation (9)
where
w o = width before straining° w^ = width after straining
Lq = length before straining = length after straining
(81)
Dripke and Worner give a detailed.procedure for measurement of r-values, which is also covered by an
7 82)
ASTM standard. Only r-values measured at
equivalent strains are comparable, and i't' is normal practice to use a specified elongation of either 15% or
20%.
For anisotropic materials, r can vary with the direction of testing, and it is usual to measure plastic strain ratios at three orientations within the sheet, i.e., with the tensile axis inclined at 0°, 45° > and 90° to the
r =
In
& )
In
l£ \
rolling direction. The index of mean normal
+ f ' • -u (^6)
anisotropy (r) is given by
:-r = (:-r0 * 2:-r45 + :-r90^ Equation (10)
X
If r is greater than unity the material has high resistance to thinning and should, therefore, possess
(66)
good drawability. In low carbon ferritic steels, it has been found that preferred orientations of the
ncube-on-corner” type, in which
aiii
planes lie parallel_ (83)
with the sheet surface, produce the highest ? values. The variation of r within the plane of the sheet is known as planar anisotropy (Ar) and is given .
by (66’81)
" (ro * r90 ~ Equation (11)
2
The degree of planar anisotropy'affects the earing tendency of the sheet. (°6>70>3l) Eaximum ears form in positions around the circumference of a blank where a tensile test piece ; taken from the ' blank
at that point would show a maximum r@-value. The height of the ears is close to being proportional to
|Ar| ; the higher lArl the greater the earing
(66 VO)
tendency. 9 If A r is positive (rQ, r^Q > r^ ) , earing occurs at ~0° and ^90° to the rolling direction, whereas a negative Ar-value (ryc > r , rnn) leads to4!? o y\j
o . (66,70) . .. . .
sometimes observed in ferritic stainless steels exhibiting a strong {llli <112> recrystallisation texture, whose six-fold symmetry favours the formation of ears at 0° and 60° to the rolling direction. (84-,85)
For optimum drawability, a high value of r and a low value of |Ar\ are required. However, it is usually found that as ? increases, so also does |Arl .
2.1.6. Comparison of Mechanical and Simulative Tests There is no universal agreement as to whether mechanical or simulative tests give the more reliable information about sheet metal press formability, and both are of limited value for prediciting performance in
(71 77)
complex operations. ’ Sometimes the only way of determining what is actually happening is by use of visible strain patterns, assessed from distortion of regular patterns applied to the sheet before
(8687)
forming. * The main uses of formability testing are for ranking materials and for acceptance purposes.
2.1.7. Theoretical Predictions of r-values and Earing Characteristics
A number of Authors have studied the relationship between crystal orientation and plastic anisotropy
p±anes ^wiun equal I on each planej, and also pencilC_/ glide. For prediction of r-values, they considered situations in which either no rotation or a large rotation of the tensile axis occurred. The latter assumption of a large rotation gave more realistic
predictions of r-values for single crystals. Vieth and VJhiteley (®9) also reported that "troughs and ears
predicted according to their calculations corresponded with positions of minimum and maximum r-values, but that no quantitative relationship between r-values and radial
strain could be established.
More recently, Lee and Oh (9^) use(j a similar method to predict r-values for ideal orientations, although they assumed that slip occurred only on
i n o \ <11X> systems in bcc metals, and that all slip systems contributed to the deformation in proportion to their Schmid factors.
(Schmid factor = cos
X
cos ^ ...Equation (12) crwhere
X
= angle between stress axis and slip direction = angle between stress axis and slip planenormal
'f = resolved shear stress on slip system
cr = applied stress )
Lee and Oh (90) use(j resuits of their calculations to estimate r-values of sheet metals, whose textures could be described by one or more ideal orientations, as
follows
where r^ = r-value of texture component i
= volume fraction of texture component i.
2.5. PHYSICAL METALLURGY OF FERRITIC STAINLESS STEELS
2.5.1. • Compositions
Ferritic stainless steels occur over a wide range of chromium contents, from^ll$ to~25$. These steels are generally nickel-free but may contain other additions such as aluminium, molybdenum, niobium or titanium.
The following iron-chromium equilibrium diagram indicates that a simple Fe - 16^ Cr alloy would be
ferritic at all temperatures up to the solidus
Iron-Chromium Equilibrium Diagram
Temperature (°C)
liquid
1(0.
liquid + ferrito
ferrite
1X00.
--ferrite +
iooo-ferrite + cT
H-o to
'Chromium
%
xx w w v w x f u x x w w x w c t x u u u c x x x ^ x x w j . lx c l j - u *3
extends the gamma loop and broadens the (°4 + Y ) (91)
region. Lower chromium varieties, such as AISI 4-10 (12$ Cr, 0.1$C) are austenitic at temperatures around 1000°C and transform to martensite on cooling. (92) By comparison, a 17$ Cr steel has a duplex ( +
Y )
structure at high temperatures and transforms to a mixture of ferrite and martensite on cooling to room temperature. A 20$ Cr steel should be ferritic at all temperatures up
(02)
to the solidus. Ferrite promoting elements such as niobium, titanium, molybdenum and silicon extend the
(°1 oq)
fully ferritic range to lower chromium contents. '
2.5.2. Transformations _
(o/_96)
Castro and Tricot made extensive
investigations into isothermal transformations in 17$ Cr steels. They reported that steels containing 15-17$ Cr and 0.05-0.1$C consist of carbides and ferrite at room temperature in the equilibrium state. Heating to
850°-900°C results in partial transformation to austenite, the temperature at which Y first appears being designated the A^ temperature. At this stage there is little
dissolution of carbides. As the temperature increases above A^, the amount of austenite in the structure
increases progressively to a maximum at the 0-
temperature (temperature of maximum Y content), which coincides roughly with completion of carbide dissolution ( ^ 1050-1100°C). Thereafter the proportion of austenite decreases until it disappears altogether at the
is then stable up to the solidus 14-50°C.
Quenching from above produces first a mixture of ferrite with intergranular and intragranular austenite,
( 9 A)
the latter in a Widmanstatten pattern. This is unavoidable even by energetic quenching of small samples. On further cooling, the austenite transforms to
martensite, the Ms temperature being ~' 150-260°C.
Untempered martensite may thus be a source of brittleness (94) in steels not tempered after high temperature treatments. Precipitation of intergranular and intragranular
carbides and intragranular C^N nitrides also occurs on (95 97)
cooling, even during water quenching. (96)
Further investigations led to the following regression equations for approximate determination of the A^ temperature and the maximum amount of Y at the 0-
temperature as functions of composition
:-Ax (°C) = 30($Cr)+73($Si)-250($C)-280($N)
-66($Mn)-115($Ni)+405 ....Equation (11) max (?) = 170(?N)+120(?C)+30(?Ni)+7(?Mn)
-11.5(?Cr)-11.5(?Si)+186 ....Equation (15)
Castro and Tricot .(96) a-j_so found that nitrogen restricts grain growth by promoting austenite formation and by formation of CrgN nitrides. Nitrogen has no apparent effect on the solidus temperature, whereas
carbon was found to lower it by */ 7°C for an increase of 0.010JC.
we±aa dixit; y ana corrosion resistance, ana vanaaium wnicn was sometimes added to reduce the incidence of roping. For the range 15-19$ Cr, they proposed the following
formulae for estimating the temperature and the maximum austenite content at the 9* temperature
A1 (°C) = 35(?Cr)+60(?Mo)+73(?Si)+170(?Nb) +290(?V)+620(?Ti)+750(Al)+U00(?B) -250(?C)-280(?N)-115(?Ni)-66(?Mn)
-18($Cu)+310 ....Equation (16)
tfmax(?») = 420(?C)+470(?H)+23(?Hi)+9(?Cu)
+7(?Mn)-11.5(?Cr)-11. 5(?Si)-12(?Mo) -23(?V) -47(?Nb) —4-9CfSTi) -52(?Al)
+189 ....Equation (17)
These empirical formulae do not allow for possible interactions between elements because they were determined using experimental melts of 17$Cr steels containing single alloying additions. In the presence of carbon and
nitrogen, the ferrite forming effect of titanium is higher than would appear from its coefficient, due to its
effect in removing these austenite stabilisers from solid solution■■:(which outweighs the effect of simultaneous
titanium removal). It is, therefore, necessary to eliminate titanium, carbon and nitrogen locked inside Ti(CN) particles from the calculation and consider only titanium remaining in solid solution, (98)