http://dx.doi.org/10.4236/jamp.2016.42051
How to cite this paper: Prakash, J. and Prasad, D. (2016) A Method for Polarizing More Number of Impurity-Vacancy Di-poles. Journal of Applied Mathematics and Physics, 4, 461-468. http://dx.doi.org/10.4236/jamp.2016.42051
A Method for Polarizing More Number of
Impurity-Vacancy Dipoles
Jai Prakash
1,2*, Devendra Prasad
31Department of Applied Sciences & Humanities, Buddha Institute of Technology, Gorakhpur, India 2Previously, Department of Physics, D.D.U. Gorakhpur University, Gorakhpur, India
3Department of Physics (Basic Sciences), U P Textile Technology Institute, Kanpur, India
Received 3 September 2015; accepted 26 February 2016; published 29 February 2016
Copyright © 2016 by authors and Scientific Research Publishing Inc.
This work is licensed under the Creative Commons Attribution International License (CC BY). http://creativecommons.org/licenses/by/4.0/
Abstract
Free rotating impurity-vacancy (IV) dipoles in an alkali halide matrix are polarized to the extent of 1/3 of the total number of IV dipoles. An experimental procedure is suggested in this article which will help in the polarization of IV dipoles to the extent of 2/3 of the total number of IV dipoles. In the suggested experimental procedure, the electric field will be applied at first in one direction and then will be applied in succession in opposite direction. Ionic thermocurrent technique is em-ployed to ascertain the increase in polarization of IV dipoles.
Keywords
Ionic Thermocurrent, Frozen-In Polarization, Rapid Cooling Rate, Impurity-Vacancy Dipole
1. Introduction
Whenever a divalent impurity ion is introduced in an alkali halide matrix, a vacancy is created in its neighbor-hood for the sake of charge compensation. Vacancy created at the next nearest neighbour position with respect to the impurity ion forms an impurity-vacancy (IV) dipole. It would be justified to mention that at any instant of time, the vacancy will be located at one of the twelve equivalent sites around the impurity ion along <110> di-
rection. The dipole moment (p) of the created IV dipole will be 2ea where e is the electronic charge and a is the interatomic distance. In the absence of electric field, IV dipoles are randomly oriented in the system. In the presence of polarizing electric field EP, these 12 equally probable orientations of IV dipoles will group into 3 categories as (a) 4 orientations with the energy −pEP favouring preferred direction of orientation, (b) 4 orien-tations with zero energy lying perpendicular to the electric field EP and (c) 4 orientations with the energy
P
pE lie along unpreferred direction of orientation. For the IV dipoles of category (a) in the preferred orienta-tion direcorienta-tion, the polarizaorienta-tion P after the application of electric field increases exponentially [1] [2] with the passage of time t as
( )
p 1 exp t P TP
τ
− −
= (1)
where P T
( )
p is the saturation polarization at the polarization temperature Tp and τ is the relaxation time atthe temperature corresponding to time t. P T
( )
p is expressed through( )
2d P
p
p N p E P T
kT
α
= (2)
where Nd is the number of IV dipoles per unit volume, k is the Boltzmann’s constant and α is a dimension-less geometrical parameter which depends on the possible orientations of the dipole in the crystal structure. For
free rotating dipoles, α has a value of 1/3. Thus, saturation polarization P T
( )
p is expressed as( )
23
d P
p
p N p E P T
kT
= (3)
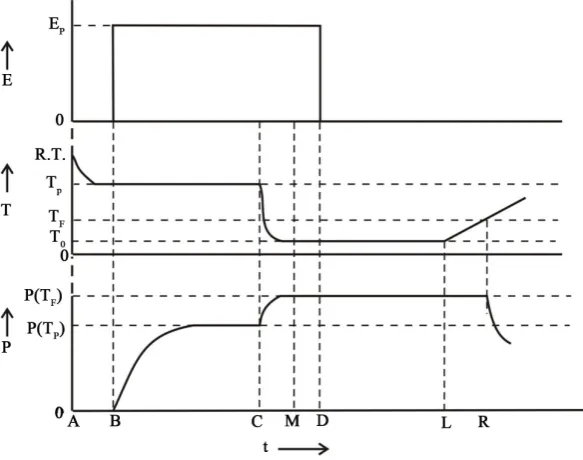
After the application of electric field EP, it is observed that P increases exponentially with the passage of time t in accordance with Equation (1) as shown inFigure 1. R.T in the figure represents the room temperature. It would be justified to mention that IV dipoles of category (b) with zero energy will not contribute to the pola-rization being perpendicular to EP. Further, those IV dipoles wih energy pEP of category (c) will also not contribute to the polarization being in the unpreferred orientation position. Thus, it is only 1/3 of the total num-ber of IV dipoles in the specimen which will be polarized after the application of EP to the extent pre-
sented by Equation (3). Saturation polarization P T
( )
p is obtained through the application of electric field EP [image:2.595.167.459.476.706.2]at the polarization temperature Tp for a time large in comparison to its relaxation time at Tp as shown in the range B to C ofFigure 1. For recording the ionic thermocurrent (ITC) measurement [3] [4] such polarized IV dipoles with the electric field EP still on are rapidly cooled down to a fairly low temperature T0 as shown in
the range C to M of Figure 1. For Tp close to room temperature, P T
( )
p is achieved quickly whereas at lowertemperatures, more time is needed because of large relaxation time at these temperatures in accordance with the Arrhenius relation [5]
0exp
a
E kT
τ τ=
(4)
where τ is the relaxation time at the temperature T, τ0 is the fundamental relaxation time or relaxation time at infinite temperature and Ea is the activation energy for the orientation of IV dipole. The temperature T0 is hence chosen suitably in such a way that the relaxation time at T0 is quite large or practically infinite. Thus, motion of IV dipole is hindered at T0. At such a low temperature the electric field is switched off at the point D of Figure 1, leaving the IV dipoles in the polarized condition since the relaxation time being practically infinite at T0. Consequently, these polarized IV dipoles are frozen-in in the crystalline lattice. Similar experimental steps up to the point D are also followed inFigure 2, the details of which will be given elsewhere later on. The extent of frozen-in polarization is given by Equation (3). It has been an awaited requirement that the polarization in a system be increased to explore its technical potentialities. To have the maximum utilization and technical application of the dielectric properties of the system, workers engaged in the field of dielectric relaxation studies were putting lot of efforts to increase the polarization of the system. With this aim in view, an experimental me-thod has been proposed in this article which helps in increasing the extent of polarization. Thus, frozen-in pola-rized IV dipoles of category (a) can be joined with those IV dipoles of category (c) following the experimental procedure suggested in this article leading to increment in the polarization.
2. Suggested Experimental Technique
After getting the frozen-in polarized IV dipoles at the point D of Figure 1, the specimen is kept for some time at
0
T in the range D to L for establishing equilibrium condition at T0. The system is then heated at the point L of
Figure 1following a constant linear heating rate b according to
0
T =T +bt (5)
Consequently, the temperature T increases from T0 with the passage of time t as shown inFigure 1. When the temperature is increased to TF corresponding to point R of Figure 1, the frozen-in polarized IV dipoles
[image:3.595.138.492.482.706.2]be-come able to depolarize or disorient [6] and continue depolarizing exponentially with the increasing temperature resulting in the appearance of depolarization current I. Resulting depolarization current I can be recorded expe-
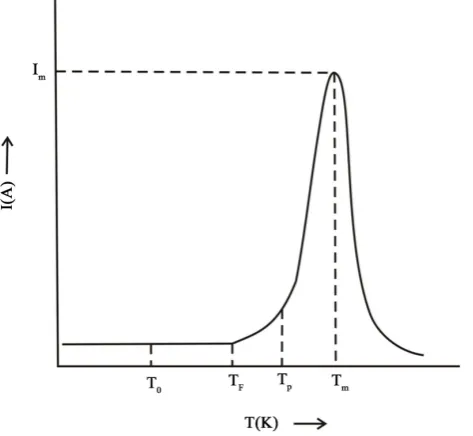
rimentally as a function of T. Plot of I versus T is known as an ITC spectrum [3] [4]. A representative ITC spec-trum is shown inFigure 3 with the respective locations of T0, TF and Tp. An ITC spectrum is an asymmetrical
curve as obvious fromFigure 3. It is very much similar to a thermoluminescence (TL) glow curve involving a monomolecular or first order kinetics. ITC spectrum is mathematically represented by [3] [4]
0
0 0
1
exp exp d
F T
a a
T
Q E E
I T
kT b kT
τ τ
′
= − − − ′
∫
(6)where Qois the total charge released during an ITC run and T′ is an arbitrary temperature in the temperature
range TF to T. The value of Qo is determined from the area of the ITC spectrum using the relation [3] [4]
1 d
F
T
o I T
b
Q =
∫
∞ (7)where d F T I T
∞
∫
represents the total area of the ITC spectrum enclosed in the temperature range TF to ∞. It is obvious from Figure 3 that depolarization current does not start appearing at T0 rather it starts appearing at a slightly higher temperature TF when frozen-in polarized IV dipoles become able to depolarize or disorient [6]. Peak value Im of ITC spectrum appears at the temperature Tm as shown in the figure. The values of T0, TF,p
T , Im, Tm and b are obtained experimentally. These values are needed for characterizing the ITC spectrum and
for evaluating the relevant parameters like Ea and τ0. It is obvious fromFigures 1-3that T0, TF and Tp are different such that Tp >TF >T0. Polarization temperature Tp will lower down to TF while rapidly cool-ing down the specimen from Tp to T0. Consequently, the system will effectively be polarized corresponding to temperature TF. Below TF the relaxation time becomes practically infinite and hence the system is not
pola-rized up to T0. Equation (3) for TF will, hence, be represented by
( )
23
d P
F
F
N p E P T
kT
= (8)
where P T
( )
F is the equilibrium polarization established at TF. The value of TF in Equation (8) depends onthe rate of rapid cooling [7] [8]. During rapidly cooling down the specimen from Tp to T0 in the presence of
P
E , the polarization increases from P T
( )
p to P T( )
F exponentially as shown in Figure 1. The extent of [image:4.595.199.436.485.703.2]in-crease in P T
( )
p depends on the rate of rapid cooling. Higher rate of rapid cooling results in less increment inpolarization because lowering down of the temperature from Tp to TF becomes less and lesswith the in-creasing rate of rapid cooling [7] [8]. If the rate of rapid cooling is infinitely large, the increment in the polariza-
tion will be zero and will remain equal to P T
( )
p because of the fact that time available for polarization ofspe-cimen is much less than the corresponding relaxation time at that temperature. Since, TF depends on the rate of
rapid cooling and hence P T
( )
F also depends consequently on the rate of rapid cooling. It has been establishedby Christodoulides [9] that in ITC measurement where the specimen is rapidly cooled down to a fairly low tem-perature, the effective polarization temperature is less than Tp. This effective polarization temperature is ap-pearing as TF in this article. Thus, T0<TF <Tp finds a justification and happens to be in accordance with the observations of Christodoulides. It must be mentioned, however, that in various references reported in the lite-
rature, P T
( )
p has invariably been inadvertently used [1] [2] in place of P T( )
F .Corresponding to recorded ITC spectrum expressed through Equation (6), depolarization current density (J) is represented by
0
0 0
1
exp exp d
F T
a a
T
Q E E
I
J T
S Sτ kT bτ kT
′
= = − − −
′
∫
(9)where S is the area of the crystal specimen. Obviously J is depolarization current per unit area. The quantity (Qo/S) in Equation (9) represents the frozen-in polarization P T
( )
F at the temperature TF as [3] [4]( )
0F
Q P T
S
= (10)
Combination of Equations (8) and (10) gives
2 3 P o d F
N p E S Q
kT
= (11)
Obviously, Qo depends on the area of the crystal specimen under investigation.
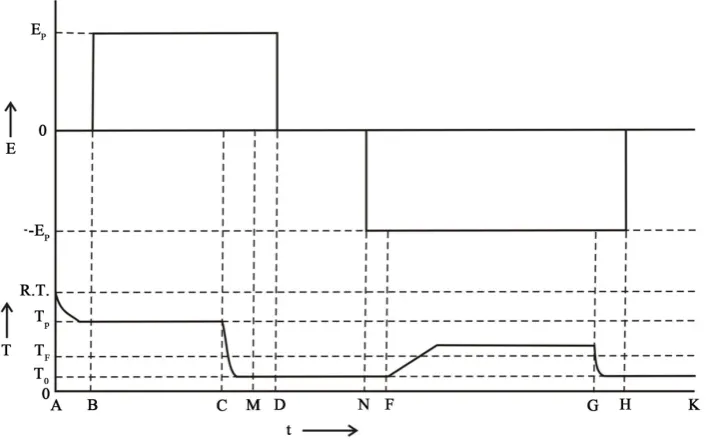
To get the number of polarized IV dipoles increased, an experimental procedure is proposed in this article. Frozen-in polarized IV dipoles are obtained following the experimental steps up to point D ofFigure 1. ITC spectrum corresponding to frozen-in polarized IV dipoles is recorded experimentally following a constant linear heating rate. Such a plot is shown inFigure 3. Now the experimental procedure is repeated on the same speci-men and in similar experispeci-mental conditions up to point D ofFigure 2. The specimen will now be maintained at
0
T in the range D to N ofFigure 2, to have the equilibrium condition established at T0. At the point N, the polarizing electric field EP will be applied in the opposite direction with reversed polarity. At the point F of Figure 2, the specimen will be slowly heated to a temperature slightly higher than TF in the presence of re-versed applied electric field and maintained at this temperature for a time large in comparison to its relaxation time at this temperature. Consequently, those IV dipoles of category (c) which were initially in the unpreferred orientation position will now become automatically in the preferred orientation position in accordance with the reversed applied electric field direction and hence will remain oriented as such. Whereas already frozen-in pola-rized IV dipoles of category (a) will flip their orientation position in accordance with the direction of the re-versed applied electric field. Thus, IV dipoles of categories (a) and (c) will become oriented along the same di-rection. IV dipoles of category (b) will remain unaffected being perpendicular to the reversed applied electric field EP. At the point G of Figure 2, the specimen will be rapidly cooled down to T0 keeping the same rate of rapid cooling as at the point C of both the Figure 1 andFigure 2. The reversed applied electric field will be switched off at the point H ofFigure 2. Thus, the polarized IV dipoles of catagories (a) and (c) are obtained in the frozen-in condition in the crystalline lattice. The resulting frozen-in polarization after following the sug-gested experimental procedure will obviously be due to IV dipoles of catagories (a) and (c). Thus, the total number of frozen-in polarized IV dipoles will be doubled i.e. 2/3rd of the total number of IV dipoles. Obviously, one will thus get more number of frozen-in polarized IV dipoles through the suggested experimental procedure. Expression for net frozen-in polarization due to IV dipoles of catagories (a) and (c) will hence be given by
( )
2 23
d P
F net
F N p E P T
kT
=
The specimen will now be kept at the temperature T0 in the range H to K ofFigure 2, to establish equili-brium of net frozen—in polarized IV dipoles. ITC spectrum recorded after executing the suggested experimental procedure up to point K will show the peak value almost 2 times more in comparison to previously recorded ITC spectrum provided the constant linear heating rate b and other experimental conditions are maintained in both the experimental runs of ITC. It will be advantageous to reiterate just for the sake of clarification that 1st ITC spectrum of Figure 4 is recorded after following the experimental steps up to point D of Figure 1 whereas 2nd ITC spectrum is recorded after following the experimental steps up to point K ofFigure 2. Further, electric field
P
E in one direction in the range B to D will be applied for less time than that in the opposite direction with re-versed polarity in the range N to H because relaxation time at a temperature slightly higher than TF is much more in comparison to the relaxation time at Tp. The peak of the ITC spectrum in both the runs will be located at the same position of temperature Tm since b is kept same [10] [11]. The values of Ea and τ0 shall remain the same in both these cases being characteristic features of the specimen under investigation. A little difference may appear in the two recorded ITC spectra particularly because of the fact that TF used in above equations depends on the rate of rapid cooling [7] [8] which may differ in the two runs of ITC. It is expected that a fairly good agreement will be obtained between experimental and theoretical values. Thus the polarization of the sys-tem can be increased following the suggested experimental technique.
3. Results and Discussion
ITC spectrum recorded corresponding to the polarization conditions up to point D ofFigure 1 following a con-stant linear heating rate will look like curve 1 of Figure 4. If we record another ITC spectrum on the same spe-cimen in similar experimental conditions following the polarization procedure up to point K of Figure 2and heating the specimen with the same constant linear heating rate, the recorded spectrum will appear like curve 2 of Figure 4. It is obvious from the figure that the peak of the ITC spectrum is doubled while rest of the parame-ters remains the same. A slight difference in the peak values of ITC spectra in the cases 1 and 2 of Figure 4
from the theoretically anticipated value may be due to slight difference in the values of rate of rapid cooling in the two cases. It is a known fact that TF depends on the rate of rapid cooling. Consequently, the values of TF while rapidly cooling down the specimen may be slightly different in the two cases of Figure 4. However, in the record of ITC spectra of Figure 4, the values of TF are observed to be the same because ITC spectra are rec-orded after slowly heating the specimen following same constant linear heating rate. Depolarization current starts appearing at TF in both the runs of ITC spectra while slowly heating the specimen following a constant linear heating rate. It is because of this reason that TF established while rapidly cooling down the specimen
may be different than that recorded during ITC spectra. Higher value of TF gives less value of P T
( )
F result-ing in less value of Imand vice-vresa. Higher value of TF due to changes in the experimental conditions may
be the probable reason for peak value in case 2 of Figure 4being <2Im. If the value of TF while rapidly
cool-ing down the specimen in both the runs of ITC spectra happens to be more in 1st run than that of 2nd run due to different rates of rapid cooling in the two cases, one would observe the peak value of ITC spectrum in 2nd run > 2Im.It is obvious from Equations (2) and (3) that the polarization P is inversely proportional to T. If TF is less,
( )
FP T will obviously be more resulting in the more value of Qo through Equation (10). Higher value of Qo
leads to more value of Im according to [1] [2]
0
0 0
1
exp mexp d
F T
a a
m T
m
Q E E
I T
kT b kT
τ τ
′
= − − −
′
∫
(13)It has to be taken care of in Equation (13) that T =Tm and integration is performed in the range TF to Tm. Thus, the peak value of ITC spectrum in the 2nd run after following different experimental steps up to point K of
Figure 2 may be different than 2Im. It would be justified to mention that it is experimentally very difficult to
maintain the same rate of rapid cooling in the two cases being a very fast changing process. However, constant linear heating rate can be maintained easily while recording the ITC runs resulting in the location of ITC peak at the same temperature Tm. In this reference it would be advantageous to go through the experimental observa-tions of thermally stimulated polarization current (TSPC) measurements by Kristianpoller and Krish [12] rec-orded on BaF2 crystals doped with Tb3+. While recording the TSPC spectra on this system they have kept (i)
0 p
E = , (ii) keeping Ep at some suitable value for the purposes of polarization and (iii) keeping Ep same as in case (ii) but applied in the opposite direction while rapidly cooling down the specimen. Subsequently, they have observed different TSPC peaks in these three referred cases. In case (iii), the TSPC peak has experimen-tally been found to be 2 times more [12] in comparison to that obtained in case (ii). Thus, theoretically expected results proposed in this article, get a justification and a positive support through these experimental findings.
Increment in the number of polarized IV dipoles is also obtained during photo-induced polarization (PIP) when the specimen is simultaneously polarized and irradiated in its suitable absorption band [13] [14]. Incre-ment to the extent of 70% has been observed during PIP [15]. It must be noticed that the increase in polarization during PIP takes place via electronic excited state [15] [16]. In the present suggested experimental procedure the polarization is increased through the orientation of IV dipoles taking place in the electronic ground state follow-ing bistable model [17]. Thus, the number of IV dipoles to the extent of 2/3rd of the total number of IV dipoles can be polarized through the suggested experimental procedure proposed in this article.
Acknowledgements
The authors are thankful to Dr. R.A Agrawal, the chairman of the institute, for providing necessary facilities. They are also thankful to Mr. A. K. Srivastava, Mrs. Vandana Gupta and Mr. A.K. Arya for their help in com-puter graphics.
References
[1] Vanderschueren, J. and Gasiot, J. (1979) Topics in Applied Physics. In: Bräunlich, P., Ed., Thermally Stimulated Re-laxation in Solids, Vol. 37, Springer-Verlag, Berlin.
[2] Chen, R. and Kirsh, Y. (1981) Analysis of Thermally Stimulated Processes. Pergamon Press, New York.
[3] Bucci, C., Fieschi, R. and Guidi, G. (1966) Ionic Thermocurrents in Dielectrics. Physical Review Letters, 148, 816. http://dx.doi.org/10.1103/PhysRev.148.816
[4] Prakash, J. (1990) Reorientational Behavior of Impurity-Vacancy Dipoles—Part I. Indian Journal of Pure and Applied Physics, 28, 365.
[5] Arrhenius, S. (1889) Zeitschrift für Physikalische Chemie, 4, 226.
[6] Prakash, J., Nishad, A.K. and Rahul (1984) Dielectric Relaxation Time of Frozen-in Impurity-Vacancy Dipoles in Po-tassium Chloride. Japanese Journal of Applied Physics, 23, 1404. http://dx.doi.org/10.1143/JJAP.23.1404
[7] Harasta, V. (1969) Fyz. Casop (Czech.), 19, 232.
[9] Christodoulides, C. (1988) Effective Temperature of Polarization in Measurements of Thermally Stimulated Depolari-zation Currents. Physica Status Solidi, a109, 611.
[10] Prakash, J., Rahul and Nishad, A.K. (1985) Heating Rate Dependence of Peak and Position of Maximum Depolariza-tion Current in ITC Measurements. Physica Status Solidi, a91, 685.
[11] Kunze, I. and Müller, P. (1969) Relaxation von Fehlstellendipolen in AgCl-Kristallen. Physica Status Solidi, 33, 91- 102. http://dx.doi.org/10.1002/pssb.19690330106
[12] Kristianpoller, N. and Krish, Y. (1979) Thermally Stimulated Polarization Currents in Barium Fluoride. Journal of Physics: Solid State Physics, C12, 1079.
[13] Prakash, J. and Fischer, F. (1976) Optically Stimulated Polarization of S--—Vacancy Dipoles in KI. Journal de Physi-que (France), 37, c7-c167.
[14] Prakash, J. (1990) Reorientational Behavior of Impurity-Vacancy Dipoles—Part II. Indian Journal of Pure and Ap-plied Physics, 28, 667.
[15] Prakash, J. and Fischer, F. (1977) Ionic Thermocurrent and Optical Absorption Studies of S--—Vacancy Dipoles in KI.
Physica Status Solidi, a39, 499.
[16] van Turnhout, J. (1980) Topics in Applied Physics. In: Sessler, G.M., Ed., Thermally Stimulated Discharge of Electrets, Vol. 33, Springer-Verlag, Berlin.