http://dx.doi.org/10.4236/jmp.2014.55038
Single Beam Z-Scan Measurement of
Nonlinear Refractive Index of Crude Oils
Adeleh Granmayeh Rad
Department of Physics, Faculty of Sciences, Roudehen Branch, Islamic Azad University, Roudehen, Iran Email: [email protected]
Received 30 November 2013; revised 29 December 2013; accepted 27 January 2014
Copyright © 2014 by author and Scientific Research Publishing Inc.
This work is licensed under the Creative Commons Attribution International License (CC BY).
http://creativecommons.org/licenses/by/4.0/
Abstract
Nonlinear properties of two different crude oils from west-south Iran reservoirs have been inves-tigated using the single beam Z-scan technique. The nonlinear refractive indices of the samples were measured by use of diode laser in the CW regime and at the wavelength 660 nm. The expe-riment results showed that the samples have large and negative refractive index nonlinear refrac-tion coefficient. These results showed that the crude oil has significant nonlinear properties and it could be a candidate for photonic and nonlinear optical devices and also this information can be used in petroleum science and oceanology and etc.
Keywords
Crude Oil; Z-Scan Method; Nonlinear Refractive Index
1. Introduction
By development of laser technology, the interest of finding materials with large nonlinear properties has been increased intensively, due to the numerous and variable applications in various fields such as telecommunica-tions, optical data storage, photonic devices such as optical limiter [1]-[8].
The single beam Z-scan method introduced by Mansour Sheik-Bahae [9] [10] is an effective and simple tech-nique for determining the nonlinear absorption and refraction coefficients, and it has been used widely for de-termining the nonlinear characteristics of different materials.
In this method, sample is scanned by moving through the focal plane of a tightly focused laser beam that its intensity is enough for accessing nonlinearities in a sample.
However, this method is simple in principle, in practice because of fluctuations of the laser beam and the loss of detector due to both nonlinear and linear process, sensitivity is compromised to overcome these limitations, using a resource arm is suggested and also additional modifications have been proposed [11].
Crude oil is the term for “unprocessed” oil which is also known as petroleum. Petroleum is a mixture of a very large number of different hydrocarbons. The most commonly found molecules are alkanes (linear or branched), cycloalkanes, aromatic hydrocarbons, or more complicated chemicals like asphaltenes. The oil sam-ples used for this experiment were collected from two different Iran oil reservoirs named Azadegan and Soroush; their API gravity measured is 20 and 22 degree, respectively which are considered as heavy oils.
In this paper, we have demonstrated the nonlinear characteristic of two different crude oils from Iran oil re-servoirs-Azadegan and Soroush oil reservoirs and we have measured the nonlinear refraction coefficients using the single beam Z-scan technique at 660 excitation wavelength.
2. Experiment
The sample of oils were collected from two different Iran oil reservoirs in west south of Iran and Persian Gulf- Azadegan and Soroush oils. The samples has been weathered for two weeks in the room temperature. At first, spectral absorbance of the samples were measured by use of an UV-VIS spectrophotometer that has been shown in Figure 1.
Furthermore, the linear absorption coefficient of the samples was measured by the conventional method, Bir- Lmabert that defines on the basis of α = −
( ) (
1l ln I0 I)
in the linear regime of the experiment.The experimental set up for determining the nonlinear properties is shown in Figure 2. The experiment was carried out at room temperature and a CW diode laser operating at 660 nm was used as a light source, the laser beam after crossing over two lenses focused onto the sample by a lens of 28.5 cm focal length. The sample con-sisted of a pair of quartz glasses and crude oil and it was moved along the z-axis. The light transmittance was measured by a detector as a function of the sample position. At the focus point the power output of the laser beam was measured to be 90.7 mW. The laser spot size at the focus was measured to be ω0=21.1µ.
3. Results and Discussion
The linear UV-VIS absorbance spectrum of Azadegan and Soroush crude oil is presented in Figure 1. As it can be seen in this figure, both samples present an absorbance peak at 552 nm but absorbance peak for Azadegan sample can be considerable.
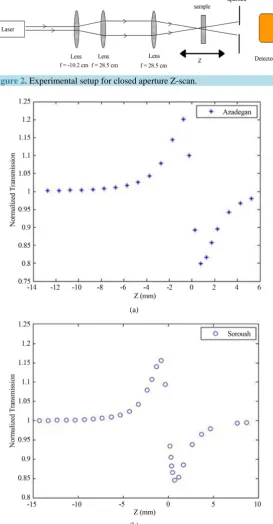
The result of typical z scan normalized transmittance measurement for the samples are shown in “Figure 3”. The nonlinear refractive index can be calculated by fitting the normalized transmittance data to the closed aperture formula that given by Sheik Bahaei et al.
(
)
(
2)(
02)
4 , 1 1 9 x T z x x φ φ ∆ ∆ = −+ + (1)
where ∆φ0 is the on-axis phase shift at the focus, which defines by the following equation:
(
)
0.25 0 0.406 1p v
T − s φ
∆ ≈ − ∆ (2)
The ∆Tp v− can be defined as the difference between the normalized peak and valley transmittances and S is
linear transmittance of the aperture that is given by:
(
2 2)
1 exp 2a aS= − − r w (3)
where ra is the radius of the aperture and wa is the beam radius at the aperture. Nonlinear refractive index, n2
can be calculated using simple expression:
0 2 0 eff n kI L φ ∆
= (4)
Here k I L, 0, eff are wave number, peak intensity within the sample at the focus and the effective thickness:
(
0)
01 exp
eff
(a)
[image:3.595.157.444.79.579.2](b)
Figure 1. UV-VIS absorbance spectra. (a) Azadegan crude oil (b) Soroush crude oil.
L = sample thickness
0
α = linear absorption coefficient at wavelength
λ
.The nonlinear absorption coefficient β can be obtained from this open aperture Z-scan data by fitting the nor-malized transmittance data to the open aperture formula given as:
(
)
( )
(
)
0 3 2 0
, 0 , 1
1
m
m
q z T z s
m
∞ =
−
= =
+
∑
(6)Figure 2. Experimental setup for closed aperture Z-scan.
(a)
(b)
Figure 3.Normalized transmittance curve of (a) Azadegan crude oil; (b) Soroush crude oil.
2
0 0 2
z =kw is the diffraction length of the beam k = is the wave factor
0
w = The beam waist radius at the focal point
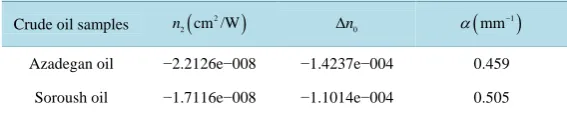
The value of linear absorption coefficient and nonlinear refraction coefficients and ∆n0 obtained for the
Table 1.The linear & nonlinear optical properties of crude oils.
Crude oil samples
(
2)
2 cm /W
n ∆n0
(
)
1 mm
α −
Azadegan oil −2.2126e−008 −1.4237e−004 0.459 Soroush oil −1.7116e−008 −1.1014e−004 0.505
The results have been obtained at intensity within the sample of about 90 mW. We find that Azadegan and Soroush crude oil samples exhibit strong self-defocusing behaviour as revealed in peak-valley shaped curves, and also peak-valley shaped curve depicts the negative sign of n2 for crude oil samples.
4. Conclusion
We have carried out an investigation of the optical nonlinearity of two different crude oils from west-south Iran reservoirs Azadegan and Soroush. The nonlinear refractive index, n2 of crude oils was measured using the
single-beam z-scan technique for excitation wavelength, 660 nm, in the CW regime. The sign of the nonlinear refractive was found to be negative so the experiment confirmed that the nonlinear phenomenon was caused by self-defocusing process.
References
[1] Ganeev, R.A., Ryasnyanskii, A.I., Kodirov, M.K., Kamalov, S.R., Li, V.A., Tugushev, R.I. and Usmanov, T. (2002)
Technical Physics, 47, 889-893. http://dx.doi.org/10.1134/1.1495054
[2] Granmayeh Rad, A., Abbasi, H. and Golyari, K. (2012) International Journal of Applied Physics and Mathemics, 2, 135-139.
[3] Granmayeh Rad, A., Nabavi, S.H., Koohian, A. and Madanipour, Kh. (2011) Journal of Theoretical and Applied Physics, 5, 35-39
[4] Jia, T., He, T., Li, P., Mo, Y. and Cui, Y. (2008) Optics & Laser Technology, 40, 936-940.
http://dx.doi.org/10.1016/j.optlastec.2008.01.007
[5] Mukherjee, A. (1993) Applied Physics Letters, 62, 3423-3425. http://dx.doi.org/10.1063/1.109036
[6] Marder, S.R., Torrullas, W.E., Blanchard-Desce, M., Ricci, V., Stegman, G.I., Gilmour, S., Bredas, J.L., Li, J., Bublitz, G.U. and Boxer, S.G. (1997) Science, 276, 1233-1236. http://dx.doi.org/10.1126/science.276.5316.1233
[7] Li, C., Zhang, L., Yang, M., Wang, H. and Wang Y. (1994) Physical Review A, 49, 1149-1157.
http://dx.doi.org/10.1103/PhysRevA.49.1149
[8] Guo, S.L., Xu, L., Wang, H.T., You, X.Z. and Ming, N.B. (2003) Optical and Quantum Electronics, 35, 693-703.
http://dx.doi.org/10.1023/A:1023981924486
[9] Sheik-Bahaei, M., Said, A.A. and Van Stryland, E.W. (1989) Optics InfoBase: Optics Letters, 14, 955-957.
http://dx.doi.org/10.1364/OL.14.000955
[10] Sheik-Bahaei, M. and Van Stryland, E.W. (1998) Z-Scan Measurements of Optical Nonlinearities, Characterization Techniques and Tabulations for Organic Nonlinear Materials. In: Kuzyk, M.G. and Dirk, C.W., Eds., Marcel Dekker,
Inc., 655-692.
[11] Ménard, J.M., Betz, M., Sigal, I. and van Driel, H.M. (2007) Applied Optics, 46, 2119-2122.