Network performance implications of
multi-dimensional variability in data traffic
Chris Roadknight, Ian Marshall and George Bilchev.
BT Adastral Park, Martlesham Heath, SUFFOLK, IP5 3RE, UK
{christopher.roadknight, ian.w.marshall, george.bilchev}@bt.com
Abstract.
WWW traffic will dominate network traffic for the foreseeable future. Accurate predictions of network performance can only be achieved if network models reflect WWW traffic statistics. Through analysis of usage logs at a range of caches we confirm that WWW traffic is not a Poisson arrival process, and that it shows significant levels of self-similarity. We show for the first time that the self-similar variability extends to demand for individual pages, and is far more pervasive than previously thought. These measurements are used as the basis for a cache modelling toolkit. Using this software we illustrate the impact of the variability on predictive planning. The model predicts that optimisations based on predictive algorithms (such as least recently used discard) are likely to reduce performance very quickly. This means that far from improving the efficiency of the network, conventional approaches to network planning and engineering will tend to reduce efficiency and increase costs.
Keywords Web traffic, self-similarity
1
INTRODUCTION
’Internet’ traffic and is likely to remain the dominant traffic source for some time. Network performance is thus likely to be dominated by web traffic statistics and web performance for much of the coming decade. Current traffic models are based on Poisson arrival processes, which are a good fit to observed telephony traffic, but data traffic does not fit a Poisson arrival process. Over the last decade evidence has been accumulating that data traffic (and web traffic in particular) exhibits a range of long range dependencies [1,2,3], which manifest in the traffic as burstiness that does not average out when the traffic is multiplexed. This burstiness can persist to extremely long timescales. To accurately predict quality of service and performance levels in a network dominated by data traffic a seismic shift in modelling approaches will therefore be required. Pending development of accurate traffic models a more heuristic approach has been applied.
A large proportion of web objects are static [4], so caching popular files nearer to the users reduces demand on remote network devices, and minimises the probability of overload at bottlenecks due to bursts in demand for a particular object. WWW caches have therefore been deployed globally in an effort to decrease the load on network and server hardware [5]. Subsequently many efforts have focused on the effectiveness of cache replacement algorithms [6], in an effort to minimise the cost of the caches and maximise their scalability. However the studies are based on assumptions of independence at large timescales. To validate or refute the assumptions there is a need to understand the long-term temporal characteristics of the traffic load in greater detail.
For example, self-similarity is the property of a series of data points to retain a pattern or appearance regardless of the level of granularity used and is the result of long range dependence (LRD) in the data series. A system is said to be long range dependent if the auto-covariance function decays hyperbolically, a memory-less process decays exponentially. Fractal patterns are the clearest exhibition of this property, where regardless of how much one zooms into (or out of) a pattern, the basic appearance remains fundamentally unchanged. A truly fractal demand pattern for a Web object would imply the possibility of bursts in demand, similar to the largest observed burst, occurring at arbitrarily large time intervals. It also implies that however long the measurement interval there is no guarantee that representative burst statistics for an object have been observed. The implications for predictive planning algorithms (such as cache replacement) are potentially very serious. Of course real world data cannot be expected to precisely match the mathematical definitions, but if self-similarity is observed between time intervals over several orders of magnitude this would be sufficient to significantly impact network performance.
2
DETERMINISTIC BEHAVIOUR IN WEB TRAFFIC
To obtain meaningful analysis results it was important to use recent data sets of high quality and covering a significant time and request period for a substantial number of users. We were lucky to be able to use details of individual requests from several user groups, the most frequently used being the request logs from NLANR (ircache.nlanr.net/Cache/Statistics/) and EduWeb, an Internet service for use by teachers and pupils in the U.K (www.eduweb.co.uk/).
2.1 Self-Similarity.
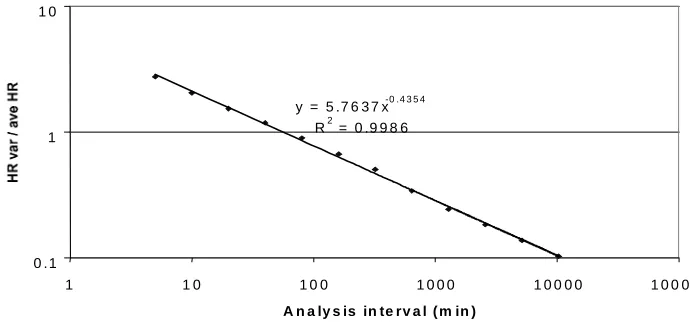
Hit rate, the % of file requests served from the cache, was chosen as a metric of the community’s behaviour. This single metric is useful as it gives some idea of possible similarities in behaviour and also a very important metric for evaluating the performance of a cache. Plotting the hit rate variance, Var(x(m)), against the aggregation level of the signal, m, on a log-log plot will result in points falling on a straight line fit if the process x, under consideration, exhibits the property of self-similarity, that straight line should decay at a rate slower than m-1, with the decay rate,
m-β (that is, the slope of the straight line, -β) giving an estimate of the Hurst parameter, H = 1 – β/2. For completely self-similar processes H equals 1, but a value of between 0.5 and 1 points to an increasing amount of underlying self-similarity.
y = 5 .7 6 3 7 x-0 .4 3 5 4 R2 = 0 .9 9 8 6
0 .1 1 1 0
1 1 0 1 0 0 1 0 0 0 1 0 0 0 0 1 0 0 0 0 0
[image:3.612.151.496.419.581.2]A n a ly s is in te rv a l ( m in )
Figure 1. Aggregate Variance Plot Showing Self-Similarity Over 4 Orders of
Magnitude.
(by subtracting a suitable moving average) and also analysed using a wavelet estimator [9]. The benefit of wavelet estimators is that they require fewer assumptions about the data and are relatively unaffected by periodic behaviour or systematic noise in the data. The method was applied to long term data sets from the NLANR-LJ cache and the EduWeb cache. Fig 1 shows clearly that significant self-similarity can be observed over at least 4 orders of magnitude at the NLANR-LJ cache. The exponent of -0.435 equates to a Hurst parameter of ~0.78, which is high enough to suggest a large amount of self-similarity is influencing the data [8]. This was confirmed by wavelet estimation giving H = 0.805 ± 0.012. These results were further validated by using daily hit rate statistics for an 18 month period at the NLANR caches (available at http://ircache.nlanr.net/Cache/ Statistics /Reports/) to generate aggregate variance plots. This analysis is less accurate, so the predicted Hurst parameter of up to 0.923 is less reliable. However, the longer sampling period indicated self-similarity extends to periods of at least 54 days. Similar results were observed at the EduWeb cache, where we observed H = 0.861 ± 0.046, using log file data covering 6 weeks. It is likely that the self-similarity at EduWeb extends to longer timescales, but insufficient data was available to confirm this.
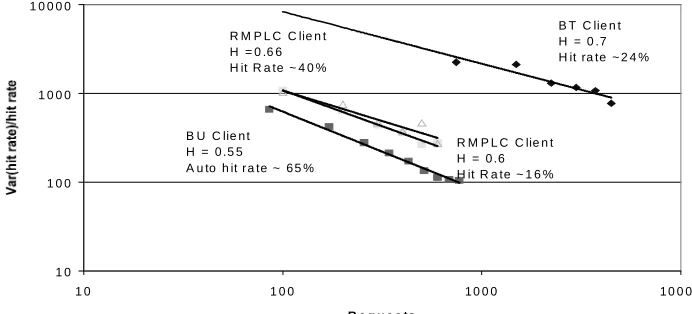
Given that self-similarity is observed in web traffic, what factors could be the causes for this? Long-range dependence can only arise from a process, or set of processes, which have memory, so that a stimulus that occurs at one moment may trigger another related event at another later time. Several causes have been proposed for this including heavy tailed distributions for session lengths [3], file lengths [4], and packetization. However, a further cause is required to explain the long timescale dependency we have observed. With the notable exceptions of web spiders and robot assisted browsing, all web requests emanate from a human user. We have shown [5] that individual user traces can exhibit long-range dependent behaviour. Figure 2 shows some examples. It is thus extremely likely that one of the contributing factors is the memory of the users, which clearly persists over the required timescale of several months and may be aided by memory aids such as bookmarks.
1 0 1 0 0 1 0 0 0 1 0 0 0 0
1 0 1 0 0 1 0 0 0 1 0 0 0 0
R e q u e s ts
B T C lie n t H = 0 .7 H it ra te ~ 2 4 %
B U C lie n t H = 0 .5 5
A u to h it r a te ~ 6 5 %
R M P L C C lie n t H = 0 .6 H it R a te ~ 1 6 % R M P L C C lie n t
[image:4.612.152.498.483.640.2]H = 0 .6 6 H it R a te ~ 4 0 %
2.2 Temporal Request Dynamics.
[image:5.612.148.478.279.473.2]The observed self-similarity in hit rate also immediately suggests that page popularity is highly dynamic, contrary to simplifying assumptions made in some models (e.g. [6]). To verify this we have examined the temporal variation in demand for individual pages. Figure 3 shows the popularity of some typical websites (their ranking on that day) over 3 weeks at an Australian university cache (eg. http://squid.latrobe.edu.au/usage/days/hosts/proxy.895.total-remote-hosts.html). The figure clearly illustrates the range of variation in demand one can expect for popular pages over the course of a three week period.
0 50 100 150 200 250 300 350 400
1 2 3 4 5 6 7 8 9 10 11 12 13 14 15 16 17 18 19 20 21
Time (days)
www-aus.cricket.org www.comsec.com.au ad.au.doubleclick.net home.microsoft.com
Figure 3. Examples of Temporal Dynamics at 4 Sites.
It should be apparent that the popularity of each site over time varies in different ways. See how:
1. A cricket site’s popularity seems very erratic, possibly varying with occurrence of important matches.
2. Microsoft’s site seems consistently popular demonstrating its time independent nature.
3. Doubleclick is an ’adbanner’ site where automatic requests are made to from a large selection of web sites so is stable over time.
These are some simple examples. It is expected that most page dynamics will be much more complex than this, often with overlays of several influencing factors and with less clear definitions of cause-effect relationships.
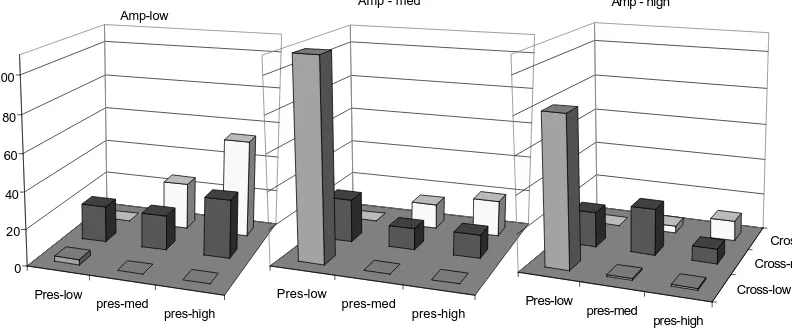
We automatically classified each file into one of 27 types judged on their degree (high, medium, low) of each of the three metrics, over a 25 day period. The definition of high medium and low is presently subjective, but could be classified more rigorously given data sets from a wider range of caches. We do not feel the precise categorisation boundaries significantly affected the results.
We performed this analysis, covering the entire cache, based on 3 key time dependent metrics over the specified time period:
1. Presence. What fraction of days/hours was a file requested at least once during the period of analysis, typically 25 days. (Pres-low, Pres-med, Pres-high)
2. Frequency or crossover rate. How many times did the daily request rate cross the average request rate (+ and - a 10% buffer zone) for the period. (low, Cross-med, Cross-high)
[image:6.612.127.523.396.560.2]3. Amplitude. This is the variance in daily request rate divided by the average daily request rate for the file in question. (Amp-low, Amp-med, Amp-high)
Figure 4. File Grouping Based on 3 Key Temporal Characteristics.
Sampling a range of caches we have derived a mean value for the proportion of pages in each category, illustrated in figure 4. It is immediately apparent that the majority of the popular pages (high presence) are not continuously popular as has been assumed in the past, and a significant proportion of the popular pages are not requested on every day (medium and low presence).
Pres-low pres-med
pres-high 0
20 40 60 80 100
Amp-low
Pres-low
pres-med
pres-high Amp - med
Pres-low pres-med
pres-high
Cross-low Cross-med
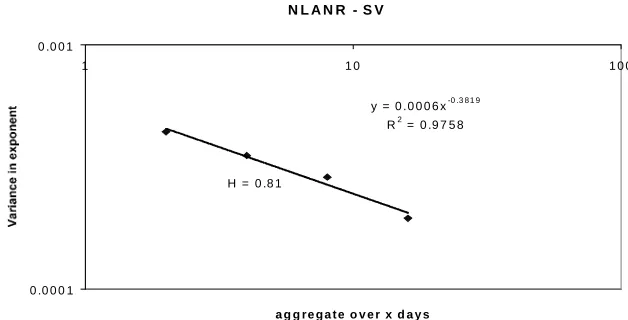
In addition to analysing the popularity of individual pages we analysed the variability of the popularity curve. The popularity curve is normally assumed to be a Zipf curve where normalised probability of a request equals (popularity)α. The exponent is a number close to -1, which is assumed to be constant. In practice we observed that α varies in a self-similar way with a Hurst parameter of approximately 0.8 at the caches we analysed. Figure 5 shows the aggregate variance plot for this series of exponents and the calculated Hurst parameter for this plot (0.81), showing strong signs of self-similarity. This variability must also be factored into more accurate model of cache performance.
N L A N R - S V
y = 0 .0 0 0 6 x-0 .3 8 1 9 R2 = 0 .9 7 5 8
0 .0 0 0 1 0 .0 0 1
1 1 0 1 0 0
a g g re g a t e o v e r x d a y s
[image:7.612.150.464.274.434.2]H = 0 .8 1
Figure 5. Self-similarity in the exponent of the popularity ranking curve
3. SYSTEMATIC CAUSES FOR DIFFERENCES IN
POPULARITY EXPONENT
Caches are arranged in hierarchies, some caches receive requests direct from the users (eg, browser caches, some local caches), some receive requests from first level caches and browser caches and so on to very high level caches that only take requests from other high level caches. An examination of the exponents at these caches and the physical position in the hierarchy suggests a direct relationship between position and exponent [9]: the popularity curve gets steeper (bigger negative exponent) as the position of the cache gets ’nearer’ the clients (table 1). It has been shown that the request popularity curve for a single user over time, at the source of these requests, is close to -1 [3], so it must be assumed that as intercepting caches are placed on the network the popularity curve slope observed at these caches get increasingly shallow.
Cache Position Exponent R squared Error estimate
NLANR - lj Highest -0.644 0.9897 ±0.024
PISA Local -0.913 0.9807 ±0.038
FUNET National -0.699 0.9883 ±0.046
SPAIN National -0.724 0.9817 ±0.045
[image:8.612.164.431.280.352.2]RMPLC Local -0.858 0.9795 ±0.109
Table 1. Cache factors of Interest
Another approach was investigated that used data from a cache hierarchy visualization tool called plankton (http://www.ircache.net/Cache/Plankton/). This tool gives information about the origin of all requests reaching the NLANR servers. From the number of requests presented on all the links and the topology of the node to node links, it is possible to estimate the depth the NLANR cache over a time period. Depth is taken to mean the average number of caches (not including any browser cache) a request has passed through before it reaches the NLANR cache.
Figure 6 shows a clear relationship between depth and exponent. Only one graph is shown, but all best fit analysis from all NLANR caches showed a relationship of the same direction, suggesting that the more intervening caches that a set of requests go through the smaller the curve exponent is. The simplest explanation for this is that each intervening cache is systematically filtering out request so as to make more popular files appear to be less popular, thus decreasing the slope of the popularity curve.
NLANR - PB
y = 1.6916x-0.9895
2 2.2 2.4 2.6 2.8 3 3.2 3.4
0.58 0.59 0.6 0.61 0.62 0.63 0.64 0.65
[image:9.612.151.484.149.328.2]Popularity Curve Exponent
Figure 6. Relationship Between Popularity Curve Slope and Cache Depth
It was also found that curves needed to be fitted to a large number of requests (>500 000) this is due to the self-similar nature of requests making conventional sampling regimes insufficient.
4.
CACHE MODEL
The starting assumption of our model is that users access the WWW via a proxy cache, i.e., all the url requests pass through the proxy cache and the proxy either provides the data as a local copy or downloads it from the origin server. We then develop a model for a user community as seen from the proxy. Analysed log data suggests that there are two types of user activity patterns – a daily activity pattern and a stochastic component.
The daily activity pattern is modelled as a trend using a ‘superposition’ of periodic functions:
{
()}
max ) ( 0 ), 2 sin( max ) ( trend trend trend t y t y d T t c b a t y i i i i i i i = + + = πhas been approximated the stochastic component can be modelled as a Brownian motion:
η + −
= ( 1)
) ( BM BM t y t y
Since the number of requested files is always non-negative we have to truncate a negative value of yBM(t) to zero. Also bursts in positive direction are higher than bursts in negative direction and to accommodate for this we define η as:
> = otherwise ’ 0 ’ if ’ λ η η η η
where η ∈’ Norm(0,σ) and λ is a parameter determining the ratio between the heights of the positive and negative bursts. The second modification also has the effect of reducing the number of times the series has to be truncated due to negative values.
Since the stochastic component must be superimposed on the trend, a way of “guiding” the random walk of the Brownian motion towards the trend without destroying the above described properties is needed. We suggest using a sequence of non-overlapping random walks each starting from around the trend:
) , 0 ( ) ( )
(k t ytrend k t Norm σtrend
y ∆ = ∆ +
i.e., at each time step k∆t,k=0,1,2,..., a Brownian motion process begins for ∆t
steps: η + − + ∆ = +
∆ ) ( 1)
( BM BM m t k y m t k y
where, m=1,2,...,∆t−1. Then it stops and a new process begins. This completes our model of the intensity of the http requests. For the popularity distribution of the url requests we have selected to use a Zipf’s-like distribution, which conforms to our real data analysis.
After developing the user community model we proceed with the cache proxy model. The cache proxy is modelled by Web content expiry statistics and it also implements a simplified caching algorithm. The expiry statistics models both the rate of change of Web pages (reflecting server assigned time-to-live or TTL) and cache purging due to stale data (i.e., cache assigned TTL). To account for caches of limited size, the model also implements a replacement algorithm, e.g. the least recently used (LRU) replacement algorithm.
TTL. If the file has expired the proxy verifies whether the file has changed. If so, a miss is reported and the time stamp of the file is reset (this reflects downloading of the new version of the file from the origin server). If the file has not changed, a hit is reported and again the time stamp is reset.
Once the single proxy has been modelled, we can build meshes of interconnected proxy caches. To achieve this we have developed a simulation toolbox that allows caches to be linked together to form various caching infrastructures.
In order to analyse the performance of a cache and to reliably compare it with other caches, the following performance measures have been defined:
• Request Hit Rate is a measure of the efficiency of the cache. It does not
correspond one-to-one with the saved bandwidth since the requests are for files with various sizes. The importance of this measure, however, stems from the fact that opening an HTTP connection is a relatively expensive process comparable to the actual time needed for smaller files to be transferred.
[%] Requests of
No. Total
Hits of No. Rate
Hit
Request =
• Byte Hit Rate is also a measure of the efficiency of the cache. It reflects the actual
amount of saved bandwidth.
[%] Data
Requested Total
the of Volume
Cache in the Found Data Requested of
Volume Rate
Hit
Byte =
• Saved Bandwidth is a measure of particular interest to network designers,
showing the actual effect of the cache on the network. It is defined as the volume of the requested data minus the volume of data not in the cache.
5.
PERFORMANCE IMPLICATIONS
are much greater than the average reduction in load one might deduce from the hit rate. Distributing web content widely into caches offers significant performance improvements to web users during demand bursts since the target server is rarely overloaded. Caching also protects other network users from performance degradation due to packet losses on a link that is unpredictably saturated by a burst in demand for a particular web page. On the other hand, since apparently unpopular pages can suddenly experience a demand burst, the storage capacity of caches needs to be very large. Also, as the bursts can be widely separated in time, the current practice of minimising disk usage by operating a cache replacement algorithm (such as least frequently used) on an hourly basis leads to a rapid increase in the latency experienced by end users
We have created an analytic model, section 4, of cache behaviour [12], that reproduces the statistical properties we have observed in real traffic logs. This model successfully predicted the weak dependence of the popularity exponent on hierarchical position that we report in section 3. The model allows us to create a wide variety of network scenarios, with different cache distributions and hierarchies and different demand distributions. We can then evaluate the performance of each scenario and predict an optimum hierarchy for a given traffic load.
The possible explanations for the observed changes in the popularity curve include:
♦ Merging requests from communities with diverse interests ♦ The filtering effect of lower level caches
♦ Both of the above
To test the first possible explanation we have merged 500,000 file requests from NLANR and EduWeb and calculated the slope of the new popularity curve. If the hypothesis were likely to be true then the merged slope should be less steep than the slopes of the two comprising individual logs. The slope of NLANR was –0.703 and for EduWeb: -0.858, which averages to –0.78. The slope of the merged file request popularity was –0.794, which is steeper than both NLANR’s slope and the average, thereby implying that increasing a cache's geographical, demographic and cultural diversity fails to significantly reduce the slope of the file popularity curve. We have further verified these results with other experiments from Funet [http://www.funet.fi/] and a simulated model [12]. This indicates that there is neither direct nor indirect evidence for the first hypothesis to be true.
The second hypothesis is more difficult to test with existing log data. Therefore, we have set up a simulation experiment in which five first level caches are connected to a common second level cache.
of the first level caches. At cache sizes of 10%, 1%, 0.1% and 0.01% of the domain size, we see exponents of -0.463, -0.602, -0.686 and -0.693.
These results show that the less filtering effect the first level caches possess, the bigger the slope of the observed popularity curve at the second level cache. This gives evidence that the second possible explanation holds true and the observed changes in the popularity slope are largely due to the filtering effect of lower level caches.
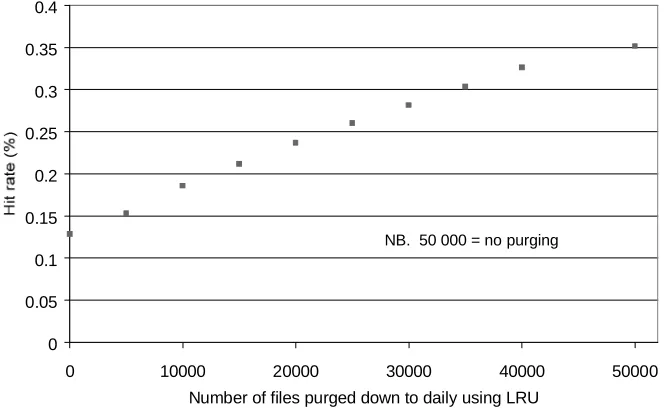
To illustrate the impact of self-similarity on predictive algorithms we used the model to predict the performance of a single cache using a simple Least Recently Used (LRU) cache replacement algorithm. The results shown in figure 7 show how even small amounts of purging can have a significant effect of cache performance. Assuming a hit rate of 30%, a mean retrieval time from the target server of 4 seconds and a mean time to fetch from the cache of 500ms (suggested by end-user logs in our laboratory) a reduction of 1% in hit rate results in an increase of 1.2% in mean waiting time for the user. We consider that saving a few dollars on disk capacity probably does not justify the reduction in quality of service.
0 0.05 0.1 0.15 0.2 0.25 0.3 0.35 0.4
0 10000 20000 30000 40000 50000
Number of files purged down to daily using LRU
[image:13.612.148.480.353.558.2]NB. 50 000 = no purging
Figure 7. Predicted performance impact of predictive cache replacement
algorithm.
is likely to deliver accurate results, and in this case the reduction in disk usage will be small. Other predictive algorithms, such as those used in network dimensioning will face similar difficulties.
5
CONCLUSIONS
We have found that many aspects of WWW traffic (the dominant component of data traffic in todays networks) exhibit significant self similarity at large timescales. An important causal factor being repetitive behaviour by users. Many existing models make simplifying assumptions that do not fit our observations. We have therefore introduced a new simulation model that attempts to account for all of the variability we have observed. The model has made accurate predictions of observed behaviour. The model has also been used to predict the impact of the observed self-similarity on predictive optimisations. As might be expected from qualitative arguments about the properties of fractal traffic, the model has demonstrated that algorithms that predict behaviour in the current time interval by extrapolating from previous time intervals are not useful in the presence of traffic that is self similar at the timescale of the measurement interval. Failure to recognise this can lead to a serious overestimation of the benefits of predictive optimisations and planning algorithms. Given the very long timescale self-similarity we have observed, the measurement intervals required to make accurate predictions will often need to be longer than the desired response time of the network. We therefore suggest that rapid network responses should not be based on predictive approaches. A better approach might be to enable extensive load balancing to respond to the local overloads that cannot be predicted.
6 REFERENCES
[1] W Willinger, M Taqqu, R Sherman and D Wilson. Self-Similarity through high variability: Statistical analysis of ethernet LAN traffic at source level. Proceedings of SIGCOMM ’95 (1995) p. 100-113
[2] K Park, G Kim and M Crovella. On the effect of traffic self-similarity on network performance. Performance and Control of Network Systems, The International Society for Network Engineering. (1997) 3231: 296-310.
[3] I Marshall, C Roadknight, ’Linking cache performance to user behaviour’, ’Computer Networks and ISDN systems’ 30 (1998), pp.2123-2130.
[4] R Caceres, F Douglis, A Feldmann, G Glass and M Rabinovich. Web Proxy Caching: The Devil is in the Detail. 1st Workshop on Internet Server Performance in conjunction with ACM SIGMETRICS. 1998. P111-118
[6] L Breslau, P Cao, L Fan, G Phillips and S Shenker. ’Web Caching and Zipf-like Distributions: Evidence and Implications.’ IEEE Infocom ’99. http://www.cs.wisc.edu/~cao/papers/zipf-implications.html.
[7] M Taqqu, V Teverovsky and W Willinger. ’Estimators for long-range dependance: an empirical study.’ Fractals. Vol 3, No. 4 (1995) 785-788.
[8] J Beran. ’Statistical methods for data with long-range dependence’. Statistical Sciences 1992, Vol. 7, No. 4, 404-427.
[9] C Roadknight, I Marshall and D Vearer. ’File popularity characterisation’. Second Workshop on Internet Server Performance in conjunction with ACM SIGMETRICS 99.
http://www.cc.gatech.edu/fac/Ellen.Zegura/wisp99/accepted.html
[10] L Breslau, P Cao, L Fan, G Phillips and S Shenker. ’Web Caching and Zipf-like Distributions: Evidence and Implications.’ IEEE Infocom ’99. http://www.cs.wisc.edu/~cao/papers/zipf-implications.html.
[11] P. Barford and M. E. Crovella, ’Generating Representative Web Workloads for Network and Server Performance Evaluation,’ in Proceedings of Performance ’98/ACM SIGMETRICS ’98, pp. 151-160, Madison WI.