http://dx.doi.org/10.4236/jamp.2016.41010
Mathematical Study of the Dynamics of the
Development of HIV
Gabriel Iyam Ogban, Konstantin Andreyevich Lebedev
Department of Computational Mathematics and Informatics, Kuban State University, Krasnodar, Russia
Received 18 November 2015; accepted 12 January 2016; published 15 January 2016 Copyright © 2016 by authors and Scientific Research Publishing Inc.
This work is licensed under the Creative Commons Attribution International License (CC BY).
http://creativecommons.org/licenses/by/4.0/
Abstract
Over the history of humankind, they is no disease that has received so much attention as the HIV infection and mathematical models have been applied successfully to the investigation of HIV dy-namics. It is, however, of note that, few of these investigations are able to explain the observation that host cell counts reduce while viral load increases as the infection progress. Also, various clin-ical studies of HIV infection have suggested that high T-cell activation levels are positively corre-lated with rapid disease development in untreated patients. This activation might be a major rea-son for the depletion of cells observed in most cases of long-term untreated HIV infection. In this paper, we use a simple mathematical model without treatment to investigate the stability of the system and compare the results with that obtained numerically by the use of MATHCAD. Our mod-el which is a system of differential equations describing the interaction of the HIV and the immune system is divided into three compartments: uninfected CD4T cells, infected CD4Tcells and the vi-rus population. This third compartment includes an extra source of the vivi-rus since it is believed that the virus in the blood constitute less than 2% of the total population. We obtain a lineariza-tion of the original system, and using Routh-Hurwitz condilineariza-tion for the non-linear system, the crit-ical points are unstable.
Keywords
Model, HIV, CD4+T Cell, Infected Cell, Uninfected Cell, Stability, Linearization, Equilibrium
1. Introduction
im-mune regulation and their depletion can have widespread deleterious effects on the functioning of the imim-mune system as a whole, this is cause for alarm and a key reason for HIV devastating effect [1]. Indeed, the decline in the number of CD4+T cells in peripheral blood is used in a clinical setting as an indicator of the disease stage [2]. The puzzle today is that while much progress has been achieved by medical and biological researchers in understanding aspect of the virus-host interaction, the mechanism by which HIV causes AIDS still remains unexplained.
The dynamics of immune response to any virus involves different components and is generated by a complex web of interactions among different types of white blood cells (monocytes, T and B cells). Although they can be variations from one patient to another, the time scale to develop a specific immune response may vary from days to weeks. In the case of HIV, the entire course of infection involves two different time scales [3]. The primary infection which shares many similarities with acute infections, exhibits the same characteristics as any other vir-al infection: a dramatic increase of the virus population during the first 3 - 6 weeks, followed by a sharp decline, due to the action of the immune system. Instead of being completely eliminated after the primary infection, as many other viruses, however, a low HIV concentration is detected for a long asymptomatic time: the clinical la-tency period. During this period, the immune response keeps the viral load to a constant level referred to as the set point viral load [4]. This period may vary from one to ten (or more) years [5]. Besides the low virus burden detected during this period, a gradual deterioration of the immune system is manifested by the reduction of CD4+T cell populations in the peripheral blood. The third phase of the disease is achieved when the concentra-tion of the T cells is lower than a critical value (~30%), leading to the development of AIDS.
Differential equations represent good approximations to situations where there are large number of events happening on average and when the time scale over which the average is being examined is much longer than the interval between events. At the initial time when the research into HIV/AIDS started, it was not understood that in HIV-infected individuals the virus was being produced at a prolific rate even before the onset of symp-toms and full-blown AIDS. Mathematical models have been proven valuable in understanding the dynamics of HIV infection. Perelson and Nelson [5] developed a simple model for the primary infection with HIV. This model has been important in the field of mathematical modeling of HIV infection, and many other models have been proposed, which take this model as their inspiration. Perelson et al. [6] extended the model in 1993 and discussed some of the model's behavior. They defined the model by considering four categories: uninfected CD4+T cells, latently infected CD4+T cells, productively infected CD4+T cells and virus population. Wodarz and Nowak [7] used their model to measure crucial parameters which led to a new understanding of the disease process. Furthermore, in their work they showed how mathematical models can be used to understand correlates of long-term immunological control of HIV, and to design therapy regimes that convert a progressing patient into a state of long-term non-progression. Shi, V. et al. [8] formulated a novel cellular automated (CA) model for HIV dynamics and drug treatment. The model is built upon realistic biological processes, including the virus replication cycle and mechanism of drug therapy. Viral load, its effect on infection rate, and the role of latently infected cells in sustaining HIV infection are among the aspects that are explored and incorporated in the model. The results of the simulation show the three phases of HIV dynamics. In the rest of what follows, we introduce our mathematical model of HIV without treatment in Section 2. In Section 3, we introduce a linearization tech-nique. Section 4 deals with the numerical simulation and analysis. The last section is the conclusion.
Statement of Problem
Nonlinearity can be classified as inherent (natural) and intentional (artificial). The case of interaction of HIV with the immune system is one that has undesirable effects; control and eradication have been of increasing concern to clinicians and mathematical modellers. The behaviour of this nonlinear system, however, is much more complex as HIV evolves and behaves differently from other viruses. Can there then be any equilibrium point?
2. HIV Model without Treatment
ana-lytic solution with the numerical solution obtained in [10]. We introduce a system of ordinary differential equa-tions modeling the immune dynamics of an HIV infected immune system in the absence of treatment. The va-riables are defined as follows:
T —Concentration of uninfected CD4+T cells;
s
T —The concentration of CD4+T cells infected with HIV;
s
V —Concentration of HIV virus.
We note that the model without treatment describes the processes in the blood, the replication of the virus and mortality of cells occurring in the lymphatic system, and as a result, the model describes the dynamics observed in the blood variables rather than operating characteristics of infection.
The derivatives with respect to time of these variables satisfy the system of differential equations:
( )
( )
( )
( ) ( ) ( )
( ) ( )
( )
( ) ( )
( )
( ) ( ) ( )
( )
( ) ( )
( ) ( )
( )
1 1 2 3 d d d d d dS s S
s
s s s s s
S
s s v s s
T t
S t mT t l t T t V t k V t T t
t T t
k V t T t m T t l t T t V t
t
V t
l T t V t k T t V t G t
t = − + − = − − = − + (1)
The system of equation has the initial conditions:
( )
3( )
3( )
30 600 units mm ; S 0 1 unit mm ; S 0 10 units mm
T = T = V =
The expressions on the right sides of Equations (1)-(3) indicate the following: In Equation (1),
( )
2( )
( )
1S
S S
S V t
S t S
B V t
= −
+ is a function, which represents the source of, uninfected CD4
+
T-cells from the thymus
and other compartments. Here S1 and S2 are constants, Bs is a saturation constant (saturation ratios
in-troduced into the model to adjust the parameters of growth under great changes in populations during the course
of infection and treatment). m-is the mortality rate of uninfected CD4+T-cells (birth rate = 1
m); l t T t V1
( ) ( ) ( )
S twhere
( )
( )
1 1 s l l tC V t
=
+ and C describes the proliferation rate of CD4
+
T-cells in the plasma
eliciting an immune response, due to the effect of stimulating the immune system antigen; this explains the in-creased turnover member of CD4+T-cells;
s
k —is the infection rate of CD4+T-cells by the virus.
In Equation (2): k V t T ts s
( ) ( )
—the growth rate of infected CD4+
T-cells as the virus infects T-cells; m T t1 s
( )
—a loss due to mortality of the infected cells;
( ) ( ) ( )
2 s s
l t T t V t where
( )
( )
2 2 i s l l tC V t
=
+ is a saturation coefficient describes the death of infected cells owing to the presence of the virus.
In Equation (3): The virus population increases due to the term l t T3
( ) ( ) ( )
S t V ts where( )
( )
3 3
I s l l t
C V t
= + this term describes the increase in the population of virus in the blood. The dependence of this term on TS
( )
ttakes into account the reduction in the proliferation of the virus in the plasma when the concentration of infected CD4+T cells in the plasma decreases. Since most virus enters into the plasma from the external source of lymph, the plasma viral population during the final stage of the infection grows rapidly; kV
( ) ( ) ( )
t T t VS t -describes thedestruction of the virus by the immune system;
( )
( )
( )
S S SS
G V t
G t
B V t
=
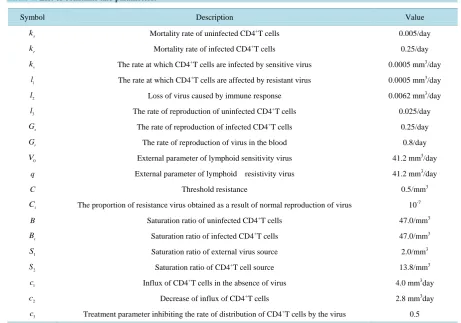
Table 1. List of constants and parameters.
Symbol Description Value
s
k Mortality rate of uninfected CD4+T cells 0.005/day
r
k Mortality rate of infected CD4+T cells 0.25/day
v
k The rate at which CD4+T cells are infected by sensitive virus 0.0005 mm3/day
1
l The rate at which CD4+T cells are affected by resistant virus 0.0005 mm3/day
2
l Loss of virus caused by immune response 0.0062 mm3/day
3
l The rate of reproduction of uninfected CD4+T cells 0.025/day
s
G The rate of reproduction of infected CD4+T cells 0.25/day
r
G The rate of reproduction of virus in the blood 0.8/day
0
V External parameter of lymphoid sensitivity virus 41.2 mm3/day
q External parameter of lymphoid resistivity virus 41.2 mm3/day
C Threshold resistance 0.5/mm3
i
C The proportion of resistance virus obtained as a result of normal reproduction of virus 10-7
B Saturation ratio of uninfected CD4+T cells 47.0/mm3
s
B Saturation ratio of infected CD4+T cells 47.0/mm3
1
S Saturation ratio of external virus source 2.0/mm3
2
S Saturation ratio of CD4+T cell source 13.8/mm3
1
c Influx of CD4+T cells in the absence of virus 4.0 mm3day
2
c Decrease of influx of CD4+T cells 2.8 mm3day
3
c Treatment parameter inhibiting the rate of distribution of CD4+T cells by the virus 0.5
3. Linearization Technique
The similarity of a nonlinear system to a linear system in the local region of each singular point can be forma-lized by linearizing the nonlinear system as we now discuss.
If the singular point of interest is not the origin, by defining the difference between the original state and the singular point as a new set of variables, one can shift the singular point to the origin. Therefore, without loss of generality, we may simply consider Equation (1) with a singular point (0, 0, and 0) [6]. Thus (1a-c) can be re-written as a system
( )
( ) ( )
( )
( )
( )
(
)
( )
( ) ( )
( ) ( ) ( )
(
)
( )
( )
( ) ( )
( )
(
)
1 1
1 2 2
3 3 d , , d d , , d d , , d
S s S S S
s
s s s s S S
S
s v s s S S
T t
l t V t k V t m T t S t f T T V
t T t
k V t T t m l t V t T t f T T V
t
V t
l T t k T t V t G t f T T V
t = − − + = = + − − = = − + = (2)
We can write (2a-c) as
( )
( )
d d Y
AY t g t
t = + (3)
where
11 12 13
21 22 23
31 32 33
a a a
A a a a
a a a
= ,
( )
( )
( )
0 s S t g t G t = − , Y t
( )
=[
T T V, s, s]
T.( )
1 d d Y AY tt = (4)
where (3) is equal to (4) if g(t) is neglected. By [11], the nonlinear system (3) is a perturbation of the associated linear system (4). Now for system (2) the Jacobian matrix is given as
1 1 1
2 2 2
3 3 3
S S
S S
S S
f f f
T T V
f f f
J
T T V
f f f
T T V
∂ ∂ ∂ ∂ ∂ ∂ ∂ ∂ ∂ = ∂ ∂ ∂ ∂ ∂ ∂ ∂ ∂ ∂ (5)
We find that this system has one equilibrium point
(
S m1 , 0, 0)
. The Jacobian at the fixed point(
S m1 , 0, 0)
is
(
)
2 1 1
* 1 1 1 0 0 0 0 S S s S V
m S B S l Ck C m
J m k S m
G B S k m
− − + − = − − (6)
The characteristic equation of (6) is given by
*
0
J −λI = (7)
(
)
2 1 1
1 1 1 0 det 0 0 0 S S S S v
m S B S l Ck Cm
J I m k S m
G B S k m
λ λ λ λ − − − + − − = − − − − (8)
Since the system is three-dimensional, we use the Routh-Hurwitz criterion to establish the negativity of the real parts of the roots of the characteristic equation and therefore stability of the equilibrium under consideration. For a three-dimensional system see [12] [13], with a characteristic equation of the form:
3 2
0,
a b h
λ + λ + λ+ =
The Routh-Hurwitz criteria state that all roots of the characteristic equation have negative parts (local stability) if and only if a>0,h>0,ab>h.
Analysis of the characteristic equation evaluated at the fixed point, shows that it is unstable. It is however sta-ble if Gs=0.
4. Numerical Simulation and Analysis
Using MathCAD, we employed Runge Kuta method of order 4 to obtain our simulations. It has been reported that during acute infection the individual become antigenic and viremic. High levels of infectious virus can be detected in the peripheral blood [14]. With the initial conditions as given above, we investigate the influence of the viral reproduction rate on the three variables. Our calculations with the same initial conditions are shown to be consistent with results from the authors in [4] [9]. This fact validates our computational work with the models which are without treatment in [4] [9]. In [4] [9], they showed that remission depended on a certain threshold of the virus level.
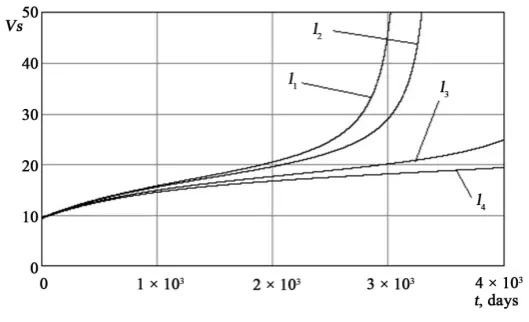
Figures 1-3 are the numerical solutions to Model 1. The parameter values used to generate these figures can be found in Table 1[10]. The simulations of the dynamics are with T(0) = 600/mm3, Ts(0) = 0, Vs(0) = 10. The
Figure 1. Graphical simulations of uninfected CD4+T cells against time.
Figure 2. Graphical simulations of infected T cells against time.
Figure 3. Graphical simulations of virus cells against time.
impossible and may be unnecessary. In Figures 1-3, the curves l ii, =1, 2, 3, 4 represent the values 0.8,0.75,0.6 and
5 .
0 respectively.
As shown in [4], the curves of Figures 1-3 are consistent with the results of clinical trials of HIV [15]-[18]. After a period of acute infection during the first few weeks after seroconversion, the number of CD4+T cells gradually decline from approximately from 600 - 800 units mm3 to zero over a period of time equal to ap-proximately 10 years (normal number of CD4+T cells varies in the range of 800 - 1000 units mm3
) [15] [17]. The decline of T is more rapid in the early stage of infection [16] (wherein infected CD4+T cells
( )
Tsconsti-tute up to 4% of the total number of CD4+T cells T[14]). The life expectancy of infected CD4+T Ts cells is
approximately equal to two days [18]. After an initial period of acute infection, virus increases from below
3
50 units mm to 1000 units mm3
[image:6.595.182.447.401.562.2]5. Conclusion
Mathematical modeling of the dynamics of the development of HIV in the immune system has led to a number of important insights about the dynamics and pathogenesis of HIV infection. A dynamical model of the interac-tion of HIV and the immune system was presented. We have tried to demonstrate how mathematical modeling can help us to understand HIV pathogenesis. We obtained the solution of the system both analytically and nu-merically. We applied perturbation and stability theory to obtain our analytic results. Our numerical results are consistent with typical clinical course of HIV infection.
References
[1] Kirschner, D. (1996) Using Mathematics to Understand HIV Immune Dynamics. Notice of the AMS, 43, 191-202. [2] CD4 (2015). https://en.wikipedia.org/wiki/CD4
[3] Time between Initial HIV Infection and AIDS Is not Symptom-Free (2009).
http:www.thebodypro.com/content/art51231.html
[4] Kirschner, D. and Webb, G.F. (1997) Resistance, Remission, and Qualitative Difference in HIV Chemotherapy.
Emerging Infectious Diseases, 3, 273-283. http://dx.doi.org/10.3201/eid0303.970303
[5] Perelson, A.S. and Nelson, P.W. (1999) Mathematical Analysis of HIV-1 Dynamics in Vivo. SIAM, 41, 3-44.
http://dx.doi.org/10.1137/S0036144598335107
[6] Perelson A.S, Kirschner D.E. and Boer, R.D. (1993) Dynamics of HIV infection of CD4+T Cells. Mathematical Bios-ciences, 114, 81-125. http://dx.doi.org/10.1016/0025-5564(93)90043-A
[7] Wodarz, D. and Nowak, A. (2002) Mathematical Model of HIV Pathogenesis and Treatment. Bioessays, 24, 1178-1187.
http://dx.doi.org/10.1002/bies.10196
[8] Shi, V., Trdane, A. and Kung, Y.A. (2008) Viral Load Based Cellular Automated Approach to Modeling HIV Dynam-ics and Drug Treatment. Journal of Theoretical Biology, 253, 24-35. http://dx.doi.org/10.1016/j.jtbi.2007.11.005
[9] Pritikin, D.A. (2007) Optimal Control Mathematical Model of HIV Infection. Thesis for Scientific Degree of Candi-date of Physical and Mathematical Sciences. Moscow, 110.
[10] Ogban, G.I. and Lebedev, K.A. (2015) Mathematical Model of the Dynamics of HIV Infection without Treatment. Po-lytheistic Online Scientific Journal of Kuban State Agrarian University [Electronic Resource], No. 110.
http://ej.kubagro.ru/2015/06/pdf/38.pdf
[11] Hale, J.K. (1969) Ordinary Differential Equations. New York.
[12] Jean-Jacques, E.S. and Weiping, L. (1991) Applied Nonlinear Control. New Jersey.
[13] Routh-Hurwitz Stability Criterion (2009). https://en.wikipedia.org/wiki/Routh-Hurwitz_stability_criterion [14] Levy, J.A. (1993) Pathogenesis of Human Immunodeficiency Virus Infection. MMBR, 57, 183-289. [15] Pennisi, E. and Cohen, J. (1996) Eradicating HIV from a Patient: Not Just a Dream? Science, 272, 1884.
http://dx.doi.org/10.1126/science.272.5270.1884
[16] Philips, A.N., Sabin, C.A., Miocroft, A., et al. (1995) Antiviral Therapy. Nature, 375, 195.
http://dx.doi.org/10.1038/375195a0
[17] Pokrovsky, V.V., Ermak, N., Belyaeva, V.V. and Yurt, E.G. (2000) HIV Infection. The Clinic, Diagnoses and Treat-ment. Geotar Medicine.