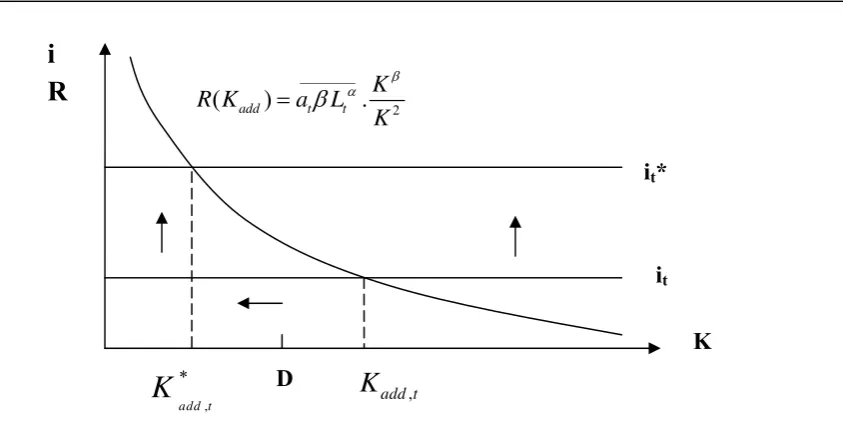
Procyclical Effects of the banking System during the financial and economic Crisis 2007 2009: the Case of Europe
Full text
Figure


Related documents
No doubt in the majority of cases there will be a positive benefit to the child of having a significant relationship with both parents, but there will also be some cases where
The market opens up, technical information is exchanged, seller production cost and buyer utility functions are communicated to the auctioneer, the market clearance model is solved
Christ before Pilate at the trial of Jesus revealed one of his last claims. Jesus and his word are ultimate truth. The Pontius Pilate and Jesus exchange set the two positions
The tissue may be packaged as COMPACT bone = dense bone for major weight-bearing areas as in the Long bones or as CANCELLOUS bone = spongy bone = trabechular bone, which is present
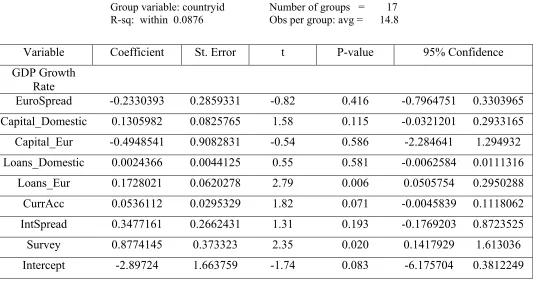
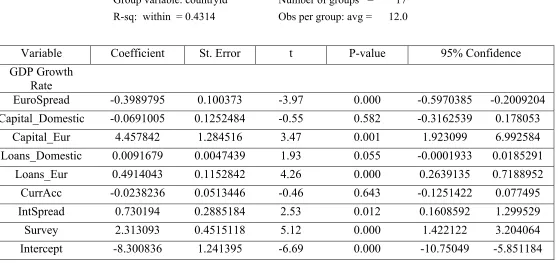
Subsequently, Lane and Milesi-Ferretti (2011) measure the country effects of the crisis by the change in GDP growth and in its demand-side components. They too view growth rates
4 (left) shows the basic networks. As for the checker & radial pattern, the start points could be on lines or corners of the rectangular 1 st ring. The points on lines
Tillegg: 3 kg for hester som har seiret i 2008... Høyeste formtall =
Here the court shifts from the principle/application distinction of patent eligibility to the question of “invention”—the quantum of ingenuity required of a patentable advancement
