http://dx.doi.org/10.4236/aast.2016.11001
Engaging Aerospace Students Using
Interactive Web-Based Techniques
Adeel Khalid
Systems and Mechanical Engineering, Kennesaw State University, Marietta, USA
Received 19 April 2016; accepted 3 June 2016; published 6 June 2016
Copyright © 2016 by author and Scientific Research Publishing Inc.
This work is licensed under the Creative Commons Attribution International License (CC BY). http://creativecommons.org/licenses/by/4.0/
Abstract
Most engineering courses require some level of work to be done by students using internet. A vast majority of material taught in classes is available online. Theoretically, a student could learn al-most everything they want from the online resources. In this research, a comparative study is done between students learning and understanding when some basic aerospace concepts are taught in a traditional lecture based classroom versus when students are told to look for the same material on the internet. The results indicate that, although all the material taught in the class-room is available on the internet, students do not perform better when they exclusively use inter-net for learning. However a traditional lecture based class coupled with interinter-net resources yields the favourable results.
Keywords
Web-Based, Interactive, Aerospace, Student Engagement
1. Introduction
The goal of this research is to explore the best classroom learning approach for engineering students. The idea of deductive vs. inductive techniques has been explored extensively in liberal arts. In recent studies, it has been shown that students learn better when they are given the task of student centered active learning in a classroom
ex-plore and see if similar approach can be applied to the engineering students. The style, in which the engineering curriculum is presented, is significantly different from that of the liberal arts. The liberal arts courses are tradi-tionally knowledge based, whereas engineering courses are knowledge and problem solving based, critical thinking intensive and often numerically challenging. In this study, the investigators will explore whether the inductive techniques successfully implemented in the liberal arts are also applicable in the engineering disci-plines [4].
The study is based on the hypothesis that the use of multimedia devices and online learning in classrooms can significantly enhance student learning and retention. An experimental research study is conducted on multidisci-plinary engineering students. The control group is taught certain aerospace engineering concepts using tradi-tional lecture based methodologies. The experiment group is taught the same material by letting students learn the material by exploring on their own using the World Wide Web. Bias is removed by using students and in-structors, with no prior acquaintances, in each group. Similarly the material introduced to each group, although engineering based, is unique in the sense that the students have not been previously exposed to it. The results of the two groups are compared and the hypothesis is tested. Student performance in each group is also compared based on age, ethnicity, major, year of study in college, and previous job experience.
2. Hypothesis
Student learning in an engineering class can be improved through interactive online classroom activities includ-ing supervisinclud-ing students to learn the material on their own, by lettinclud-ing them explore through the text book, inter-net, and use of multi-media devices e.g. cell phone, IPod touch, Ipad, etc.
3. Teaching Approaches
To verify the hypothesis, study these approaches, collect data, and compare results, the following different styles of teaching are used in several different engineering classes of similar level.
Case A: Traditional classroom style of teaching using Power Point slides, and white/blackboard is employed. The instructor does most of the talking and students listen passively. At the end of the study, students take a quiz.
Case B: The instructor uses props to describe different concepts. Students listen, are encouraged to ask ques-tions, and see and touch the model (prop) and then take the test at the end of the lecture.
Case C: The instructor introduces the topics of discussion and asks student to explore the subject matter. Stu-dents use internet, handheld devices, books, discussion, and other sources to collect information on their own. Instructor is present to answer any questions during the exploratory period. Students are also encouraged to dis-cuss amongst each other. Students take the test at the end of the exploratory period.
All three groups are given equal amount of time e.g. in Case A, if the instructor takes 15 minutes to explain a concept by writing information on the board, or in Case B by using props, the same amount of time is given to students in case C to explore the subject matter on their own.
4. Data Collection
After the lecture in Case A and B, or self-guided study in Case C, students are given a quiz from the material that they are required to learn. At the end of the quiz, there is a small survey. Following data is collected from the students as part of the test at the end of the study.
Age; Major;
Year of study in college (freshman, sophomore, junior, senior etc.); Current job title (if any);
Previous job title (if any).
This data helps isolate the outliers. It also helps the investigators put results of different groups in different categories and draw inferences.
5. Test Questions
instructions given to the students to find the relevant material using the internet. Since the same material is cov-ered in all three cases, identical quizzes are given in all three cases. Screenshots of the quiz given to students are shown inFigures 1(a)-(c).
Students are also introduced the equation of lift. Questions 3, 4, and 5 can be answered when the equation of lift is understood.
2
1
2 L
L= ρυ AC
where
L is lift force, ρ is air density, v is true airspeed, A is planform area, and
CL is the lift coefficient at the desired angle of attack, Mach number, and Reynolds number [5].
In Case C, students are given the resources that they can explore on the internet to understand the equation of lift. The same quiz is given to all groups. Questions 3, 4, and 5 help determine whether students can understand mathematical equations and engineering formulas on their own in Case C. The relationships between lift pro-duced by the wings of an aircraft and aircraft velocity, air density, and angle of attack can only be completely
(b)
[image:4.595.245.405.150.259.2](c)
Figure 1. (a) Screenshot of the quiz questions; (b) Screenshot of the quiz questions (Continued); (c) Screenshot of the quiz questions (Continued).
Vertical Lateral
understood if the student learns and understand the equation of lift. The comparison of student performance in questions 1, and 2, which are knowledge based, with questions 3, 4, and 5, which are analytical, help determine whether students learn different types of knowledge using the same method of teaching. Evaluation of perform-ance of students in questions 3, 4, and 5 help determine whether there is a difference in student learning when taught by the instructor (Case A and B) and when students learn formulas and engineering equations on their own (Case C).
The last question in the survey, which asks about student’s perception of internet usage to learn class material, will help determine whether they actually learn material better or whether they perceive it that way and vice versa.
6. Qualitative Results
The results obtained from the above survey are compared both qualitatively and quantitatively for each case. Some of the qualitative student responses received for Case A are listed inTable 1.
Case A indicates that students who do not to use the internet and are taught using the traditional lecture based technique, generally like the idea of being able to use the computer, hand-held devices etc. to access to internet to learn the material. The qualitative results obtained for Case B are shown inTable 2.
Table 1. Qualitative responses for Case A.
Like
• Like the option of different ideas • The information is always available • Liked it-all very interesting • Good Graphics
Dis-Like
• Dislike: Ambiguity in learning goals
Table 2. Qualitative responses for Case B.
Like
• It was fine—I wish you pointed more to the diagram • It provided a good visual aid
• Liked the props
• Love it! Its there—lets use it • Quick/Easy access to information • The diagram was helpful
• I am sorry I was not paying attention, I was reading something else-You teach in a really good way. This university needs more professors like you.
• Good-Since I have a laptop, I could find the images and material used and save them for my notes. • Students can focus on what they need to
• Helped but not needed
• it was fast and promoted multimedia use
• I actually liked it better than a bunch of words on the white board • It helped with graphical representation
• Positive: Fast detailed information,
Dislike
• Hard to see
• Bad: It is difficult to take notes and absorb all material because power point and graphics allow for quick and in depth presentation but there is often too much, too fast to absorb it all
In Case B, students are taught using the traditional lecture; and additionally relevant props are used. In this study, a model aircraft is used. The instructor points to different parts of the aircraft on the model while ex-plaining their functions. The maneuvers of the aircraft are also discussed using the model aircraft. Case B indi-cates that students who do not use the internet and are taught using the traditional lecture based technique and the use of props, generally like the idea of being able to use the computer, hand-held devices etc. to learn the material. The qualitative results obtained for Case C are shown inTable 3.
In Case C, students are not taught using the traditional lecture, but are instead given the flexibility to search for material online. The class is held in a computer lab where all students have access to computers. Students are directed to go to pre-selected websites to look for information. Students are also informed about the possible questions on the test. The instructor is available to help them search for material, direct them to the correct sources for information and answer any questions. The instructor also interjects several times to ensure that all the students are looking for the material that they are required to find.
As seen inTable 1 and Table 2, students perceive that if they are allowed to use the internet to search for material, they will learn better. However, when they are given the option of using the internet in Case C, a num-ber of students realize that it is not the best way for them to learn. Some students indicate that they get informa-tion overload, some claim of dis-organizainforma-tion, and yet others state that the instructor is not actively involved in teaching. The qualitative data indicates that there are mixed feelings amongst students about the use of internet to learn material. Until they are exposed to the method, they are either un-sure about how it would work or think that it would facilitate learning. On the other hand, when self-guided learning is encouraged and they are given the freedom to look for material on their own, with the instructor’s moderation, about 50% of the students claim that the use of internet does not help them in learning. This qualitative data is subjective—it is the individual’s interpretation of the event but is useful to understand the contextual details. It is rich, but less able to be general-ized. Data between Cases A, B, and C are also compared quantitatively.
7. Quantitative Results
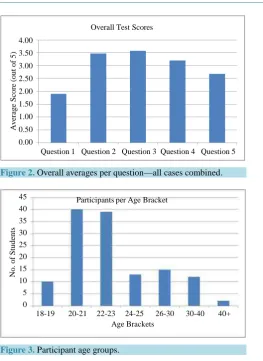
To be able to test the hypothesis, it is important to analyze the quantitative data. The total number of students surveyed in all cases combined is 150. The overall scores in all cases for each question are shown inFigure 2. It is observed that students generally perform better in questions 2, 3, and 4 compared to question 1. Question 1 has several parts—the idea is to memorize the names of parts of the aircraft. Students tend to understand the equation of lift better and answer questions based on that, than memorizing the names of the parts of the aircraft. As shown inFigure 3, most of the participants are in the 20 - 23 year old age group. The common denomina-tor amongst all these age groups is that they are all undergraduate students and have not taken any Aerospace related classes in the past.
Figure 4shows the number of student participants in different majors. The Civil and Mechatronics engineer-ing majors at Southern Polytechnic State University are the largest programs in the Division of Engineerengineer-ing. The typical core classes in these disciplines have more students than the other majors. There is a large number of Mechanical Engineering Technology students on campus. But the survey is not taken in any of the MET core classes. The presence of MET students in participants reflects those students taking classes outside their major.
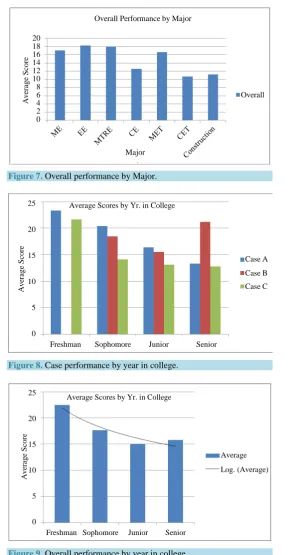
The first set of results is shown inFigure 5 andFigure 6. It is important to observe that generally younger students perform better than older students in all categories. This trend can specially be seen in Case A where the traditional classroom method of instruction is used. It can also be observed that students in early 20s per-formed better in Case B. At this age, they have most likely taken their first year of college courses and are used to the college environment. When a lecture is given, and props are used, this age group tend to learn the most. The overall scores by age group in all three cases are shown inFigure 6. It can be seen that the general trend is a decrease in performance with age.
Although the concepts introduced in this study are generic, it appears that students in certain majors tend to perform than other majors. For example, as shown inFigure 7, Mechatronics and Electrical Engineering majors tend to perform better than Civil, Construction, and Civil Engineering Technology major students. This may be due to their interest in the field—which indirectly dictates their motivation to participate in the study and learn the material.
Table 3. Qualitative responses for Case C.
Like
• Easily Accessible information
• Good-Not bad
• Very Helpful
• Helps being able to search yourself
• I liked the variety
• More Interesting
• Liked but not enough time, Good material
• Fun
• Very Helpful
• Interactive
• I am a visual learner, so images are helpful. Also the fact that info on the internet is virtually endless, means that I can find what I want, as long as I know what I am looking for.
• Informative for 15 minutes
• Like: Internet is fine for learning,
• I was able to adapt my learning to a style that works for me rather than how the instructor chooses to teach
• Freedom
• Interesting approach-need more research time though
• I thought it was helpful
• Greater variety of sources
• Eye problem, but increases learning
• Liked the ability to access more information, but had too many ways to get distracted from the goal
• New
• Freedom to concentrate on what you found interesting was good-I did’nt know what I was expected to learn except in a broad sense
• Like, I can learn on my own pace, and view what I want
• I prefer this method
• Liked learning about aircraft
• I liked it!
• Variety of sources
Dislike
• Searching would have been too vague if I had not already known exactly what would be on the quiz
• Nothing—All information was given easily. Lack of time for memorization
• Too much information at one time
• Dislike (4 responses)
• Non-Credible sources
• Knowledge needed is misguiding
Continued
• Works well with short term memory but makes students much less apt to truly understand the material • Dislike: lack of professor’s involvement in student’s learning
• It can be misleading, as some sites have different information than what you want the student to learn • Dislike-motivation to sit still
• Use of internet allows for many different websites which could lead to a lack of information depending on the website • It was different—student is not guaranteed to get the correct information
• Internet searches do not always produce desired results
• Not targeted enough. Too easy to find false, irrelevant, or even too detailed (or under-detailed) information
• I did not have a computer—If I wanted to learn from the internet, I would have stayed at home. This is the biggest copout on Education Ever!
• Very Busy
• So many places to look, unsure where most of the questions for quiz would come from • Unsure of information credibility
• Was not clear about assignment • Lack of a computer to use • Search overload
[image:8.595.86.545.93.754.2]• Did not really know specifically what to search for. Too broad of an information source • More interactive but not as organized
[image:8.595.190.454.366.728.2]Figure 2. Overall averages per question—all cases combined.
Figure 3. Participant age groups. Overall Test Scores
A v er ag e S cor e ( ou t of 5 )
Question 1 Question 2 Question 3 Question 4 Question 5 4.00 3.50 3.00 2.50 2.00 1.50 1.00 0.50 0.00 N o . o f S tu d en ts Age Brackets
18-19 20-21 22-23 24-25 26-30 30-40 40+ Participants per Age Bracket
Figure 4. Number of participants by Major.
Figure 5. Case performance by Age Group.
Figure 6. Overall performance by Age Group.
shops as well. The author conducts Aerospace Engineering summer camps for middle and high school students, 12 - 18 year olds, every year on the campus of Southern Polytechnic State University. In the author’s experience, the best performers are usually the youngest, typically 12 year olds in the camp. The high level of performance seen in younger groups in this study can also be attributed to the fact that the university is starting a new Aero-space Engineering (AE) program. The freshmen and sophomore students have interest in this field because they understand that they can earn a minor in AE. This motivation does not exist in the senior level students who are typically close to graduation and are not interested in taking any more college courses. They are usually looking to get out of college and get a job. Part of it may also have to do with intrinsic motivation and its variation with age. Some researchers believe that there is only a single kind of intrinsic motivation, which can be described as a
N o . o f S tu d en ts
No. of Participants by Major
EE ME MET Mechatonics Civil Engr 40 35 30 25 20 15 10 5 0 A v er ag e S cor e Age Brackets
18-19 20-21 22-23 24-2 26-30 30-40 40+
Case A
Case B
Case C Case Performance by Age Group
25 20 15 10 5 0
Overall Performance by Age Group
Overall
Log. (Overall)
Age Brackets
18-19 20-21 22-2 24-2 26-30 30-40 40+
Figure 7. Overall performance by Major.
Figure 8. Case performance by year in college.
Figure 9. Overall performance by year in college.
motivation to engage in activities that enhance or maintain a person’s self-concept [6]. Malone and Lepper [7]
have defined intrinsic motivation more simply in terms of what people will do without external inducement. In-trinsically motivating activities are those in which people will engage for no reward other than the interest and enjoyment that accompanies them. Malone and Lepper have integrated a large amount of research on motiva-tional theory into a synthesis of ways to design environments that are intrinsically motivating. In this research, Case C is designed to motivate students to learn on their own.
A v er ag e S cor e
Overall Performance by Major
Overall Major 20 18 16 14 12 10 8 6 4 2 0 A v er ag e S cor e
Average Scores by Yr. in College
Case A
Case B
Case C
Freshman Sophomore Junior Senior 25 20 15 10 5 0 A v er ag e S cor e
Freshman Sophomore Junior Senior Average Scores by Yr. in College
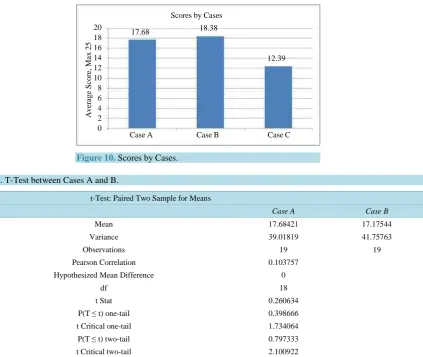
The overall performance of students in the three cases is shown inFigure 10. The total possible score is 25. Contrary to the expected result, students do not perform as well in Case C, as they do in Cases A and B. The av-erage score in Case C, is significantly lower than those in Cases B and C. This result does not support the hy-pothesis. Students are expected to learn better when they are given the opportunity to explore on their own. The instructor is present at all times to guide them and answer any questions. The best results are seen in case B, where students learn not only by listening to the lecture, but also by seeing the model aircraft. They relate and remember better when a real life example is presented. The author believes that students do not perform well in Case C because they have not been exposed to this idea of self-guided learning in the past. In all their years of education, they have mostly been passive learners. Due to the current education system, in every class they have taken since the kindergarten, the instructor is the source of all knowledge and students are expected to learn di-rectly from them. In this exercise, they are expected to learn from a different source. So the role of the instructor changes from being the feeder of knowledge to a facilitator. A number of students are either not familiar or not comfortable with this new approach. The author believes that student-centered, inductive, active learning tech-niques are the best method to engage engineering students and can help them learn and retain the material. Stu-dents need to be trained for this new method of learning. If they are exposed to this method for a significant pe-riod of time, their performance will increase. It is reasonable to expect that students will perform better in the long run if they are subjected to the inductive style of teaching.
8. Quantitative Results
[image:11.595.115.539.364.721.2]Cases A and B are compared using t-test with a 95% confidence interval. The first 19 observations are used for Case B. The results indicate that the two means are not statistically different. Similar results are obtained when Case A is compared with the last 19 observations for Case B. Results are listed inTable 4.
[image:11.595.89.537.547.722.2]Figure 10. Scores by Cases.
Table 4. T-Test between Cases A and B.
t-Test: Paired Two Sample for Means
Case A Case B
Mean 17.68421 17.17544
Variance 39.01819 41.75763
Observations 19 19
Pearson Correlation 0.103757
Hypothesized Mean Difference 0
df 18
t Stat 0.260634
P(T ≤ t) one-tail 0.398666
t Critical one-tail 1.734064
P(T ≤ t) two-tail 0.797333
t Critical two-tail 2.100922
Case A Case B Case C
Scores by Cases
A
v
er
ag
e
S
cor
e,
M
ax
2
5
17.68 18.38
12.39 20
Table 5. Single factor ANOVA analysis.
Anova: Single Factor
SUMMARY
Groups Count Sum Average Variance
Case A 19 336 17.68421 39.01819
Case B 34 625 18.38235 35.05813
Case C 96 1189.6 12.39167 43.73158
ANOVA
Source of Variation SS df MS F P-value F crit
Between Groups 1131.184 2 565.5921 13.73128 3.43E-06 3.05805
Within Groups 6013.746 146 41.19004
Total 7144.93 148
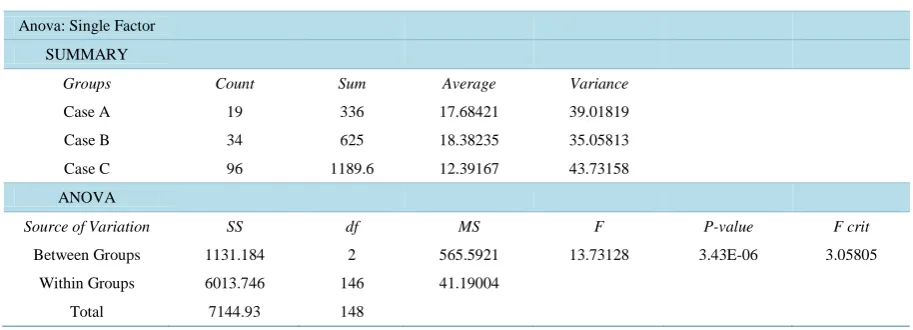
Analysis of Variance (ANOVA) is conducted to determine whether there is a statistical difference between the mean scores for cases A, B, and C. A 95% confidence interval is used. The null hypothesis is that the means of all the cases are statistically similar and the alternative hypothesis is that they are significantly different. The results of the ANVOA test are shown inTable 5.
The null hypothesis is rejected because p < 0.01. In other words, the means are different. A paired t-Test be-tween the averages of Case A and Case B indicates that they are statistically not significant. This demonstrates that the statistical difference exists between Case C and Cases A and B. In other words, students performed worse statistically when they were allowed to use computers to search for material to be taught in the class.
9. Conclusion
In this study, the goal is to discover whether engineering students can learn and retain the material, if student- centered, inductive style of teaching is used. Three different styles of teachings are compared. These are A: tra-ditional lecture style, B: lecture combined with the use of props and C: students use internet to learn the material in class, and the instructor moderates the learning process. Data are collected for the three groups. The expecta-tion is that the use of internet will facilitate better learning. It will engage students, and motivate them to learn the material on their own. Data is compared qualitatively and quantitatively. Students often think that they will learn better if internet is available to them. On the contrary, students perform worse when only the internet is used as the source of learning. It is observed that students learn the material the best in Case B, where props and visual aids are used to facilitate learning. Student performance in Case C is significantly inferior to Cases A and B. The author believes that this is due to the fact that engineering students have most likely never been exposed to the inductive style of teaching. If students are familiar with this method of teaching and learning, and this method is used for a significantly long period of time, it can be expected that students will learn and retain the material better and their performance will improve over the other styles of instruction. The use of internet in conjunction with the traditional lecture based teaching and the use of props is also expected to produce favorable results.
References
[1] Prince, J.M. and Felder, M.R. (2006) Inductive Teaching and Learning Methods: Definitions, Comparisons, and Re-search Bases. Journal of Engineering Education, 95, 123-138. http://dx.doi.org/10.1002/j.2168-9830.2006.tb00884.x [2] Brigham, F. and Matins, J.J. (1999) A Synthesis of Empirically Supported Best Practices for Science Students with
Learning Disabilities. Annual International Conference on the Association for the Education of Teachers in Science, Austin.
[3] Inductive and Deductive Methods of Teaching.
http://www.articlesbase.com/writing-articles/inductive-and-deductive-methods-of-teaching-1059831.html [4] Paradowski, M.B. (2009) Deductive vs. Inductive Teaching. Version 3.
[6] Pintrich, P.R. (2003) A Motivational Science Perspective on the Role of Student Motivation in Learning and Teaching Contexts. Journal of Educational Psychology, 95, 667-686. http://dx.doi.org/10.1037/0022-0663.95.4.667