Contrast Limited Adaptive Histogram Equalization for
Qualitative Enhancement of Myocardial Perfusion Images
Neethu M. Sasi, V. K. Jayasree
Govt. Model Engineering College, Cochin University of Science and Technology, Thrikkakkara, Kerala, India Email: neethumsasi@gmail.com, jayasreevk@gmail.com
Received May 2013
ABSTRACT
This paper establishes an efficient color space for the contrast enhancement of myocardial perfusion images. The effects of histogram equalization and contrast limited adaptive histogram equalization are investigated and the one which gives good enhancement results is extended to the suitable color space. The color space which gives better results is chosen experimentally. Uniqueness of this work is that contrast limited adaptive histogram equalization technique is applied to the chrominance channels of the cardiac nuclear image, leaving the luminance channel unaffected which results in an enhanced image output in color space.
Keywords: Myocardial Perfusion Images; Single Photon Emission Computed Tomography; Histogram Equalization
1. Introduction
Medical imaging applies a lot of digital image processing techniques for better interpretation. Different enhance-ment techniques are available in literature for improving the quality of medical images. The major challenge in this area is that a specific algorithm which gives better results for a particular type of application may fail in giving good results for another type of application. Dif-ferent popular imaging modalities are now available for detecting cardiac disorders. This work mainly concen-trates on color images obtained from Single Photon Emi- ssion Computed Tomography (SPECT) systems which are designed to analyze the functioning of the heart [1]. This work is meant for improving the pictorial represen-tation of the above mentioned images, thus providing a more accurate diagnosis of cardiac abnormalities.
One of the many purposes of taking nuclear heart scan is to check the blood flow to the heart muscle. If the heart muscle is not getting enough blood it may be a sign of coronary heart disease. When a nuclear heart scan is done for this purpose, it is called myocardial perfusion scanning [2].
Different image enhancement techniques are available in the literature [3]. Primarily, an image enhancement technique is done to process an image so that the result-ing image gives more visual information than the original image. Nuclear medicine images suffer from a large amount of blur. A few studies are available in literature regarding the enhancement of nuclear images. A method of enhancement of noisy planar nuclear images using
mean field annealing was proposed by Falk et al. [4]. Wang et al. uses a combined technique of mean field annealing and gradient edge detection to extract the boundary of left ventricle in [5]. The work discussed so far focused on gray scale images.
Contrast limited adaptive histogram equalization have been successfully proven to be effective in biomedical image analysis. Pisano et al. proposed contrast limited adaptive histogram equalization for detecting abnormali-ties in dense mammograms in [6].
This work presents the effect of contrast limited adap-tive histogram equalization techniques on myocardial perfusion images in color space. The paper is organized as follows. The basic histogram equalization technique is presented and it discusses about contrast limited adaptive histogram equalization. The method suitable for myocar-dial images is explained and the experimental results are analyzed and finally the paper is concluded.
2. Histogram Equalization
N. M. SASI, V. K. JAYASREE 327
and then the probability density function (PDF) of the image is given by Equation (1). The cumulative density function (CDF) is defined in Equation (2).
( ) k i k
n f i
N
= (1)
0
( ) ( )
k
k k i j
j
F i f i
=
=
∑
(2)Though this method is simple, it fails in myocardial nuclear images since the gray values are physically far apart from each other in the image. Due to this reason, histogram equalization gives very poor result for myo-cardial images.
3. Contrast Limited Adaptive Histogram
Equalization
In contrast limited histogram equalization (CLHE), the histogram is cut at some threshold and then equalization is applied. Contrast limited adaptive histogram equaliza-tion (CLAHE) is an adaptive contrast histogram equali-zation method [7-10], where the contrast of an image is enhanced by applying CLHE on small data regions called tiles rather than the entire image. The resulting neigh-boring tiles are then stitched back seamlessly using bili-near interpolation. The contrast in the homogeneous re-gion can be limited so that noise amplification can be avoided.
4. Contrast Limited Adaptive Histogram
Equalization for Myocardial Perfusion
Images in Color Space
In this method, the image which is read in RGB space is converted into the color space with a luminance (Y) and two chrominance components (Cb, Cr) by using the rela-tion given in Equarela-tion (3).
16 65.481 128.553 24.966 128 37.797 74.203 112.000 128 112.000 93.786 18.214
Y R Cb G Cr B = + − − − − (3)
The two chrominance channels are separated and for each chrominance channel the number of rectangular contextual tiles into which the image is divided is ob-tained. The optimal value for this is decided experimen-tally. Uniform distribution is used as the basis for creat-ing the contrast transform function. Let ic_min and ic_max be
the minimum and maximum permissible intensity levels and the optimal value of this clip limit is also set. Let Fk(ic_in) be the cumulative distribution function for input
contextual tile ic_in. Then the expression of the modified
chrominance channel tile with uniform distribution is given in Equation (4). The flowchart for the method is given in Figure 1.
_ _ max _ min * ( _ ) _ min
c out c c k c in c
i =i −i F i +i (4)
5. Experimental Results
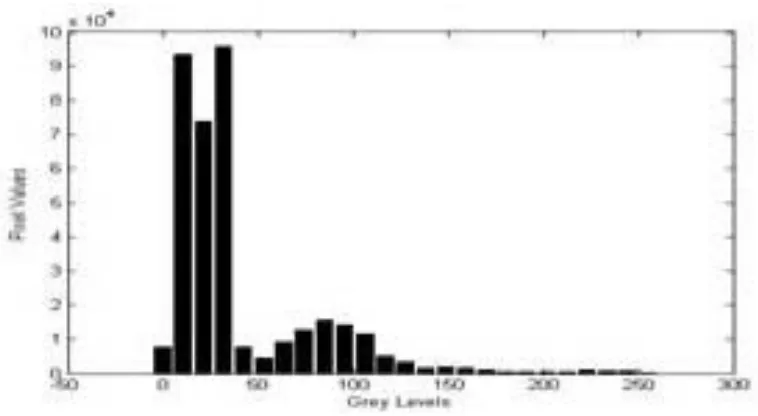
[image:2.595.325.507.267.716.2]The algorithm described in Section 4 has been applied to myocardial perfusion images obtained from a SPECT device. Nuclear image data sets from ten different pa-tients, including both normal and abnormal, have been tested with the proposed algorithm in the follow up expe-riments. This paper has included a few images and their results following the enhancements. The original myo-cardial image is given in Figure 2. The histogram of the image can be seen in Figure 3. The equalized histogram by using simple histogram equalization is given in Fig-
Figure 2. Original cardiac SPECT image.
Figure 3. Histogram of the image shown in Figure 2.
ure 4 and the correspondingly processed image is shown in Figure 5. The loss of information due to over en-hancement is evident if we compare the original image in Figure 2 and the enhanced image in Figure 5.
[image:3.595.131.468.387.651.2]N. M. SASI, V. K. JAYASREE 329
Figure 4. Equalized histogram.
Figure 5. Image after simple histogram equalization.
sen by conducting experiments using different image datasets of the same type. Better histogram equalization is obtained by the method described in Section 4 using the said parameters. The contrast of the image has regis-tered an improvement without loss in information as seen in the result in Figure 6. The histogram of the enhanced image by the proposed method is given in Figure 7. Comparing Figure 2, Figure 5 and Figure 6, it can be concluded that the proposed method provides better en-hancement conserving image data integrity.
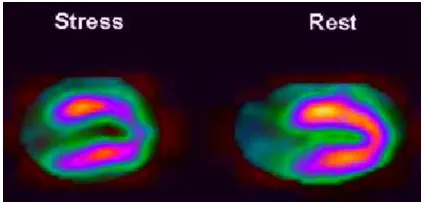
Figure 8 shows a stress-rest portion of the SPECT image. The result of simple histogram equalization is giv-en in Figure 9. The result of applying proposed extgiv-ension of CLAHE is given in Figure 10. The result in Figure 10
concludes that the extended method of CLAHE gives better enhancement for cardiac SPECT images in color space.
6. Conclusion
Figure 6. Processed image using proposed algorithm.
Figure 7. Histogram of the image shown in Figure 6.
Figure 8. A portion of SPECT image showing stress and
[image:5.595.66.278.621.708.2] [image:5.595.319.530.622.718.2]N. M. SASI, V. K. JAYASREE 331
Figure 10. Processed image through proposed algorithm.
sults with image data integrity are obtained by extending CLAHE method to suitable color space containing chro-minance and luchro-minance components. This technique ef-fectively improves the visual interpretation of these types of images thereby ensuring a more accurate guidance to the post-diagnostic procedures in cardiac ailments.
REFERENCES
[1] M. T. Madsen, “Recent Advances in Spect Imaging,” The Journal of Nuclear Medicine, Vol. 48, No. 4, 2007, pp. 661-673.
[2] S. Burrell and A. MacDonald, “Artifacts And Pitfalls in Myocardial Perfusion Imaging,” Journal of Nuclear Medicine Technology, Vol. 34, No. 4, 2006, pp. 193-211.
[3] R. C. Gonzalez, R. E. Woods and S. L. Eddins, “Digital Image Processing,” 2nd Edition, Pearson Education, New Jersey, 2002.
[4] D.L. Falk, D. M. Rubin and T. Marwala, “Enhancement of Noisy Planar Nuclear Medicine Images Using Mean
Field Annealing,” World Congress on Medical Physics and Biomedical Engineering, IFMBE Proceedings, Vol. 4, Track 14, Korea, 2006, pp. 2415-2418.
[5] C. X. Wang, L. Small, W. E. Snyder and R. Williams, “Edge Detection in Gated Cardiac Nuclear Medicine Im-ages,” IEEE 7th Symposium on Computer Based Medical Systems, Winston-Salem, 10-12 June 1994, pp. 28-33.
[6] E. D. Pisano, S. Zong, B. M. Hemminger, M. DeLuca, R. E. Johnston, K. Muller, M. P. Braeuning and S. M. Pizer, “Contrast Limited Adaptive Histogram Equalization Im-age Processing to Improve the Detection of Simulated Spiculations in Dense Mammograms,” Journal of Digit Imaging, Vol. 11, No. 4, 1998, pp. 193-200.
[7] R. Garg, B. Mittal and S. Garg, “Histogram Equalization Techniques for Image Enhancement,” International Jour- nal of Electronics and Communication Technology, Vol. 2, No. 1, 2011, pp. 107-111.
[8] S. Srinivasan and N. Balram, “Adaptive Contrast En-hancement Using Local Region Stretching,” Proceedings of ASID ’06, New Delhi, 8-12 October 2006, pp. 152-155.
[9] S. K. Shome and S. R. K. Vadali, “Enhancement of Di-abetic Retinopathy Imagery Using Contrast Limited Ada- ptive Histogram Equalization,” International Journal of Computer Science and Information Technologies, Vol. 2, No. 6, 2011, pp. 2694-2699.